| Param | Original file | Final file |
|---|---|---|
| Filename | modeM0/AS1T05_053T01_9000005338_37590cztM0_level2.evt | modeM0/AS1T05_053T01_9000005338_37590cztM0_level2_quad_clean.evt |
| Size (bytes) | 476,959,680 | 73,621,440 |
| Size | 454.9 MB | 70.2 MB |
| Events in quadrant A | 2,975,432 | 477,776 |
| Events in quadrant B | 4,783,438 | 442,128 |
| Events in quadrant C | 2,882,367 | 472,290 |
| Events in quadrant D | 3,430,252 | 451,932 |
| Mode SS | |||
|---|---|---|---|
| Quadrant | BADHDUFLAG | Total packets | Discarded packets |
| A | 0 | 114 | 0 |
| B | 0 | 114 | 0 |
| C | 0 | 114 | 0 |
| D | 0 | 114 | 0 |
| Mode M0 | |||
|---|---|---|---|
| Quadrant | BADHDUFLAG | Total packets | Discarded packets |
| A | 0 | 12223 | 3 |
| B | 0 | 17863 | 2 |
| C | 0 | 11991 | 2 |
| D | 0 | 13993 | 2 |
| Mode M9 | |||
|---|---|---|---|
| Quadrant | BADHDUFLAG | Total packets | Discarded packets |
| A | 0 | 20 | 0 |
| B | 0 | 20 | 0 |
| C | 0 | 20 | 0 |
| D | 0 | 21 | 0 |
| Quadrant | Total seconds | Saturated seconds | Saturation percentage |
|---|---|---|---|
| A | 5491 | 29 | 0.528137% |
| B | 5491 | 619 | 11.272992% |
| C | 5491 | 78 | 1.420506% |
| D | 5491 | 173 | 3.150610% |
Noise dominated data is calculated using 1-second bins in cleaned event files. If a bin has >2000 counts, and if more than 50% of those come from <1% of pixels, then it is considered to be noise-dominated and hence unusable.
| Quadrant | # 1 sec bins | Bins with >0 counts | Bins with >2000 counts | High rate bins dominated by noise | Noise dominated (total time) | Noise dominated (detector-on time) | Marked lightcurve |
|---|---|---|---|---|---|---|---|
| A | 7254 | 5492 | 14 | 14 | 0.19% | 0.25% | 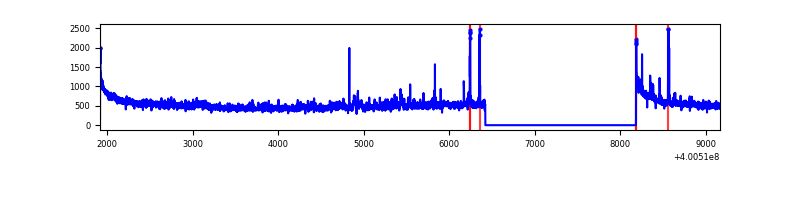 |
| B | 7254 | 5492 | 578 | 578 | 7.97% | 10.52% | 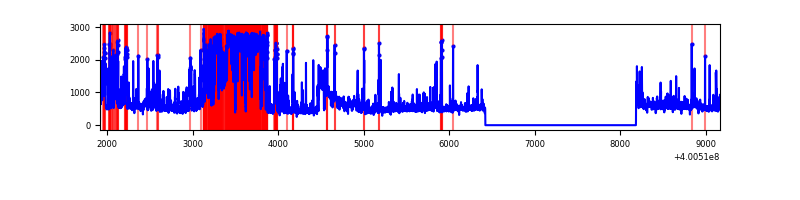 |
| C | 7254 | 5492 | 74 | 74 | 1.02% | 1.35% | 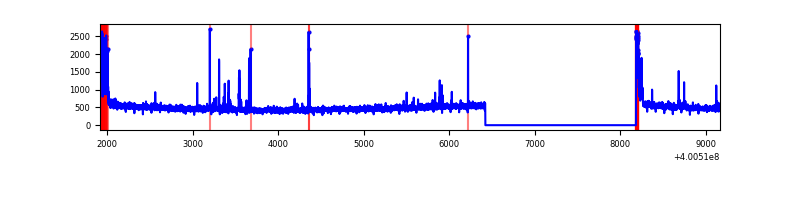 |
| D | 7254 | 5492 | 171 | 171 | 2.36% | 3.11% | 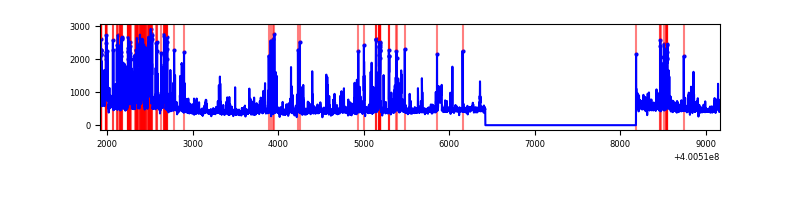 |
Top three noisy pixels from each quadrant. If the there are fewer than three noisy pixels in the level2.evt file, extra rows are filled as -1
| Pixel properties | Quadrant properties | ||||||
|---|---|---|---|---|---|---|---|
| Quadrant | DetID | PixID | Counts | Sigma | Mean | Median | Sigma |
| A | 10 | 83 | 350127 | 2701.88 | 634 | 623 | 129.4 |
| A | 15 | 250 | 57064 | 436.32 | 634 | 623 | 129.4 |
| A | 9 | 143 | 38933 | 296.16 | 634 | 623 | 129.4 |
| B | 5 | 255 | 1553738 | 13569.43 | 602 | 588 | 114.5 |
| B | 5 | 172 | 334306 | 2915.6 | 602 | 588 | 114.5 |
| B | 5 | 200 | 203880 | 1776.1 | 602 | 588 | 114.5 |
| C | 15 | 214 | 234982 | 1668.61 | 603 | 608 | 140.5 |
| C | 0 | 10 | 211776 | 1503.4 | 603 | 608 | 140.5 |
| C | 14 | 254 | 49876 | 350.76 | 603 | 608 | 140.5 |
| D | 2 | 249 | 547261 | 3722.44 | 605 | 590 | 146.9 |
| D | 10 | 253 | 188544 | 1279.83 | 605 | 590 | 146.9 |
| D | 12 | 233 | 124139 | 841.28 | 605 | 590 | 146.9 |
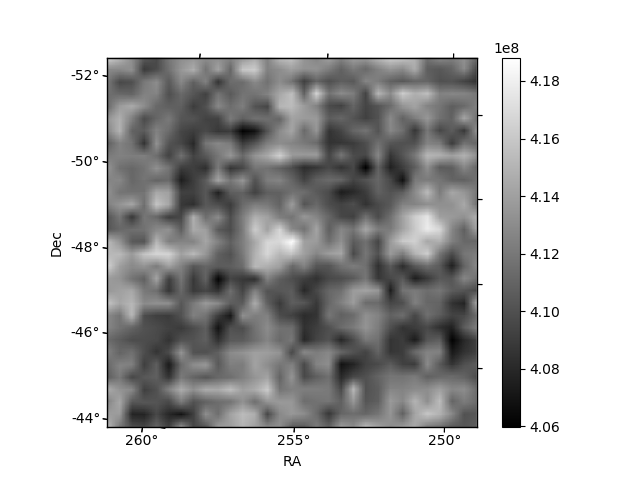
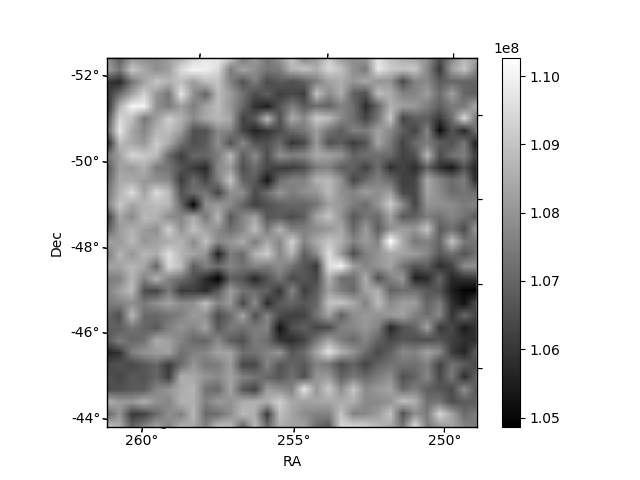
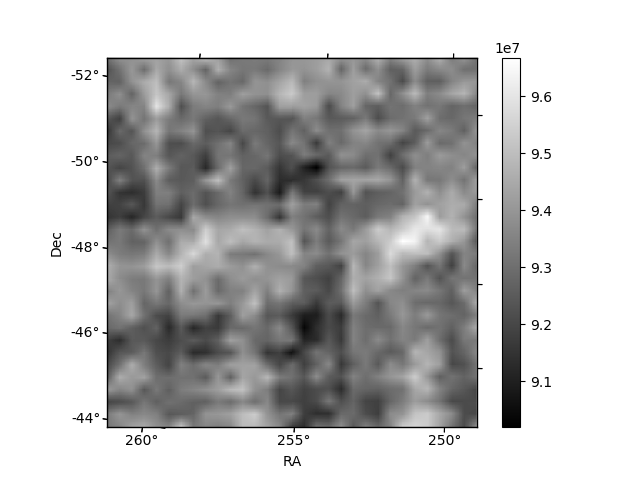
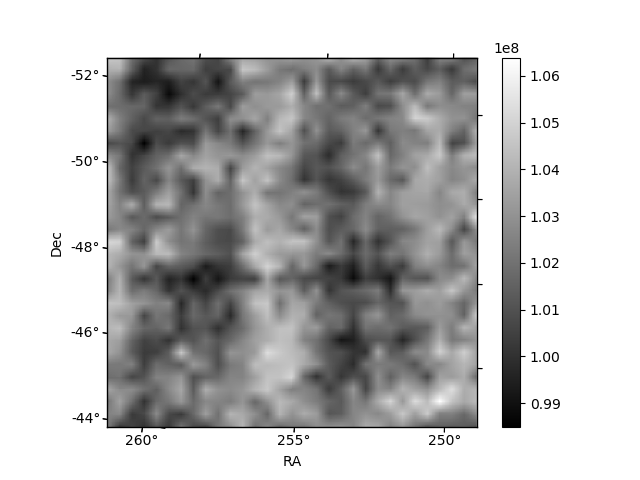
Histogram calculated using DETX and DETY for each event in the final _common_clean file
| Quadrant A | 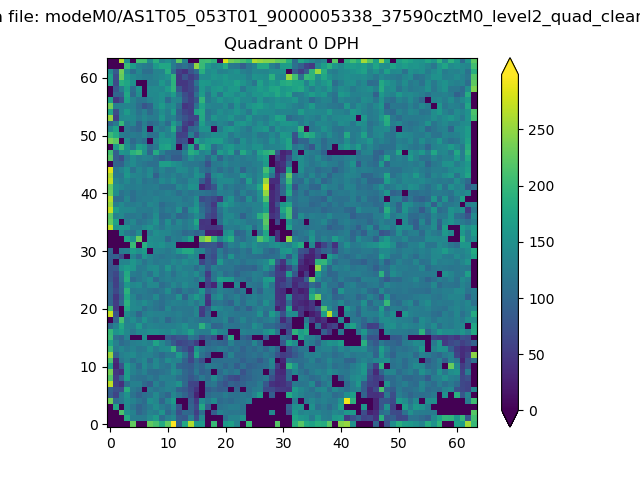 |
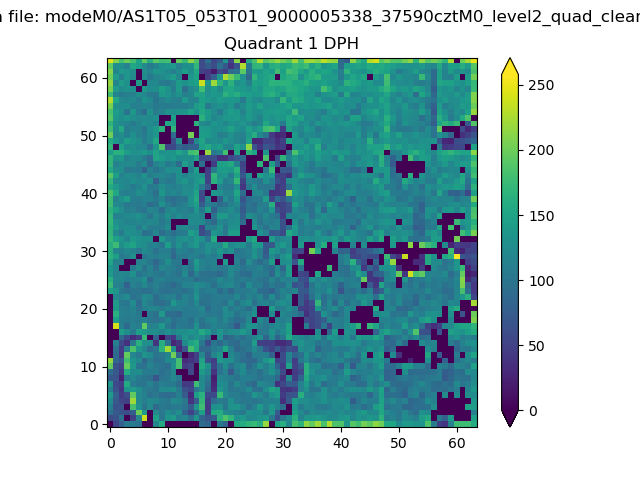 |
Quadrant B |
|---|---|---|---|
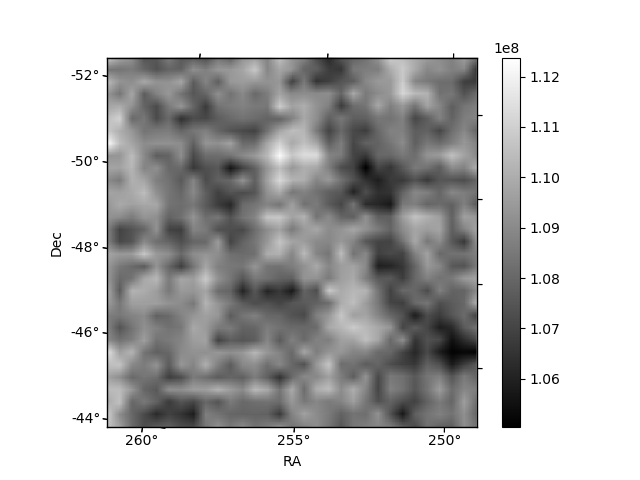
| Quadrant D | 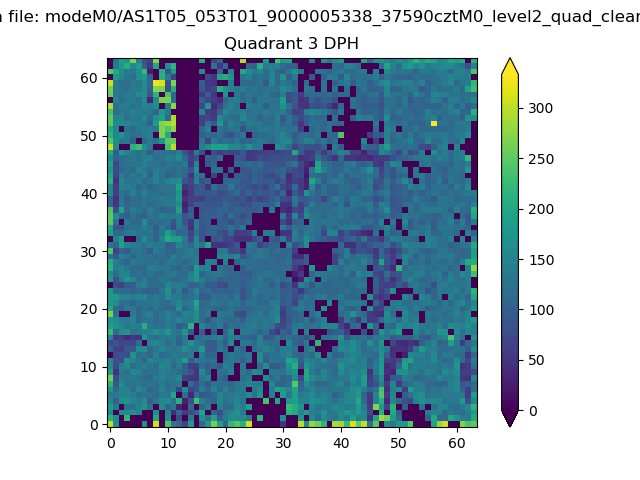 |
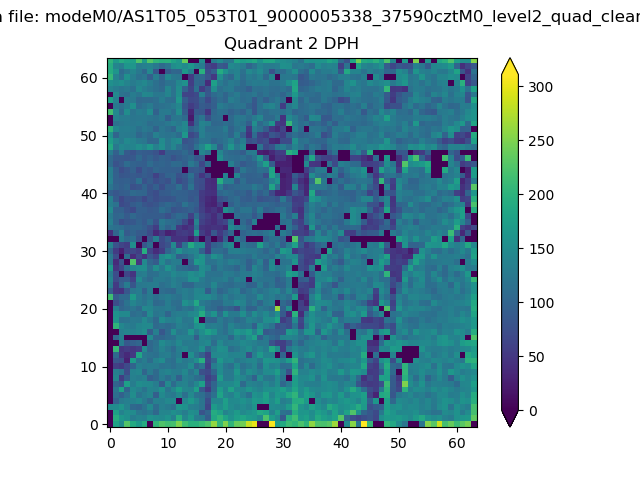 |
Quadrant C |
| Plot type | Count rate plots | Images |
|---|---|---|
| Comparison with Poisson distribution Blue bars denote a histogram of data divided into 1 sec bins. Red curve is a Poisson curve with rate = median count rate of data. |
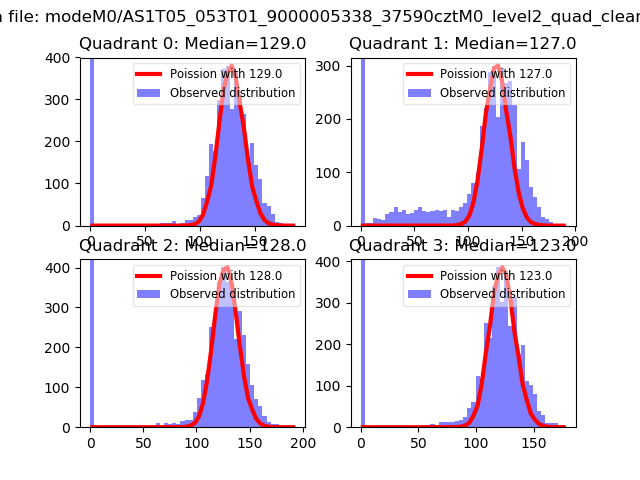 |
 |
| Quadrant-wise count rates Data is divided into 100 sec bins |
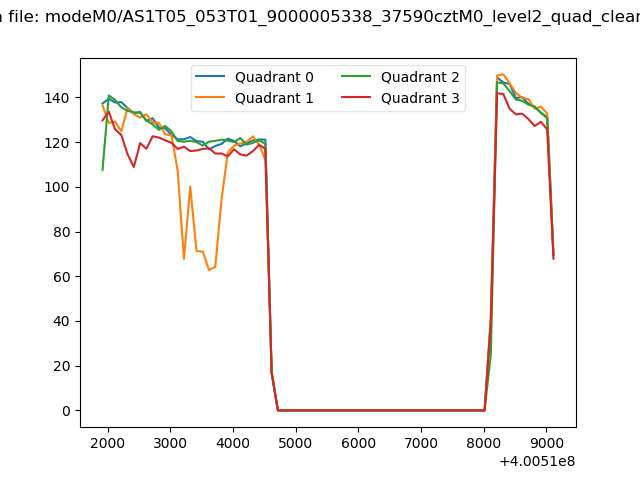 |
|
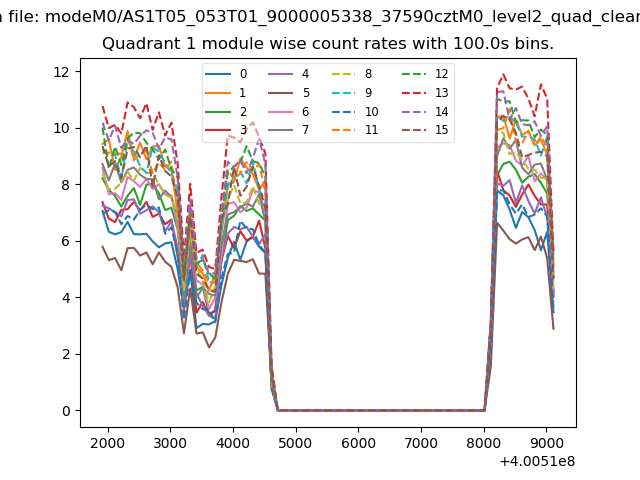
| Module-wise count rates for Quadrant A Data is divided into 100 sec bins |
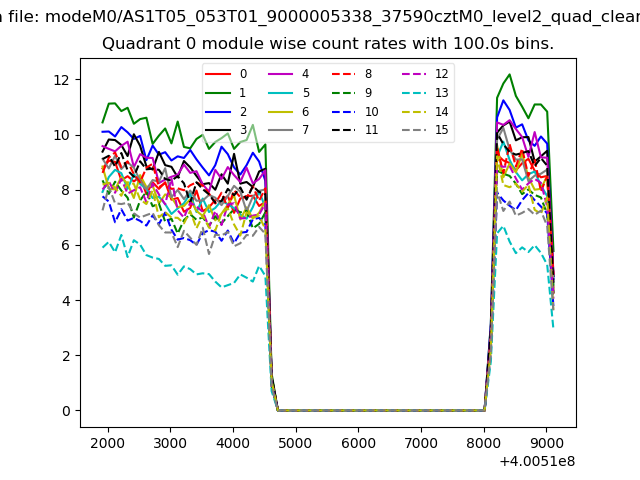 |
 |
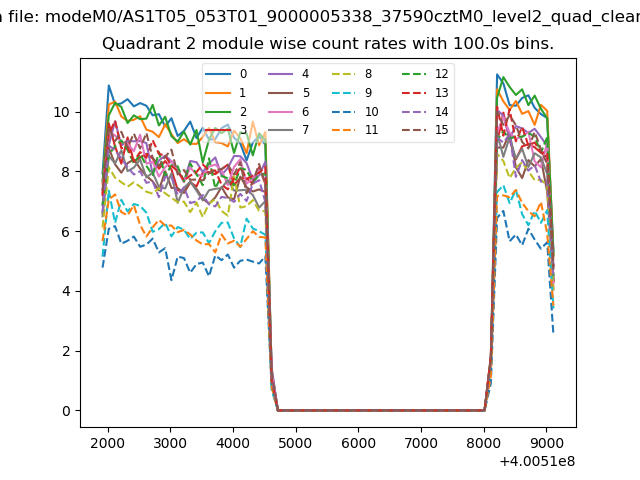
| Module-wise count rates for Quadrant B Data is divided into 100 sec bins |
 |
 |
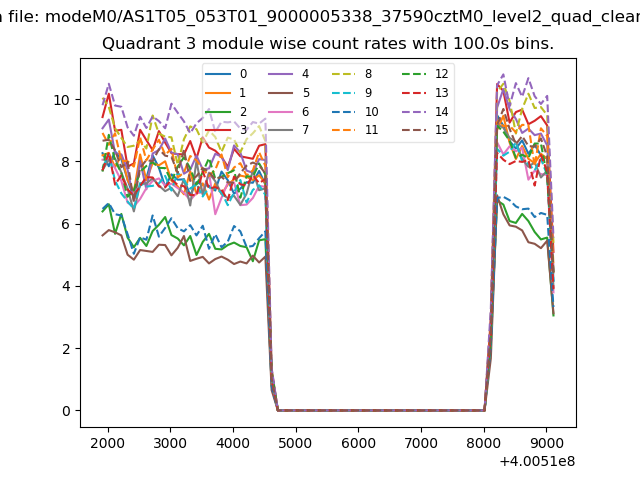
| Module-wise count rates for Quadrant C Data is divided into 100 sec bins |
 |
 |
| Module-wise count rates for Quadrant D Data is divided into 100 sec bins |
 |
 |
| Parameter | Plot |
|---|---|
| CZT HV Monitor | 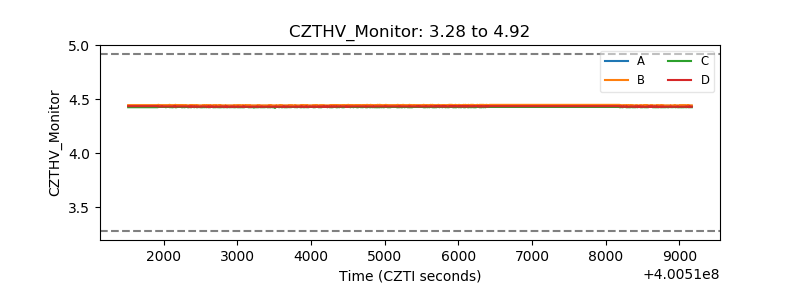 |
| D_VDD | 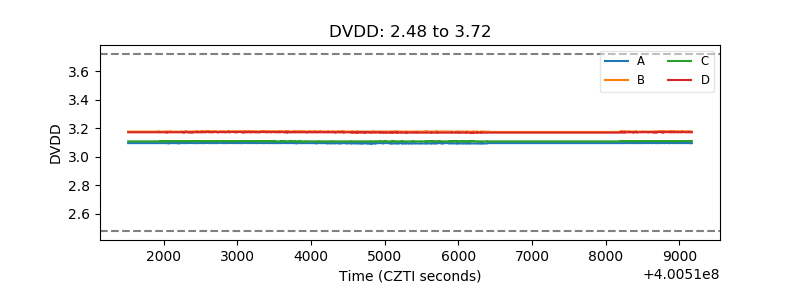 |
| Temperature 1 | 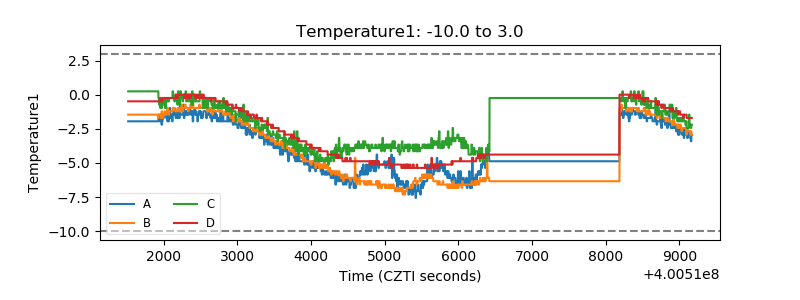 |
| Veto HV Monitor | 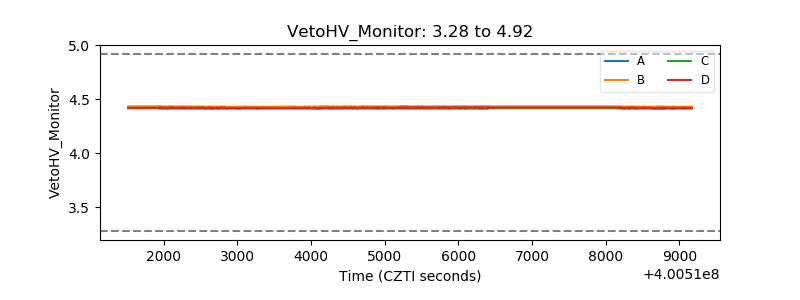 |
| Veto LLD | 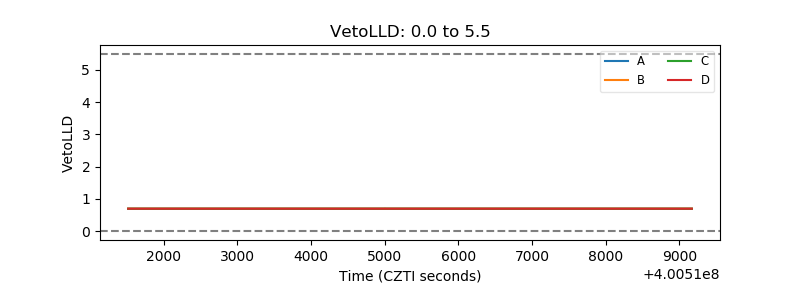 |
| Alpha Counter | 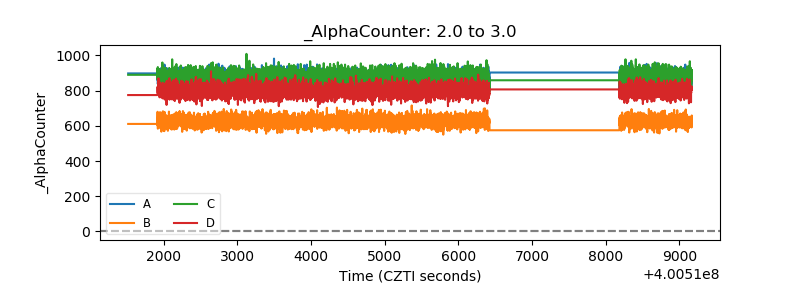 |
| _CPM_Rate | 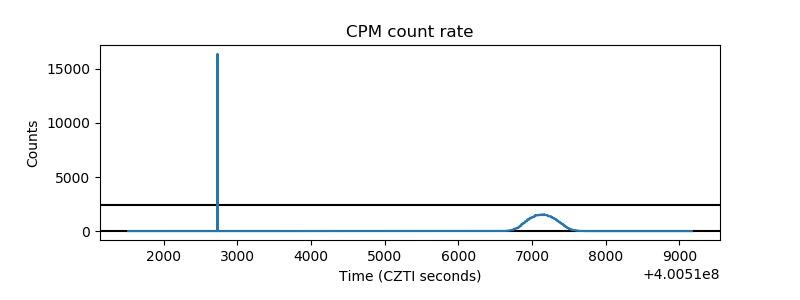 |
| CZT Counter | 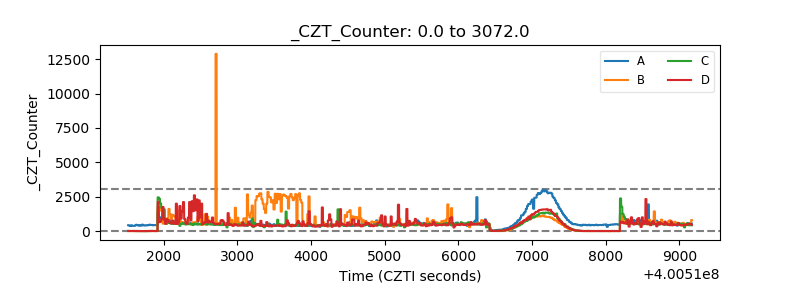 |
| +2.5 Volts monitor | 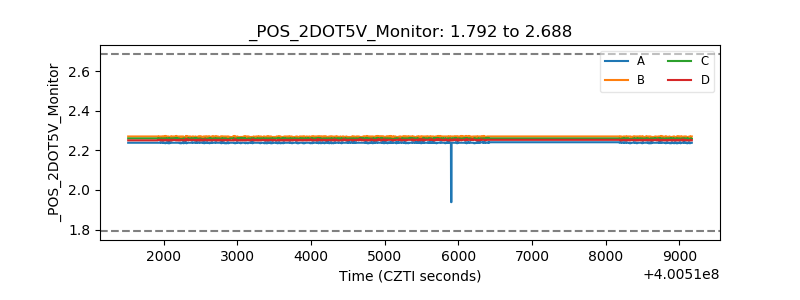 |
| +5 Volts monitor | 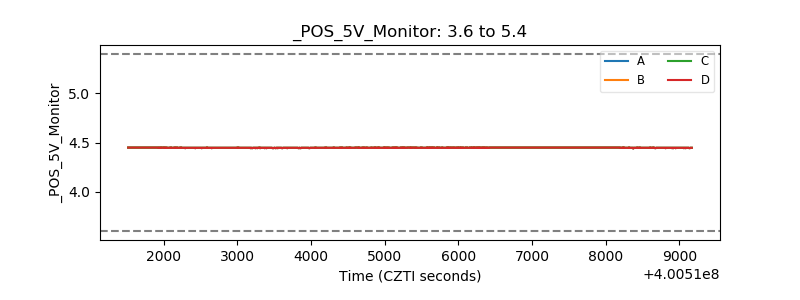 |
| _ROLL_ROT | 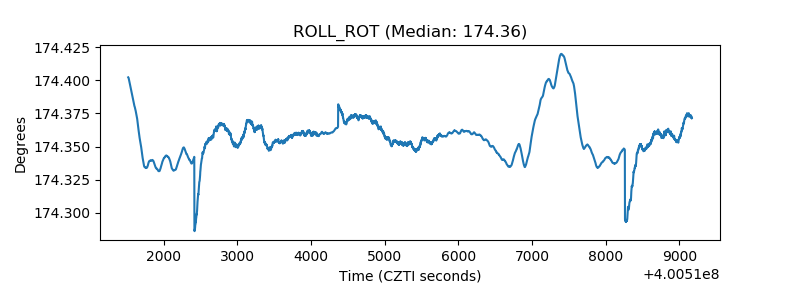 |
| _Roll_DEC | 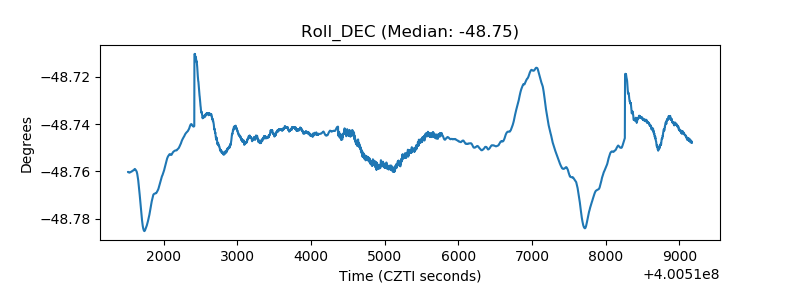 |
| _Roll_RA | 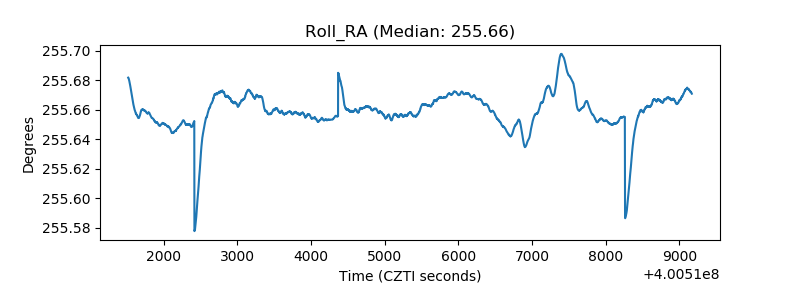 |
| Veto Counter | 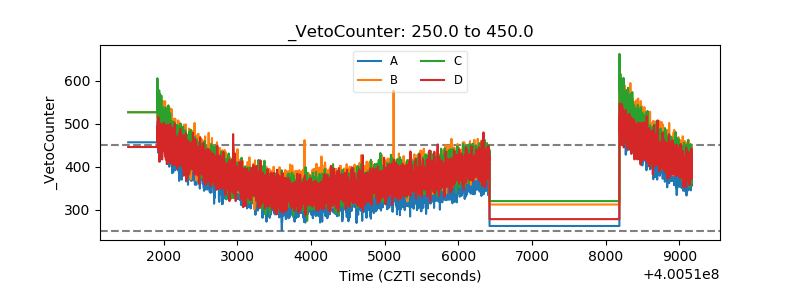 |