| Param | Original file | Final file |
|---|---|---|
| Filename | modeM0/AS1T05_053T01_9000005338_37591cztM0_level2.evt | modeM0/AS1T05_053T01_9000005338_37591cztM0_level2_quad_clean.evt |
| Size (bytes) | 411,589,440 | 67,907,520 |
| Size | 392.5 MB | 64.8 MB |
| Events in quadrant A | 2,919,506 | 432,594 |
| Events in quadrant B | 3,414,355 | 426,772 |
| Events in quadrant C | 2,729,618 | 424,953 |
| Events in quadrant D | 3,047,944 | 407,171 |
| Mode SS | |||
|---|---|---|---|
| Quadrant | BADHDUFLAG | Total packets | Discarded packets |
| A | 0 | 106 | 0 |
| B | 0 | 106 | 0 |
| C | 0 | 106 | 0 |
| D | 0 | 106 | 0 |
| Mode M0 | |||
|---|---|---|---|
| Quadrant | BADHDUFLAG | Total packets | Discarded packets |
| A | 0 | 11907 | 3 |
| B | 0 | 13492 | 2 |
| C | 0 | 11255 | 2 |
| D | 0 | 12572 | 2 |
| Mode M9 | |||
|---|---|---|---|
| Quadrant | BADHDUFLAG | Total packets | Discarded packets |
| A | 0 | 26 | 0 |
| B | 0 | 26 | 0 |
| C | 0 | 26 | 0 |
| D | 0 | 27 | 0 |
| Quadrant | Total seconds | Saturated seconds | Saturation percentage |
|---|---|---|---|
| A | 5204 | 36 | 0.691776% |
| B | 5204 | 213 | 4.093005% |
| C | 5204 | 51 | 0.980015% |
| D | 5204 | 60 | 1.152959% |
Noise dominated data is calculated using 1-second bins in cleaned event files. If a bin has >2000 counts, and if more than 50% of those come from <1% of pixels, then it is considered to be noise-dominated and hence unusable.
| Quadrant | # 1 sec bins | Bins with >0 counts | Bins with >2000 counts | High rate bins dominated by noise | Noise dominated (total time) | Noise dominated (detector-on time) | Marked lightcurve |
|---|---|---|---|---|---|---|---|
| A | 7089 | 5205 | 31 | 31 | 0.44% | 0.60% | 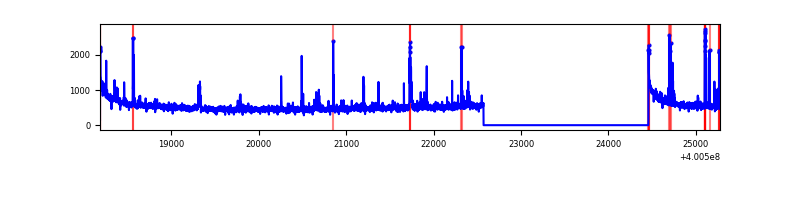 |
| B | 7089 | 5205 | 170 | 170 | 2.40% | 3.27% | 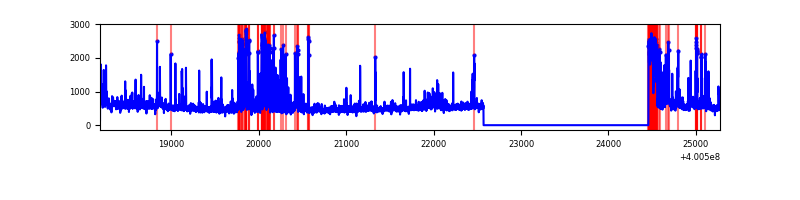 |
| C | 7089 | 5205 | 48 | 48 | 0.68% | 0.92% | 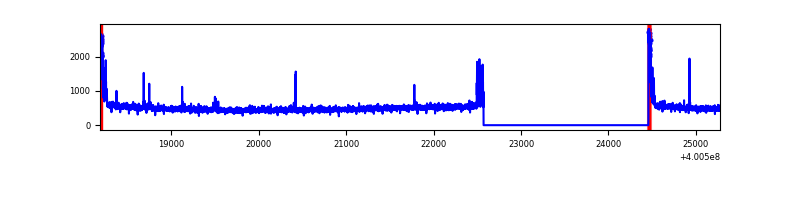 |
| D | 7089 | 5205 | 75 | 75 | 1.06% | 1.44% | 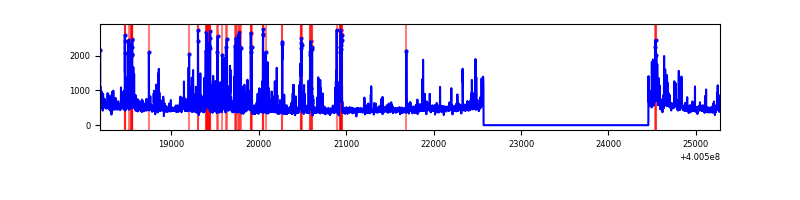 |
Top three noisy pixels from each quadrant. If the there are fewer than three noisy pixels in the level2.evt file, extra rows are filled as -1
| Pixel properties | Quadrant properties | ||||||
|---|---|---|---|---|---|---|---|
| Quadrant | DetID | PixID | Counts | Sigma | Mean | Median | Sigma |
| A | 10 | 83 | 335691 | 2755.58 | 607 | 596 | 121.6 |
| A | 9 | 143 | 126048 | 1031.63 | 607 | 596 | 121.6 |
| A | 15 | 222 | 45109 | 366.04 | 607 | 596 | 121.6 |
| B | 5 | 172 | 333485 | 2904.84 | 599 | 585 | 114.6 |
| B | 5 | 255 | 241094 | 2098.65 | 599 | 585 | 114.6 |
| B | 0 | 213 | 98169 | 851.5 | 599 | 585 | 114.6 |
| C | 15 | 214 | 224424 | 1653.16 | 580 | 585 | 135.4 |
| C | 0 | 10 | 156784 | 1153.61 | 580 | 585 | 135.4 |
| C | 14 | 254 | 67963 | 497.62 | 580 | 585 | 135.4 |
| D | 2 | 249 | 263496 | 1870.57 | 579 | 563 | 140.6 |
| D | 12 | 233 | 160746 | 1139.58 | 579 | 563 | 140.6 |
| D | 2 | 153 | 130884 | 927.13 | 579 | 563 | 140.6 |
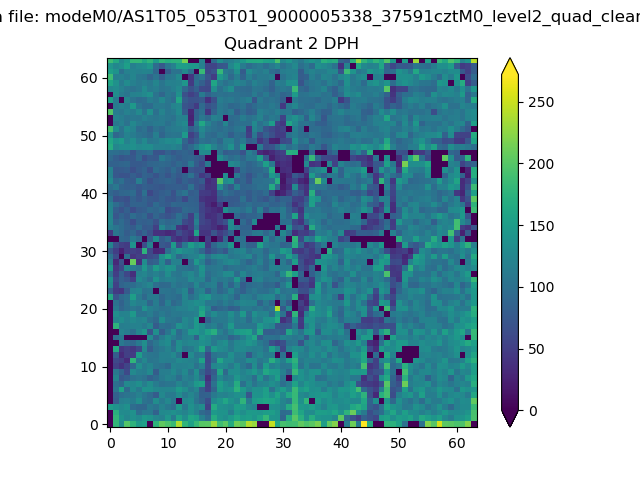
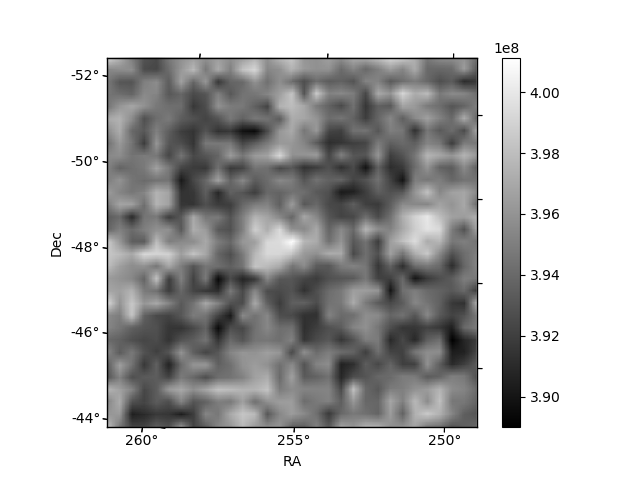
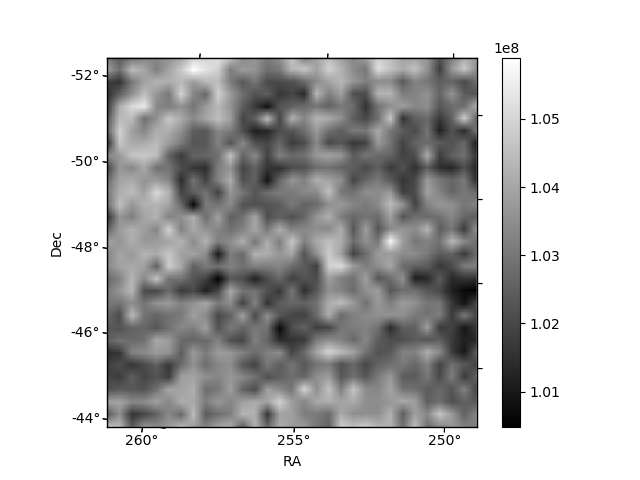
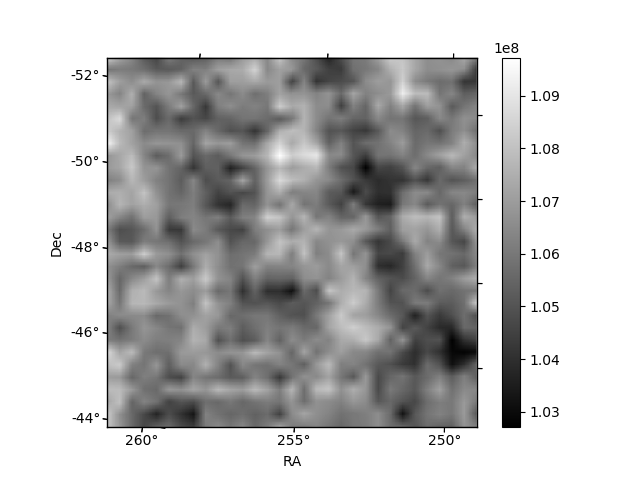
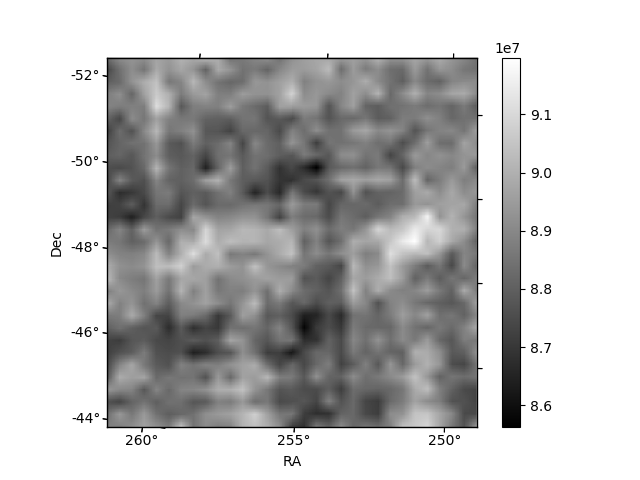
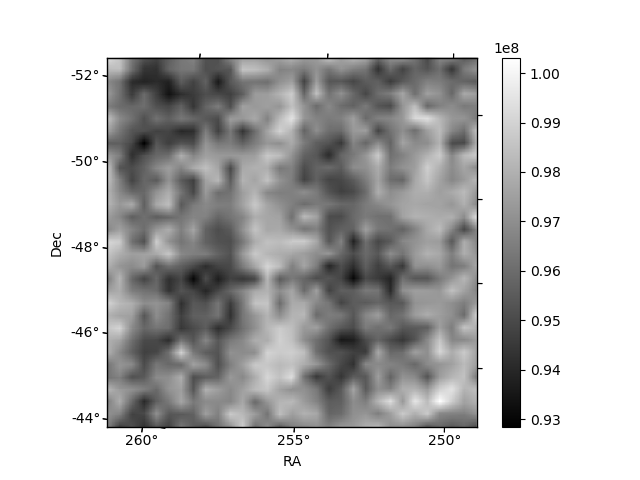
Histogram calculated using DETX and DETY for each event in the final _common_clean file
| Quadrant A | 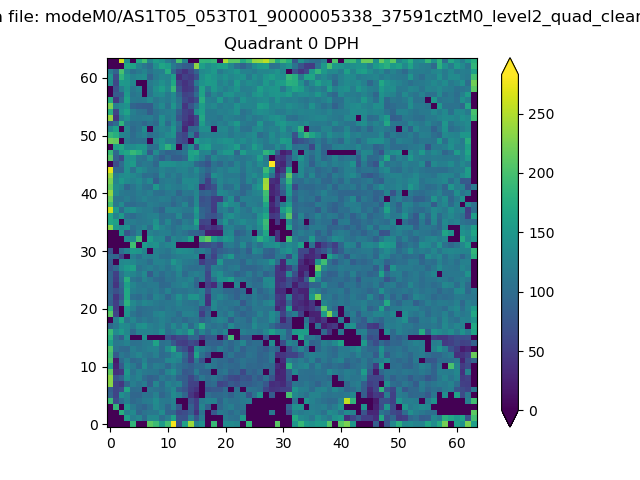 |
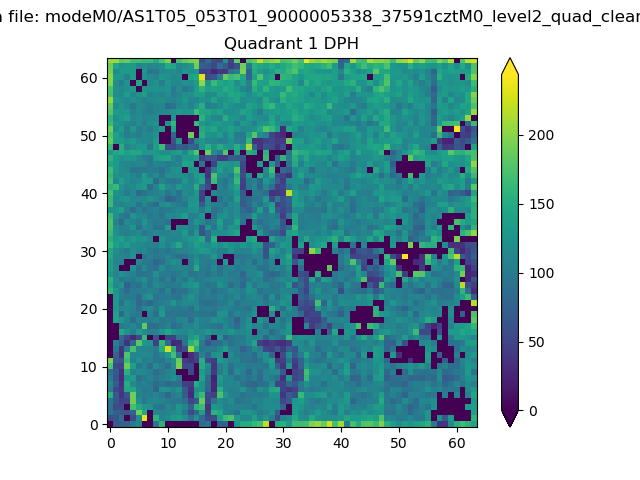 |
Quadrant B |
|---|---|---|---|
| Quadrant D | 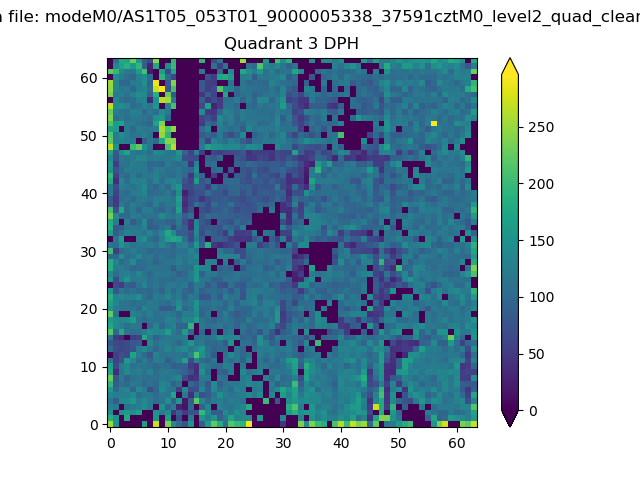 |
 |
Quadrant C |
| Plot type | Count rate plots | Images |
|---|---|---|
| Comparison with Poisson distribution Blue bars denote a histogram of data divided into 1 sec bins. Red curve is a Poisson curve with rate = median count rate of data. |
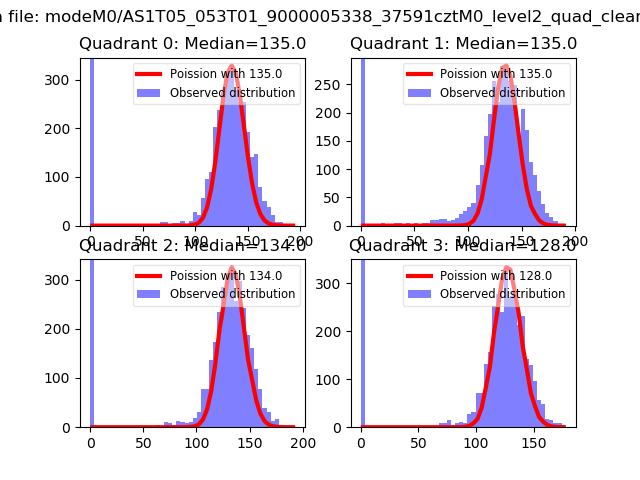 |
 |
| Quadrant-wise count rates Data is divided into 100 sec bins |
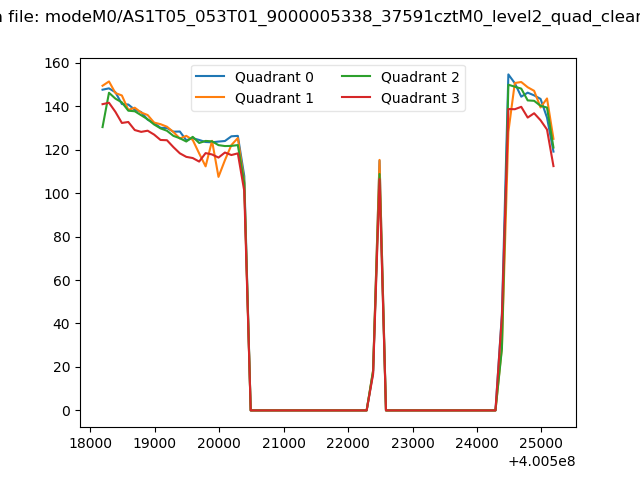 |
|
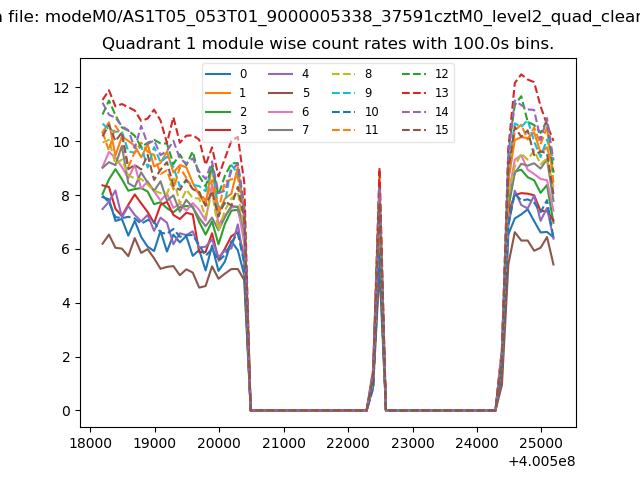
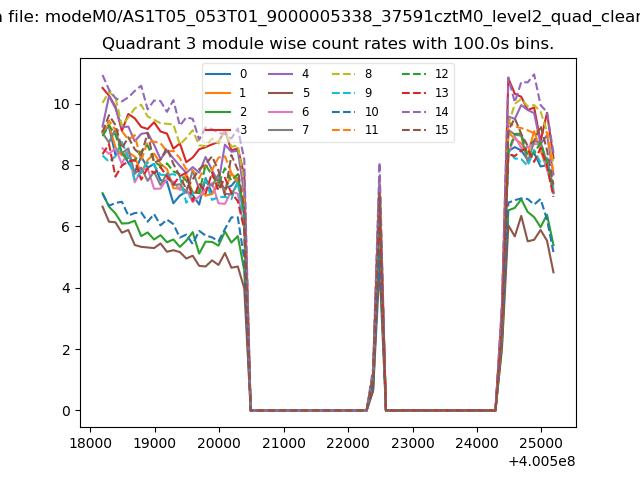
| Module-wise count rates for Quadrant A Data is divided into 100 sec bins |
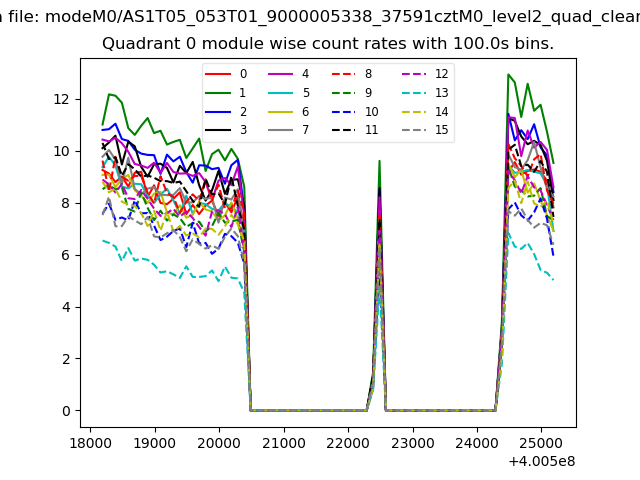 |
 |
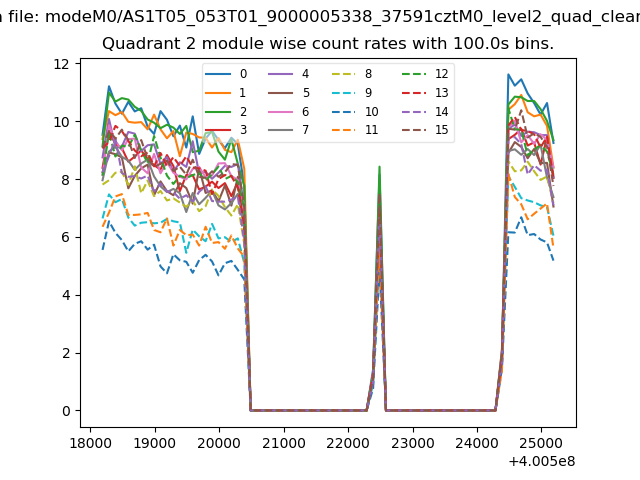
| Module-wise count rates for Quadrant B Data is divided into 100 sec bins |
 |
 |
| Module-wise count rates for Quadrant C Data is divided into 100 sec bins |
 |
 |
| Module-wise count rates for Quadrant D Data is divided into 100 sec bins |
 |
 |
| Parameter | Plot |
|---|---|
| CZT HV Monitor | 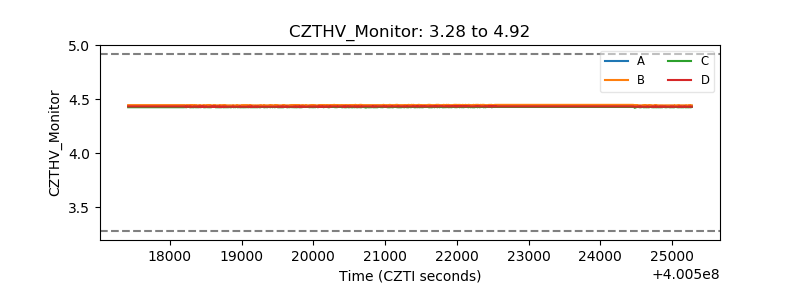 |
| D_VDD | 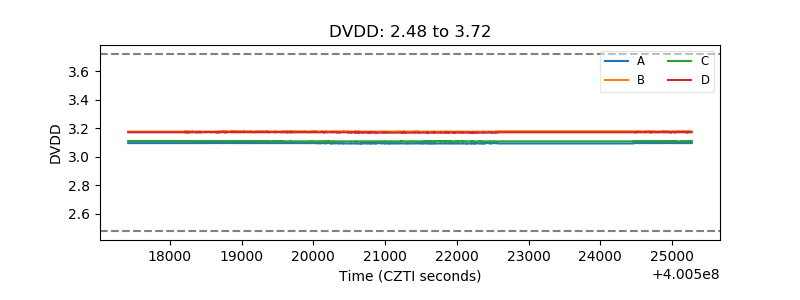 |
| Temperature 1 | 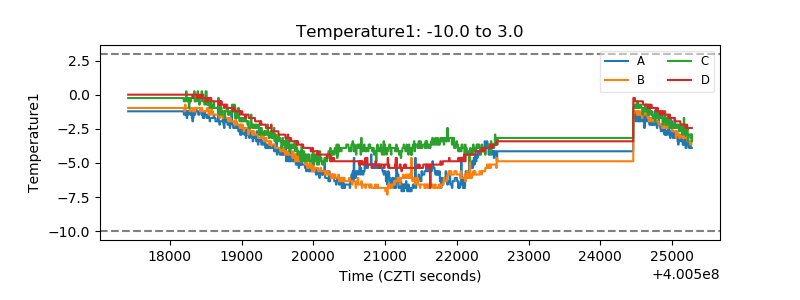 |
| Veto HV Monitor | 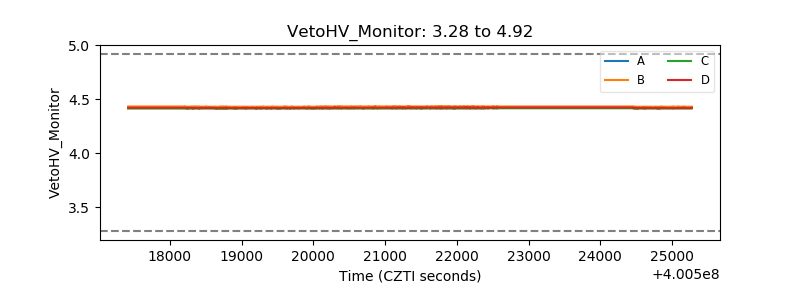 |
| Veto LLD | 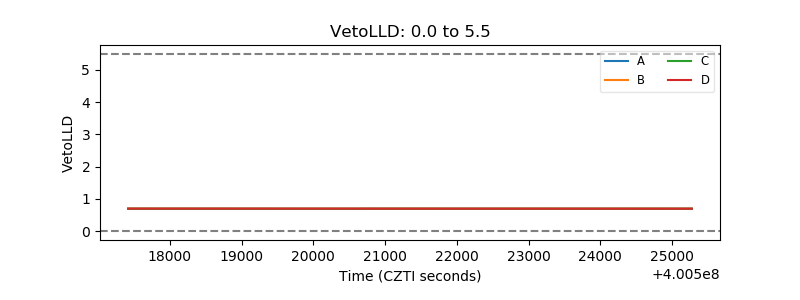 |
| Alpha Counter | 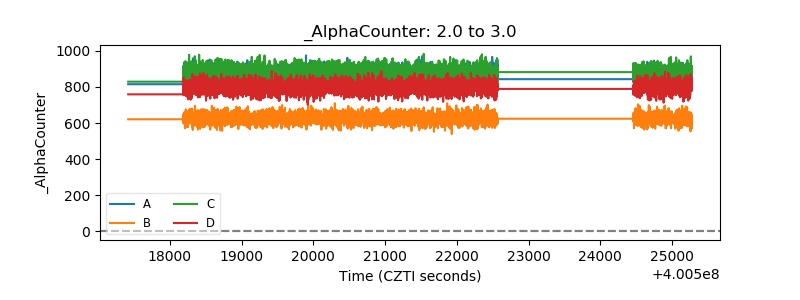 |
| _CPM_Rate | 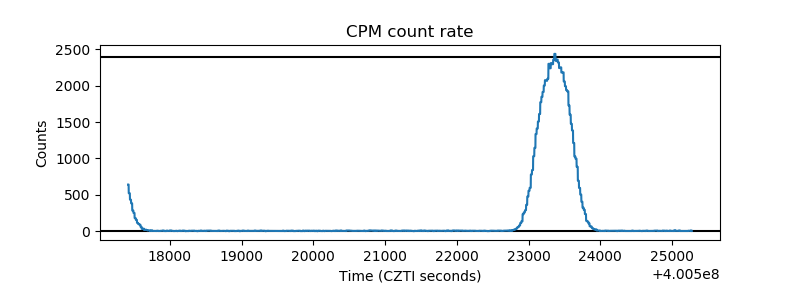 |
| CZT Counter | 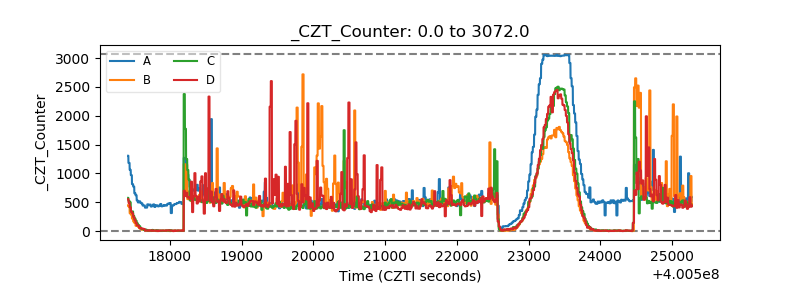 |
| +2.5 Volts monitor | 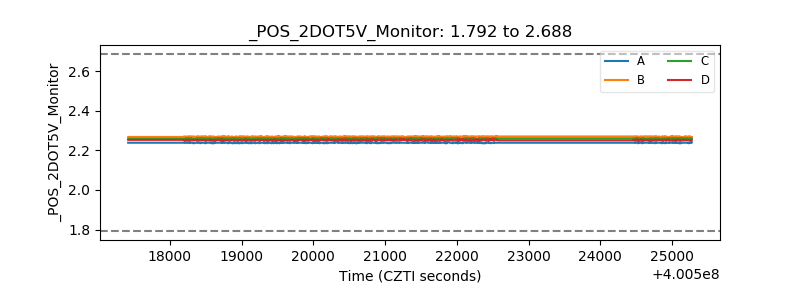 |
| +5 Volts monitor | 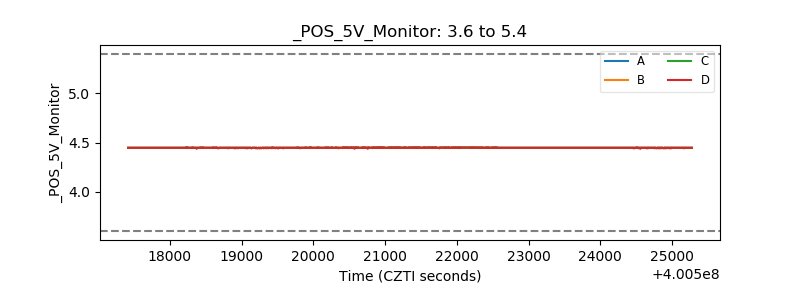 |
| _ROLL_ROT | 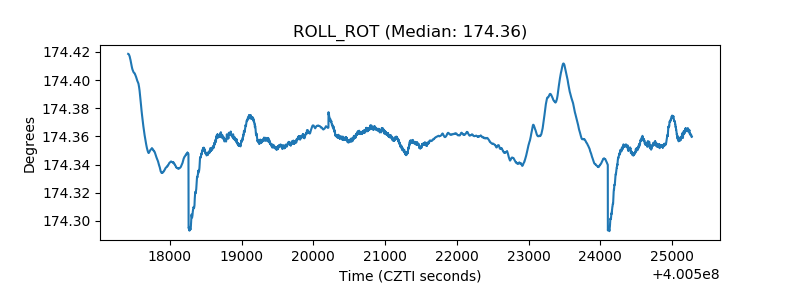 |
| _Roll_DEC | 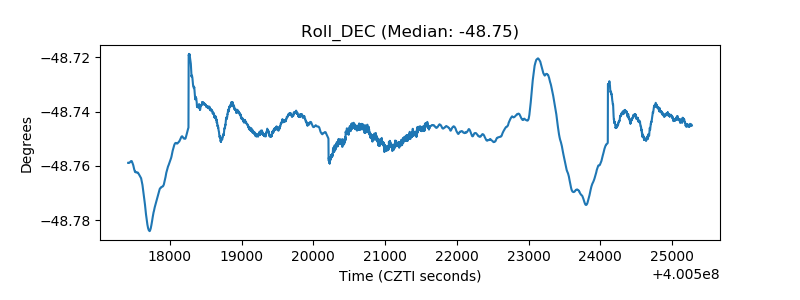 |
| _Roll_RA | 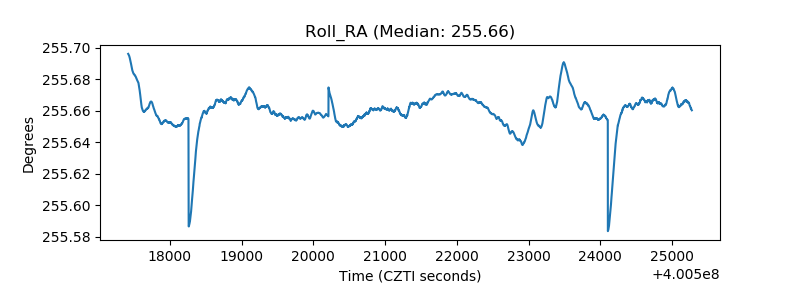 |
| Veto Counter | 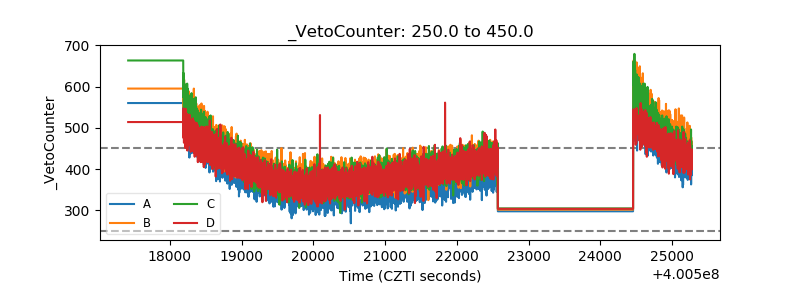 |