| Param | Original file | Final file |
|---|---|---|
| Filename | modeM0/AS1T05_053T01_9000005338_37592cztM0_level2.evt | modeM0/AS1T05_053T01_9000005338_37592cztM0_level2_quad_clean.evt |
| Size (bytes) | 414,809,280 | 66,398,400 |
| Size | 395.6 MB | 63.3 MB |
| Events in quadrant A | 2,861,417 | 424,461 |
| Events in quadrant B | 3,401,827 | 422,626 |
| Events in quadrant C | 2,707,879 | 417,620 |
| Events in quadrant D | 3,248,616 | 392,060 |
| Mode SS | |||
|---|---|---|---|
| Quadrant | BADHDUFLAG | Total packets | Discarded packets |
| A | 0 | 102 | 0 |
| B | 0 | 102 | 0 |
| C | 0 | 102 | 0 |
| D | 0 | 102 | 0 |
| Mode M0 | |||
|---|---|---|---|
| Quadrant | BADHDUFLAG | Total packets | Discarded packets |
| A | 0 | 11536 | 3 |
| B | 0 | 13286 | 2 |
| C | 0 | 11000 | 2 |
| D | 0 | 13081 | 2 |
| Mode M9 | |||
|---|---|---|---|
| Quadrant | BADHDUFLAG | Total packets | Discarded packets |
| A | 0 | 28 | 0 |
| B | 0 | 28 | 0 |
| C | 0 | 28 | 0 |
| D | 0 | 29 | 0 |
| Quadrant | Total seconds | Saturated seconds | Saturation percentage |
|---|---|---|---|
| A | 5046 | 32 | 0.634166% |
| B | 5046 | 256 | 5.073325% |
| C | 5046 | 74 | 1.466508% |
| D | 5046 | 241 | 4.776060% |
Noise dominated data is calculated using 1-second bins in cleaned event files. If a bin has >2000 counts, and if more than 50% of those come from <1% of pixels, then it is considered to be noise-dominated and hence unusable.
| Quadrant | # 1 sec bins | Bins with >0 counts | Bins with >2000 counts | High rate bins dominated by noise | Noise dominated (total time) | Noise dominated (detector-on time) | Marked lightcurve |
|---|---|---|---|---|---|---|---|
| A | 7048 | 5047 | 32 | 32 | 0.45% | 0.63% | 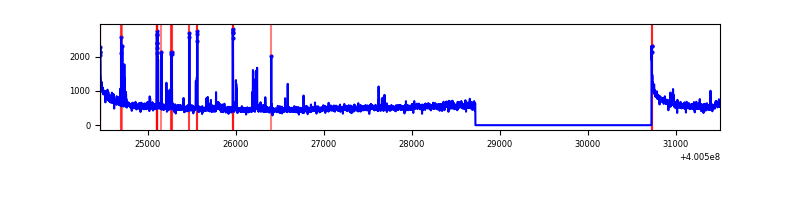 |
| B | 7048 | 5047 | 231 | 231 | 3.28% | 4.58% | 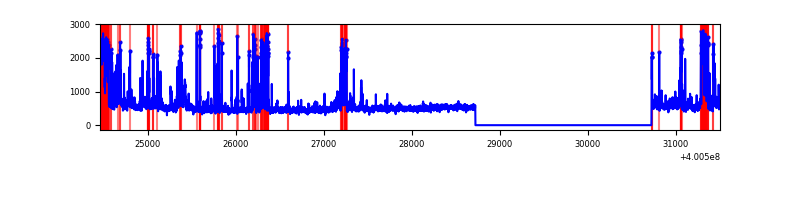 |
| C | 7048 | 5047 | 78 | 78 | 1.11% | 1.55% | 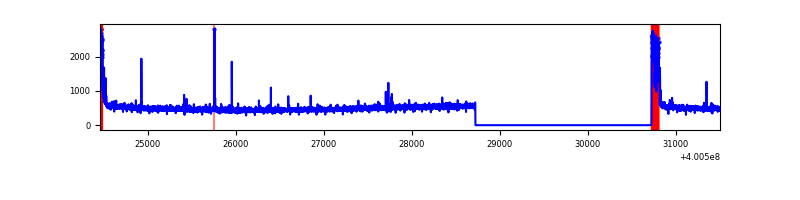 |
| D | 7048 | 5047 | 248 | 248 | 3.52% | 4.91% | 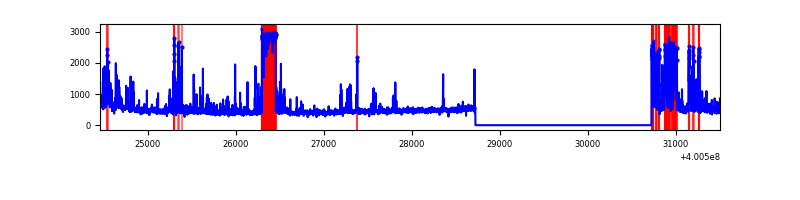 |
Top three noisy pixels from each quadrant. If the there are fewer than three noisy pixels in the level2.evt file, extra rows are filled as -1
| Pixel properties | Quadrant properties | ||||||
|---|---|---|---|---|---|---|---|
| Quadrant | DetID | PixID | Counts | Sigma | Mean | Median | Sigma |
| A | 10 | 83 | 323715 | 2676.74 | 595 | 584 | 120.7 |
| A | 15 | 222 | 115415 | 951.23 | 595 | 584 | 120.7 |
| A | 9 | 143 | 77672 | 638.58 | 595 | 584 | 120.7 |
| B | 5 | 172 | 492939 | 4421.53 | 588 | 575 | 111.4 |
| B | 5 | 255 | 275350 | 2467.54 | 588 | 575 | 111.4 |
| B | 0 | 189 | 80485 | 717.61 | 588 | 575 | 111.4 |
| C | 0 | 10 | 230119 | 1719.04 | 570 | 572 | 133.5 |
| C | 15 | 214 | 217674 | 1625.84 | 570 | 572 | 133.5 |
| C | 14 | 254 | 16646 | 120.38 | 570 | 572 | 133.5 |
| D | 1 | 52 | 419866 | 3114.12 | 553 | 537 | 134.7 |
| D | 12 | 233 | 297903 | 2208.37 | 553 | 537 | 134.7 |
| D | 2 | 249 | 129941 | 961.01 | 553 | 537 | 134.7 |
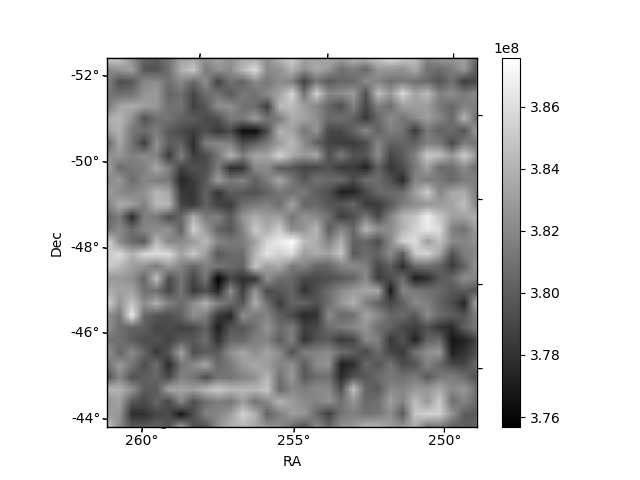
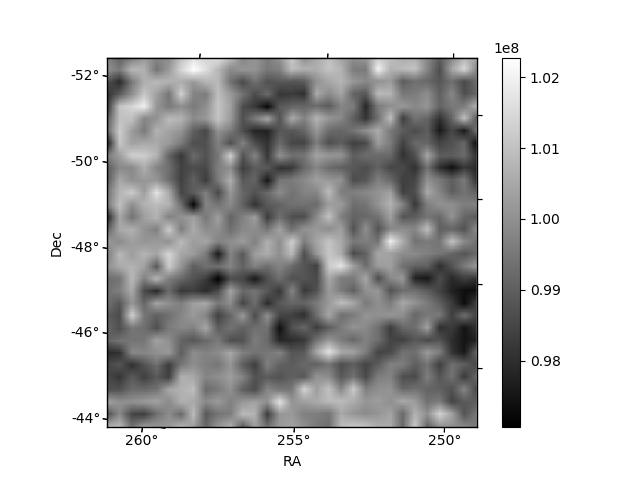
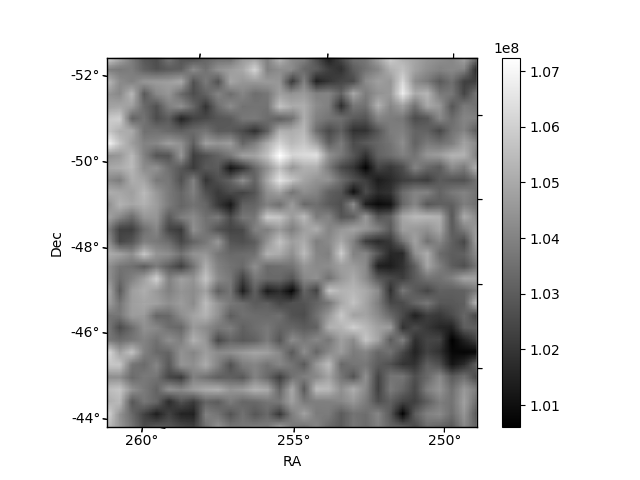
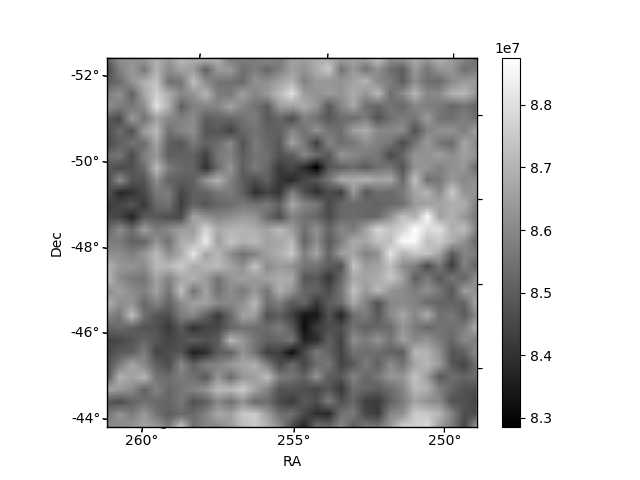
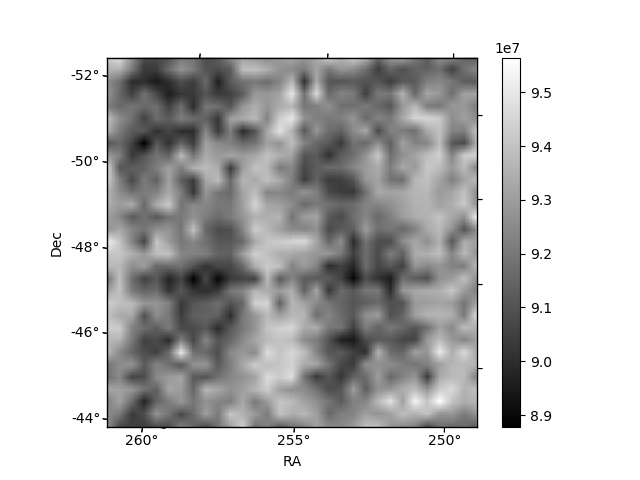
Histogram calculated using DETX and DETY for each event in the final _common_clean file
| Quadrant A | 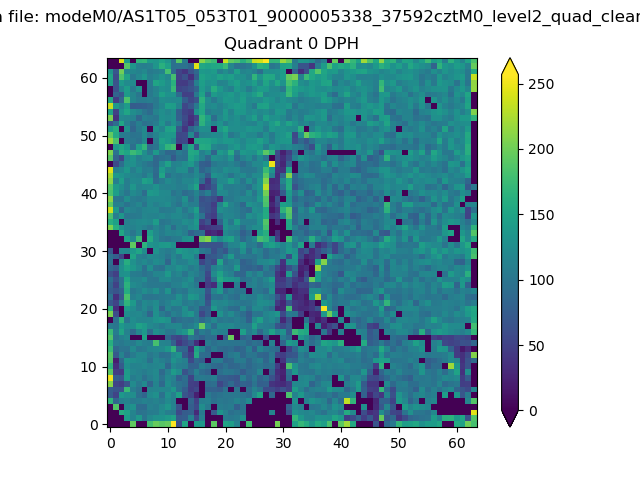 |
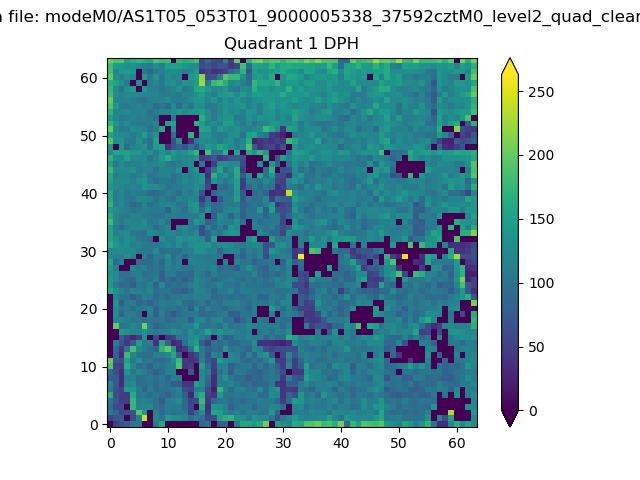 |
Quadrant B |
|---|---|---|---|
| Quadrant D | 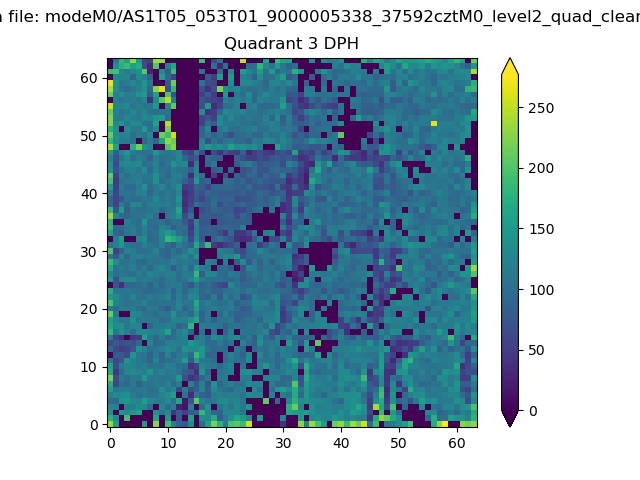 |
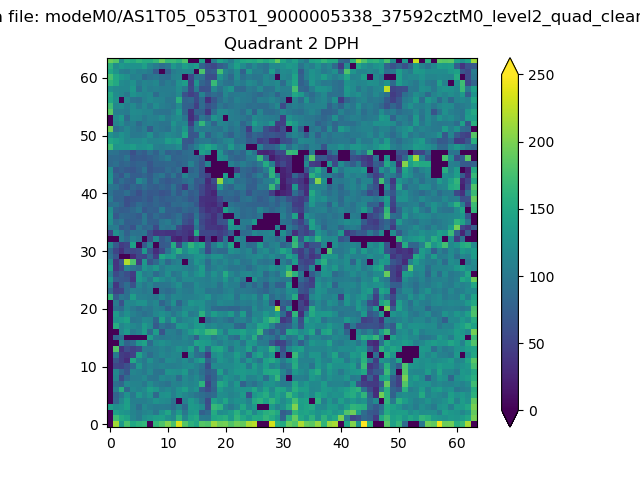 |
Quadrant C |
| Plot type | Count rate plots | Images |
|---|---|---|
| Comparison with Poisson distribution Blue bars denote a histogram of data divided into 1 sec bins. Red curve is a Poisson curve with rate = median count rate of data. |
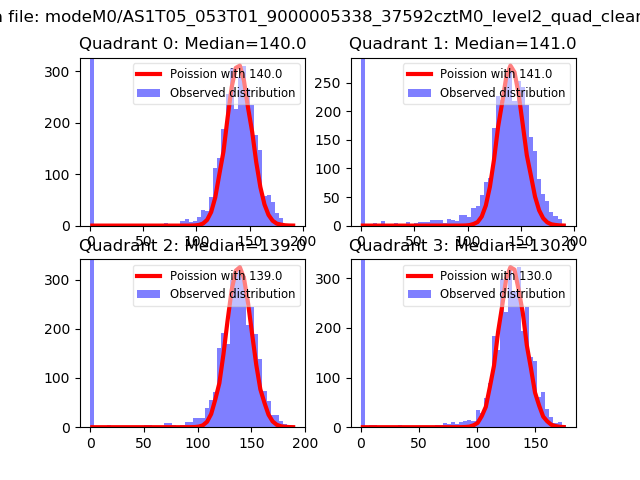 |
 |
| Quadrant-wise count rates Data is divided into 100 sec bins |
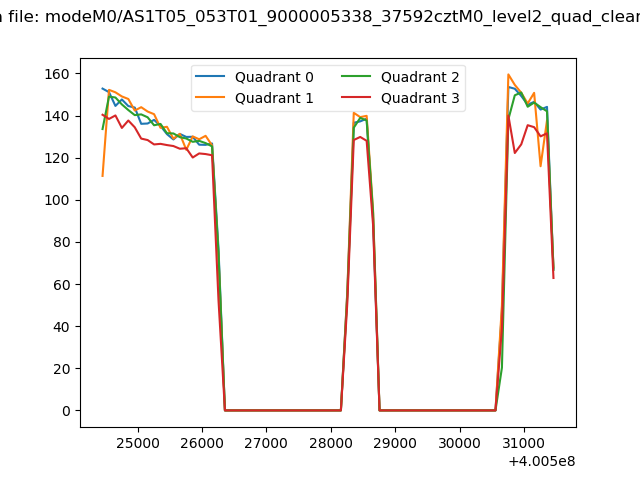 |
|
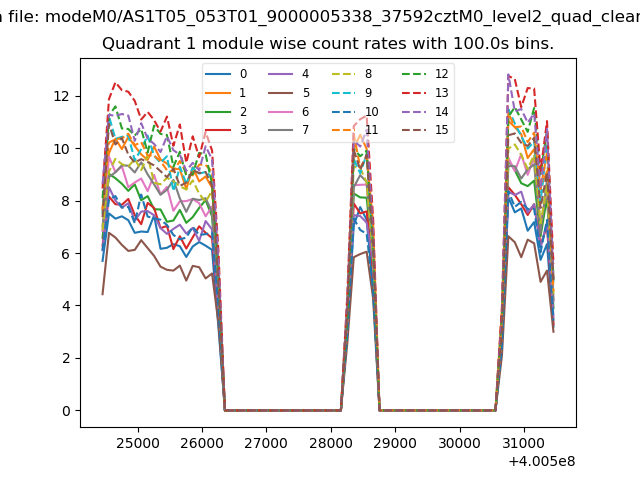
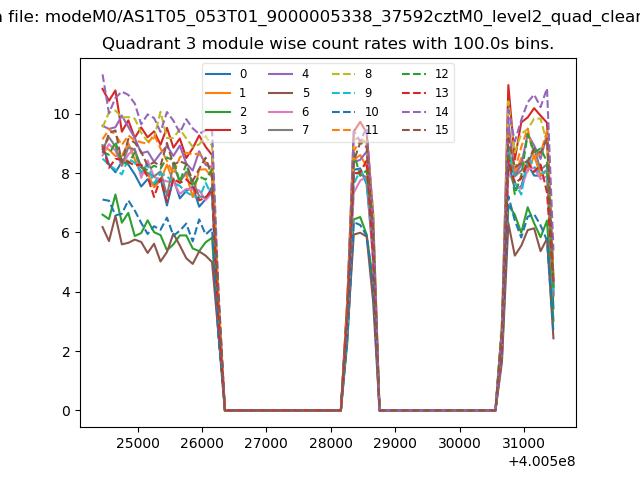
| Module-wise count rates for Quadrant A Data is divided into 100 sec bins |
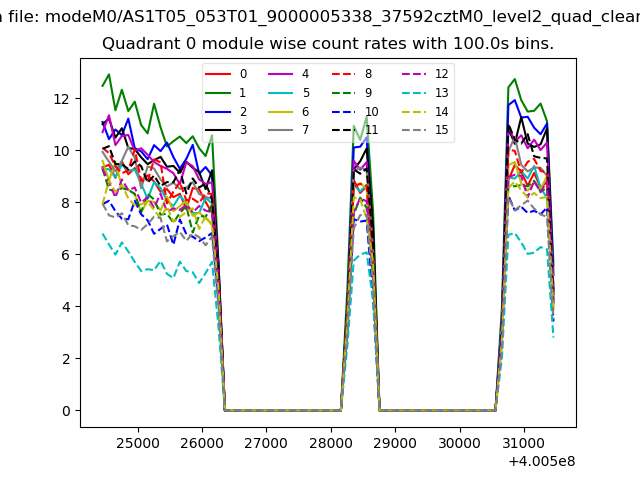 |
 |
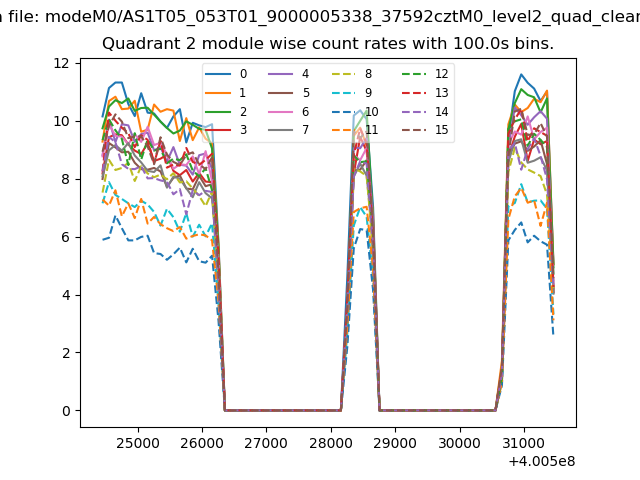
| Module-wise count rates for Quadrant B Data is divided into 100 sec bins |
 |
 |
| Module-wise count rates for Quadrant C Data is divided into 100 sec bins |
 |
 |
| Module-wise count rates for Quadrant D Data is divided into 100 sec bins |
 |
 |
| Parameter | Plot |
|---|---|
| CZT HV Monitor | 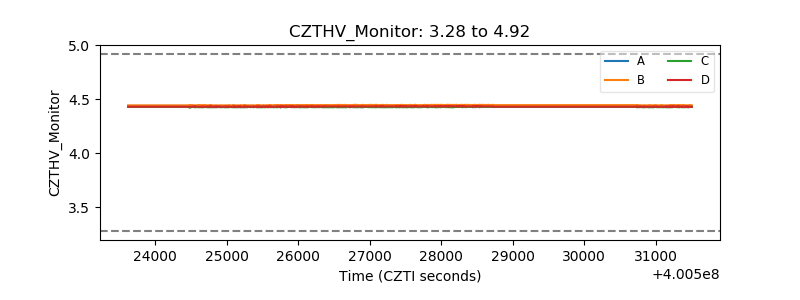 |
| D_VDD | 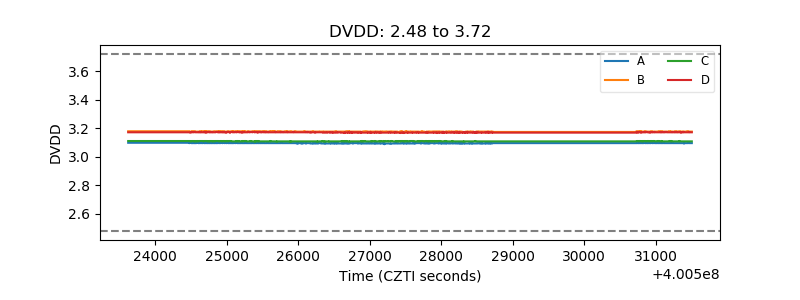 |
| Temperature 1 | 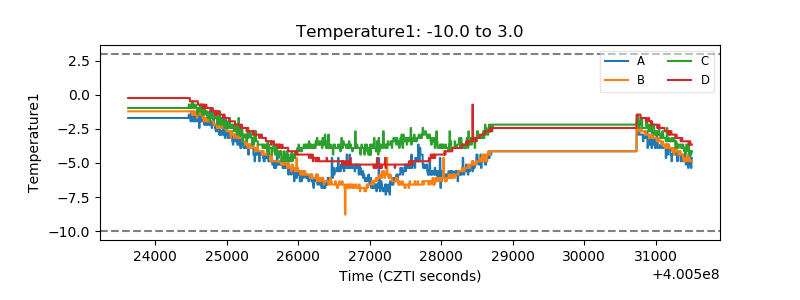 |
| Veto HV Monitor | 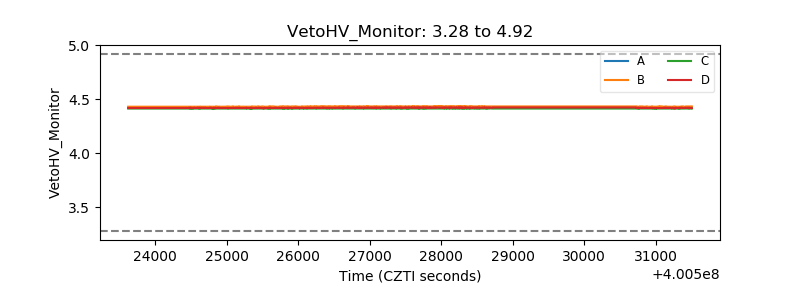 |
| Veto LLD | 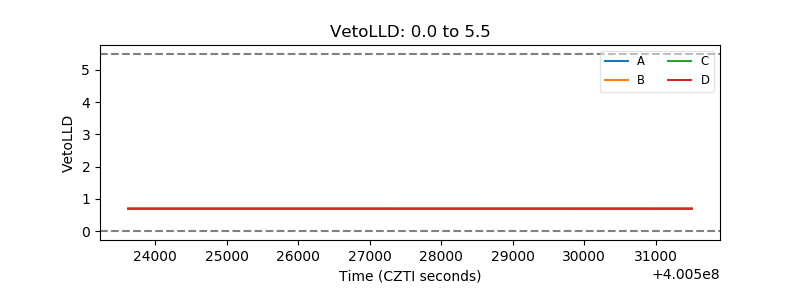 |
| Alpha Counter | 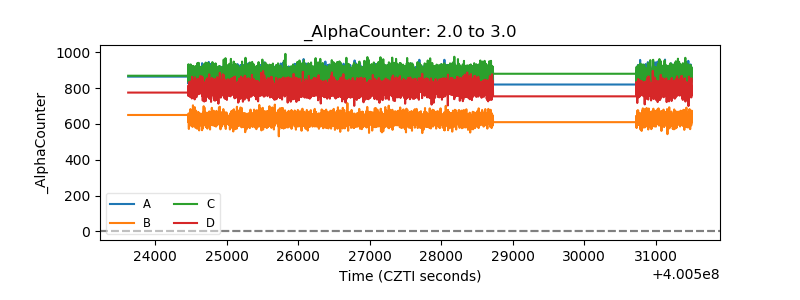 |
| _CPM_Rate | 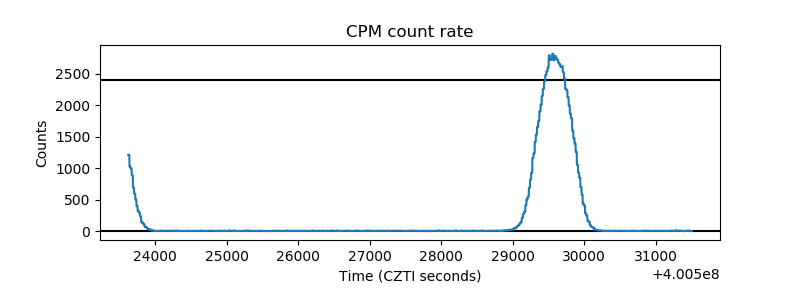 |
| CZT Counter | 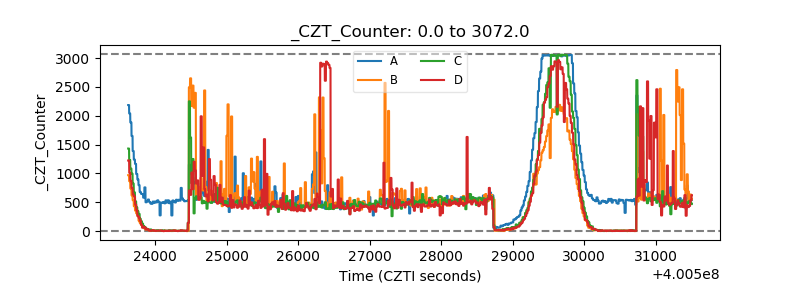 |
| +2.5 Volts monitor | 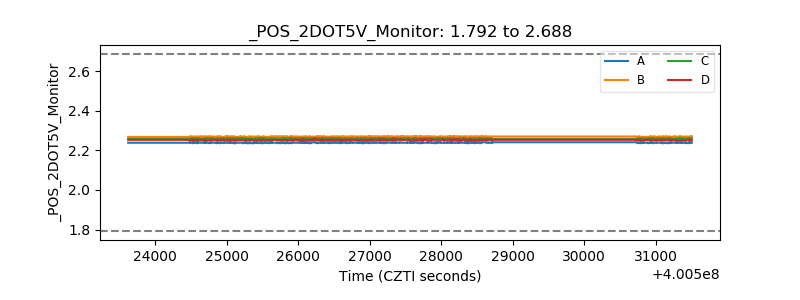 |
| +5 Volts monitor | 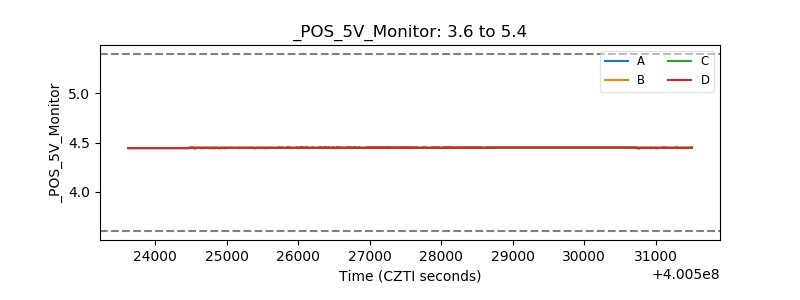 |
| _ROLL_ROT | 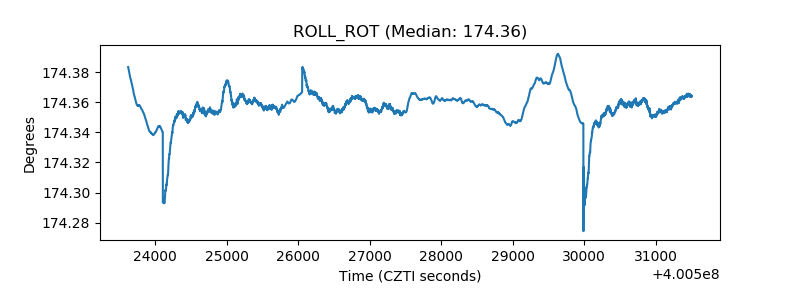 |
| _Roll_DEC | 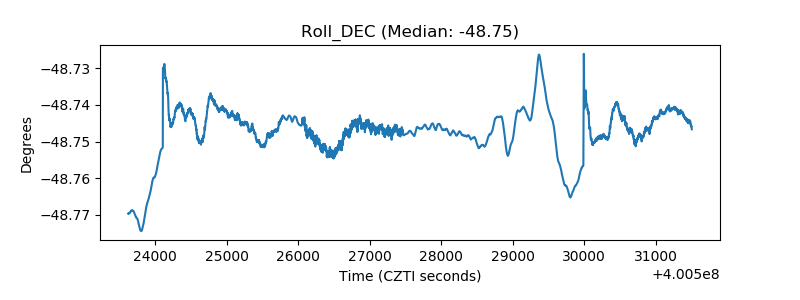 |
| _Roll_RA | 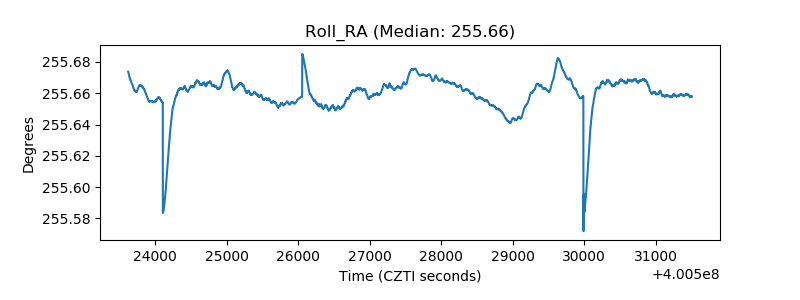 |
| Veto Counter | 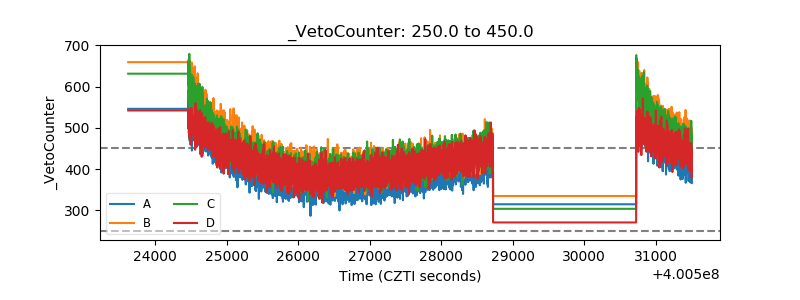 |