| Param | Original file | Final file |
|---|---|---|
| Filename | modeM0/AS1T05_053T01_9000005338_37593cztM0_level2.evt | modeM0/AS1T05_053T01_9000005338_37593cztM0_level2_quad_clean.evt |
| Size (bytes) | 405,192,960 | 64,883,520 |
| Size | 386.4 MB | 61.9 MB |
| Events in quadrant A | 2,658,334 | 416,325 |
| Events in quadrant B | 3,558,790 | 404,634 |
| Events in quadrant C | 2,756,496 | 409,885 |
| Events in quadrant D | 2,960,301 | 385,632 |
| Mode SS | |||
|---|---|---|---|
| Quadrant | BADHDUFLAG | Total packets | Discarded packets |
| A | 0 | 100 | 0 |
| B | 0 | 100 | 0 |
| C | 0 | 100 | 0 |
| D | 0 | 100 | 0 |
| Mode M0 | |||
|---|---|---|---|
| Quadrant | BADHDUFLAG | Total packets | Discarded packets |
| A | 0 | 10879 | 3 |
| B | 0 | 13678 | 2 |
| C | 0 | 11085 | 2 |
| D | 0 | 12192 | 2 |
| Mode M9 | |||
|---|---|---|---|
| Quadrant | BADHDUFLAG | Total packets | Discarded packets |
| A | 0 | 30 | 0 |
| B | 0 | 30 | 0 |
| C | 0 | 30 | 0 |
| D | 0 | 31 | 0 |
| Quadrant | Total seconds | Saturated seconds | Saturation percentage |
|---|---|---|---|
| A | 4964 | 16 | 0.322321% |
| B | 4964 | 357 | 7.191781% |
| C | 4964 | 93 | 1.873489% |
| D | 4964 | 151 | 3.041902% |
Noise dominated data is calculated using 1-second bins in cleaned event files. If a bin has >2000 counts, and if more than 50% of those come from <1% of pixels, then it is considered to be noise-dominated and hence unusable.
| Quadrant | # 1 sec bins | Bins with >0 counts | Bins with >2000 counts | High rate bins dominated by noise | Noise dominated (total time) | Noise dominated (detector-on time) | Marked lightcurve |
|---|---|---|---|---|---|---|---|
| A | 7057 | 4965 | 10 | 10 | 0.14% | 0.20% | 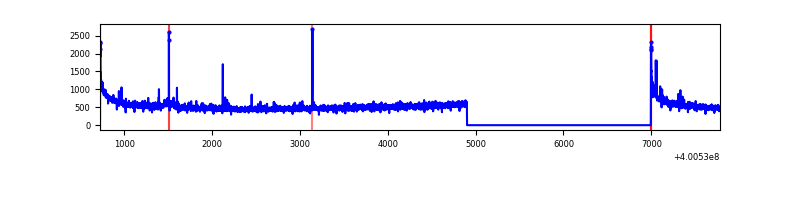 |
| B | 7056 | 4964 | 319 | 319 | 4.52% | 6.43% | 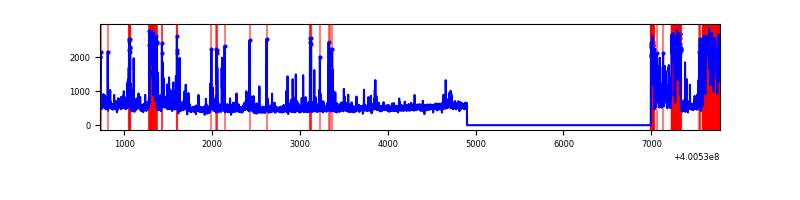 |
| C | 7057 | 4965 | 101 | 101 | 1.43% | 2.03% | 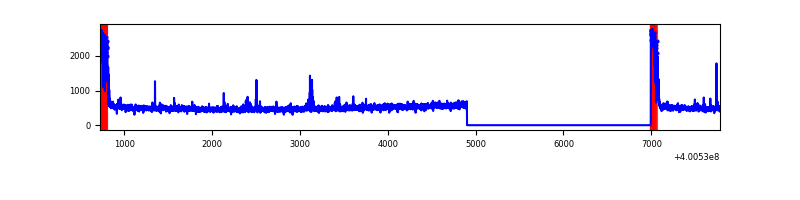 |
| D | 7057 | 4965 | 177 | 177 | 2.51% | 3.56% | 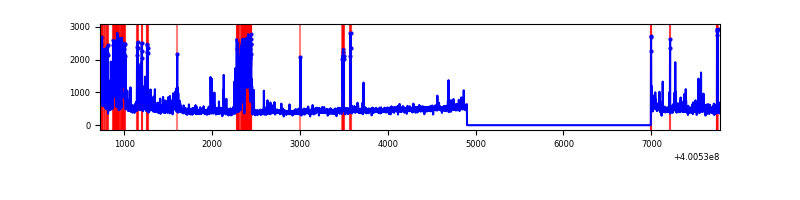 |
Top three noisy pixels from each quadrant. If the there are fewer than three noisy pixels in the level2.evt file, extra rows are filled as -1
| Pixel properties | Quadrant properties | ||||||
|---|---|---|---|---|---|---|---|
| Quadrant | DetID | PixID | Counts | Sigma | Mean | Median | Sigma |
| A | 10 | 83 | 303896 | 2567.34 | 588 | 578 | 118.1 |
| A | 13 | 6 | 29205 | 242.3 | 588 | 578 | 118.1 |
| A | 9 | 143 | 22662 | 186.92 | 588 | 578 | 118.1 |
| B | 5 | 255 | 752622 | 6944.22 | 574 | 561 | 108.3 |
| B | 5 | 172 | 229940 | 2117.99 | 574 | 561 | 108.3 |
| B | 0 | 189 | 94028 | 863.04 | 574 | 561 | 108.3 |
| C | 0 | 10 | 291024 | 2216.39 | 564 | 567 | 131.0 |
| C | 15 | 214 | 214153 | 1629.81 | 564 | 567 | 131.0 |
| C | 14 | 254 | 39796 | 299.34 | 564 | 567 | 131.0 |
| D | 2 | 249 | 353135 | 2623.89 | 555 | 541 | 134.4 |
| D | 12 | 233 | 265624 | 1972.66 | 555 | 541 | 134.4 |
| D | 2 | 250 | 54590 | 402.21 | 555 | 541 | 134.4 |
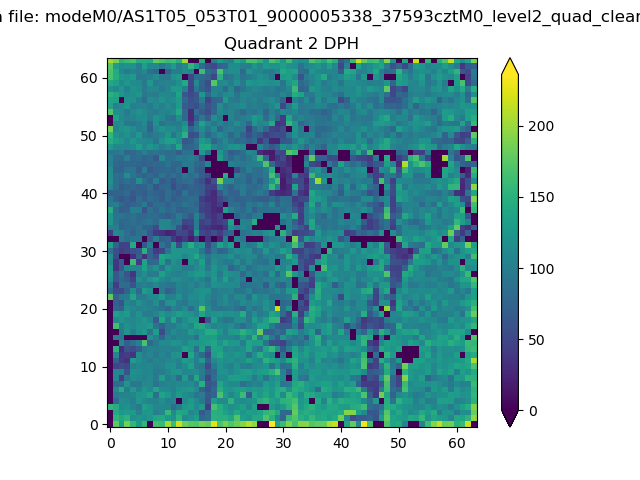
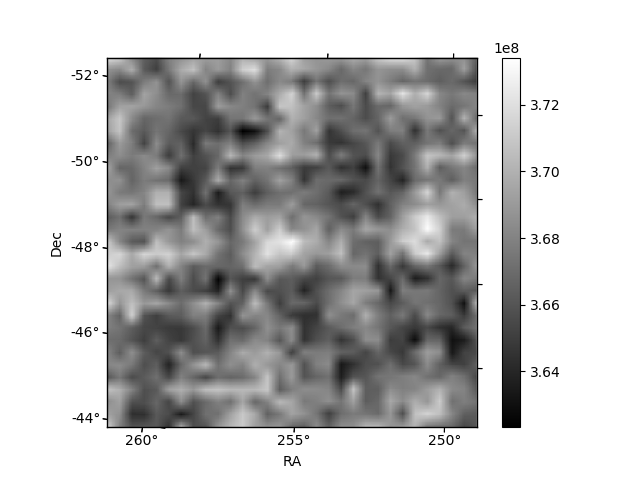
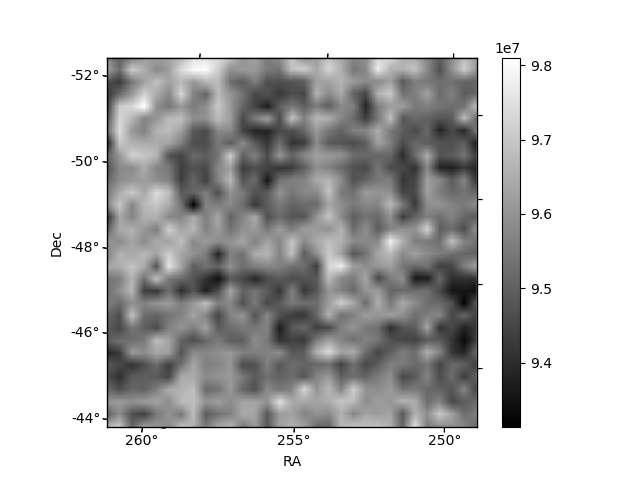
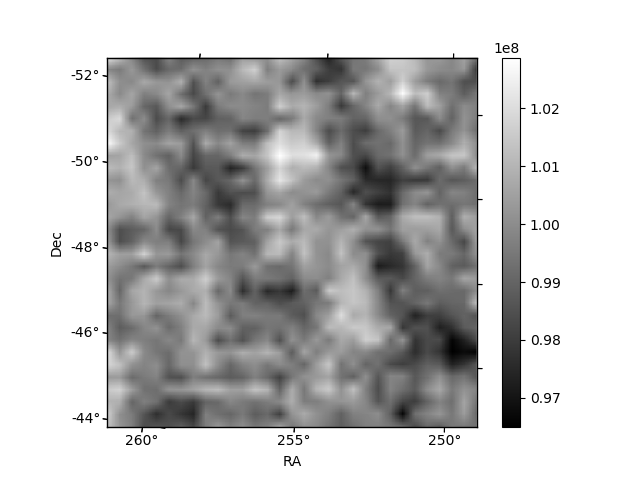
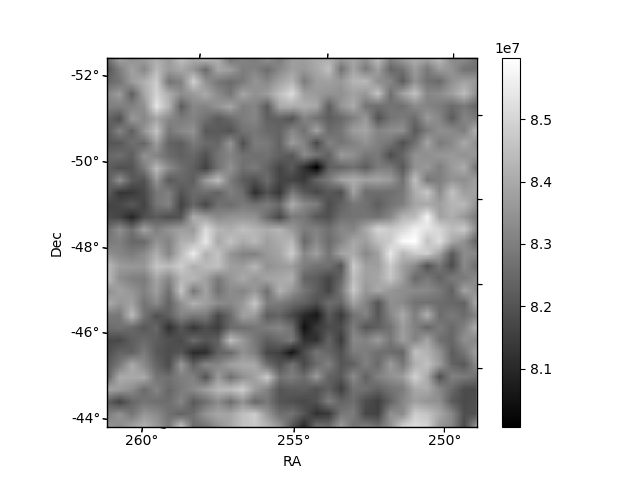
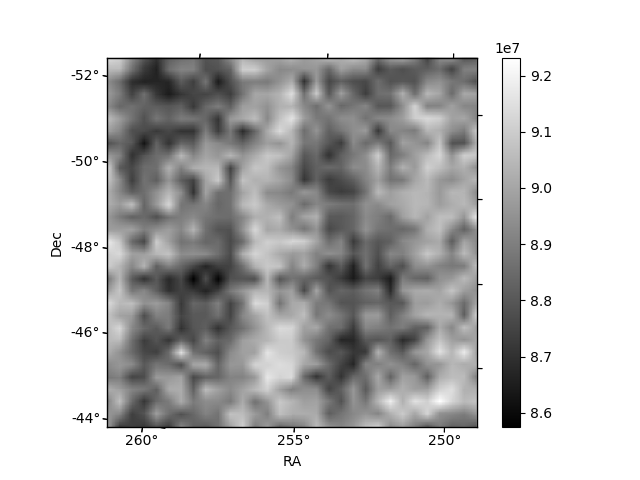
Histogram calculated using DETX and DETY for each event in the final _common_clean file
| Quadrant A | 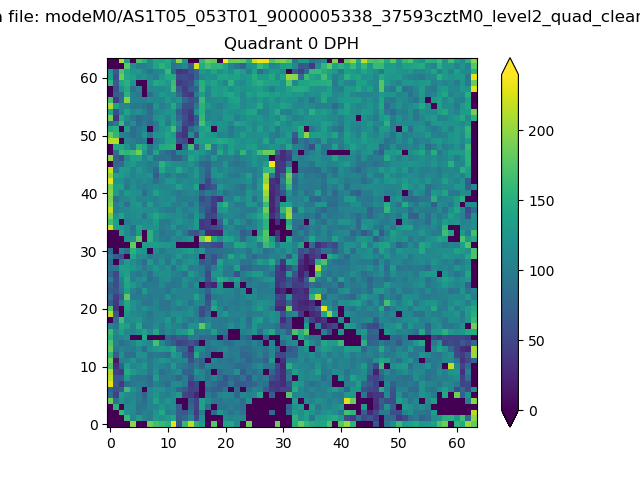 |
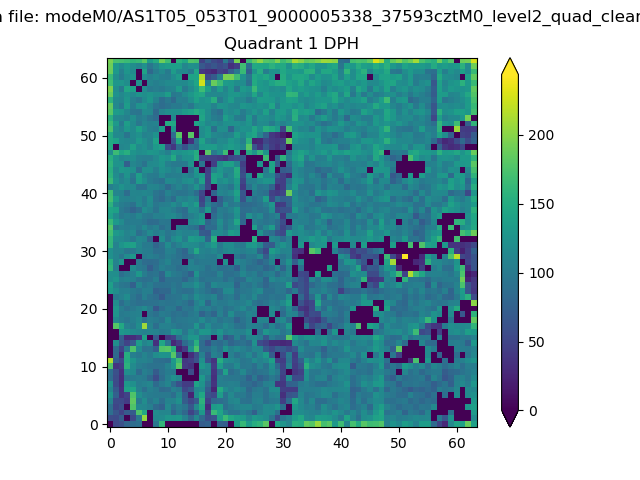 |
Quadrant B |
|---|---|---|---|
| Quadrant D | 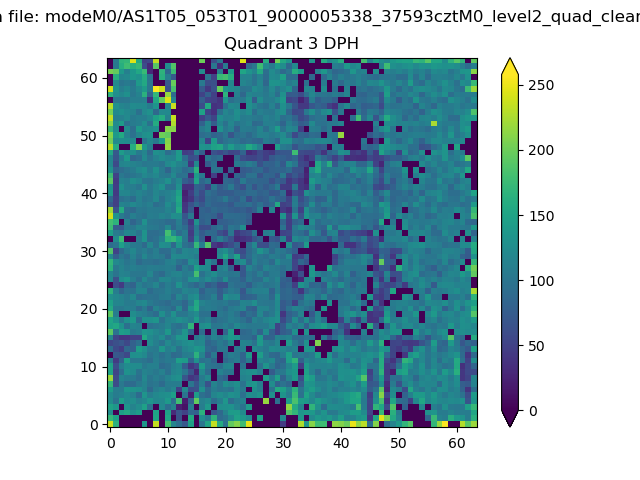 |
 |
Quadrant C |
| Plot type | Count rate plots | Images |
|---|---|---|
| Comparison with Poisson distribution Blue bars denote a histogram of data divided into 1 sec bins. Red curve is a Poisson curve with rate = median count rate of data. |
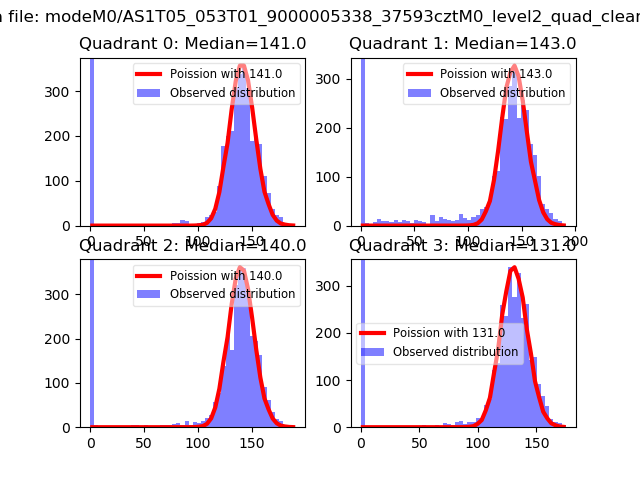 |
 |
| Quadrant-wise count rates Data is divided into 100 sec bins |
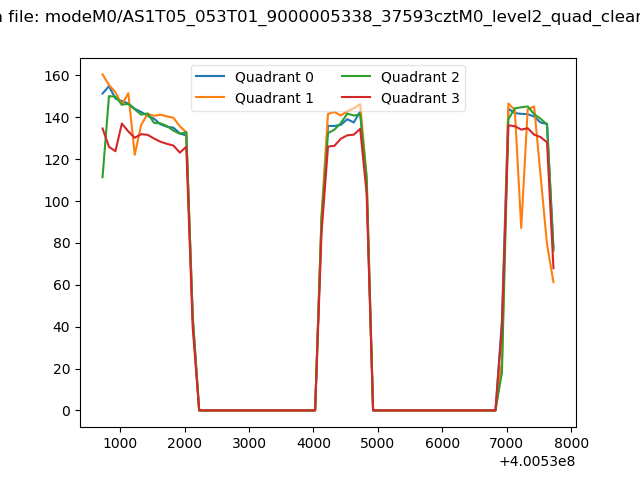 |
|
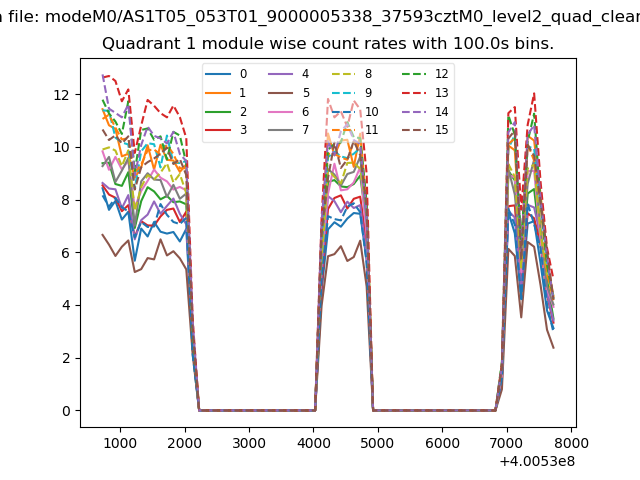
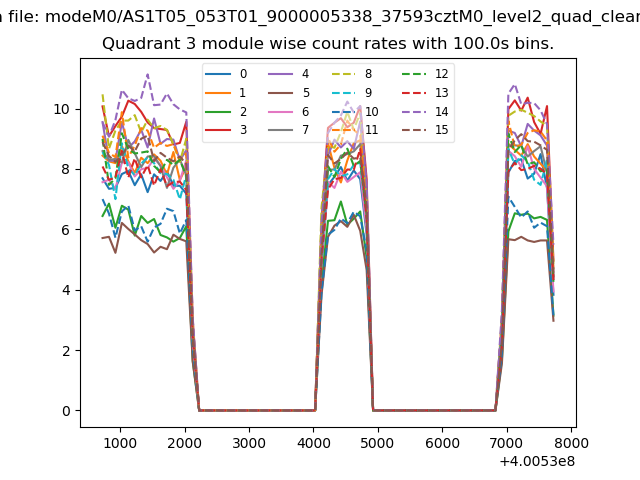
| Module-wise count rates for Quadrant A Data is divided into 100 sec bins |
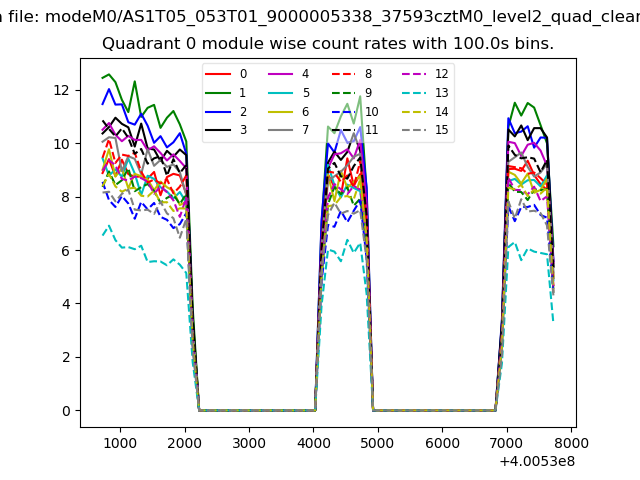 |
 |
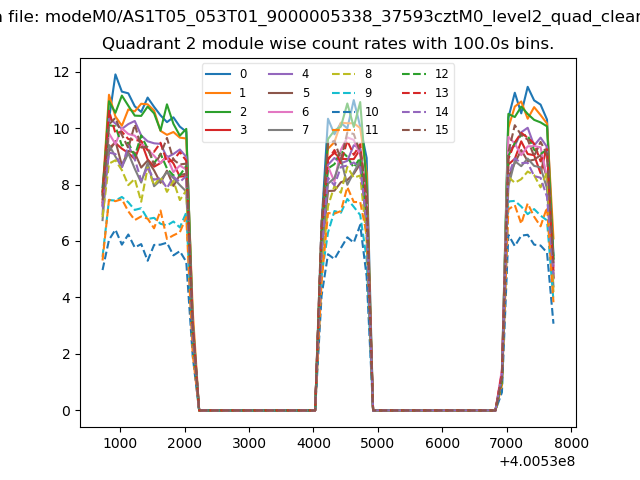
| Module-wise count rates for Quadrant B Data is divided into 100 sec bins |
 |
 |
| Module-wise count rates for Quadrant C Data is divided into 100 sec bins |
 |
 |
| Module-wise count rates for Quadrant D Data is divided into 100 sec bins |
 |
 |
| Parameter | Plot |
|---|---|
| CZT HV Monitor | 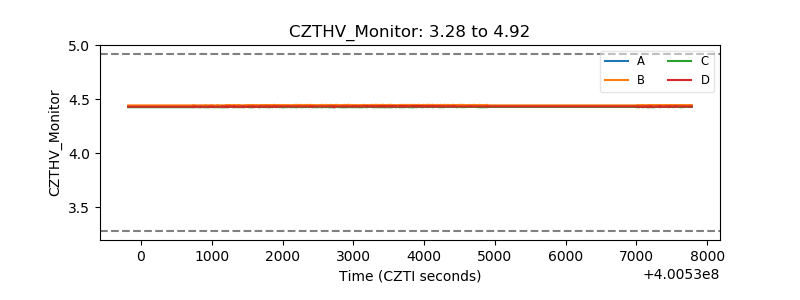 |
| D_VDD | 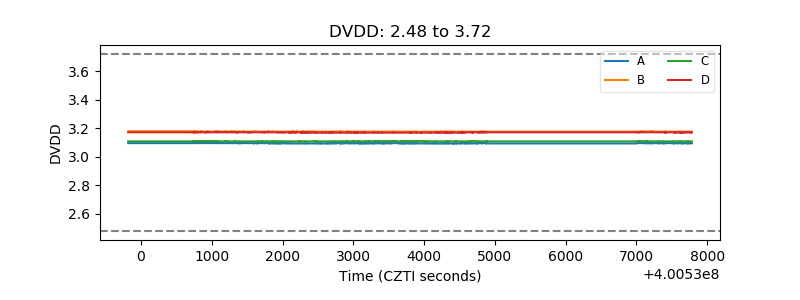 |
| Temperature 1 | 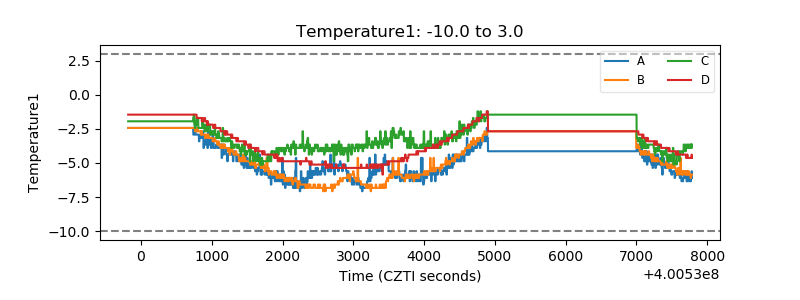 |
| Veto HV Monitor | 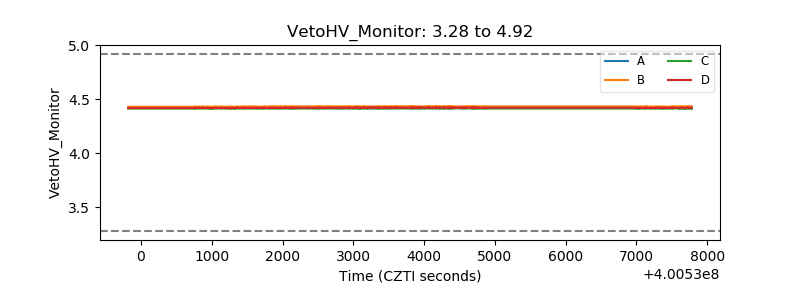 |
| Veto LLD | 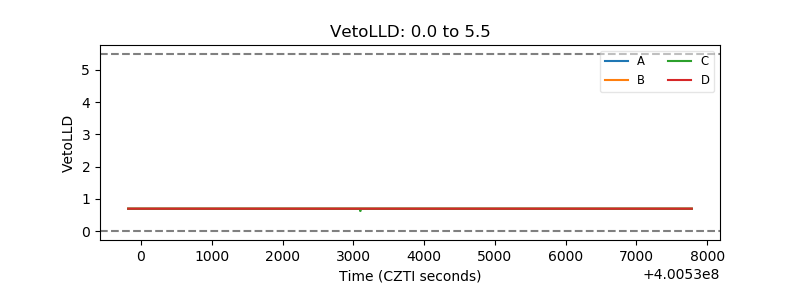 |
| Alpha Counter | 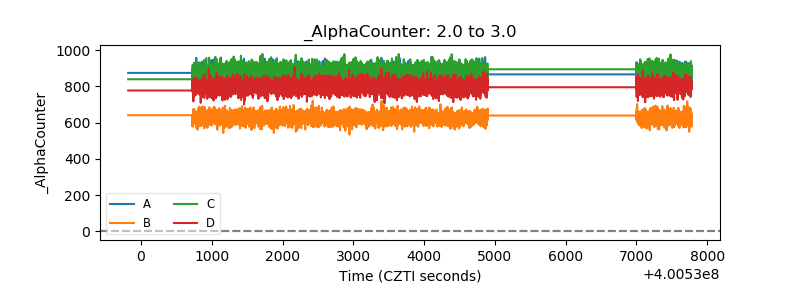 |
| _CPM_Rate | 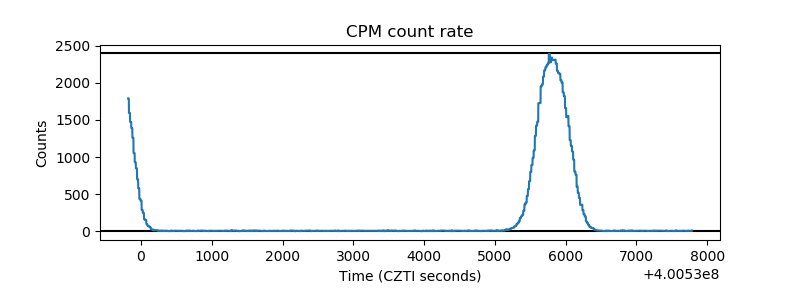 |
| CZT Counter | 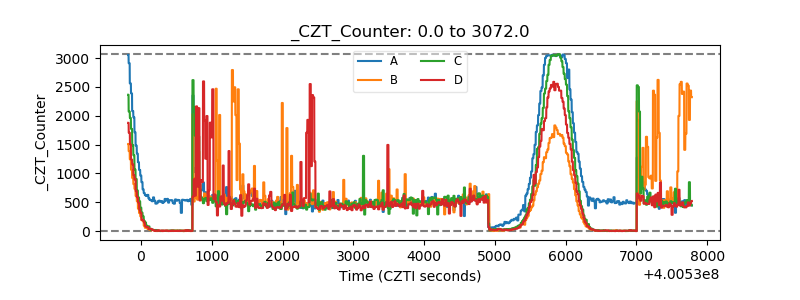 |
| +2.5 Volts monitor |  |
| +5 Volts monitor | 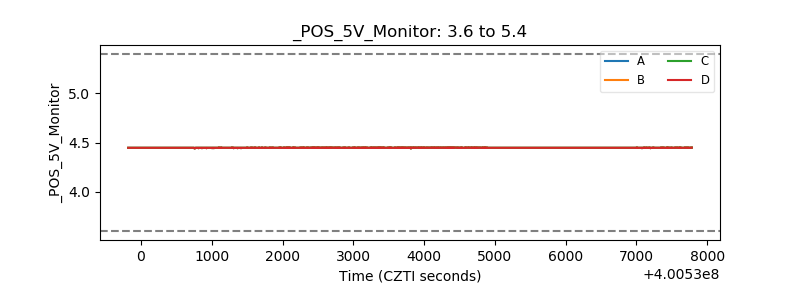 |
| _ROLL_ROT | 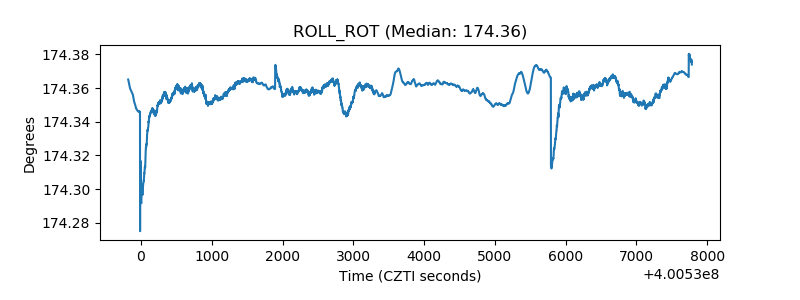 |
| _Roll_DEC | 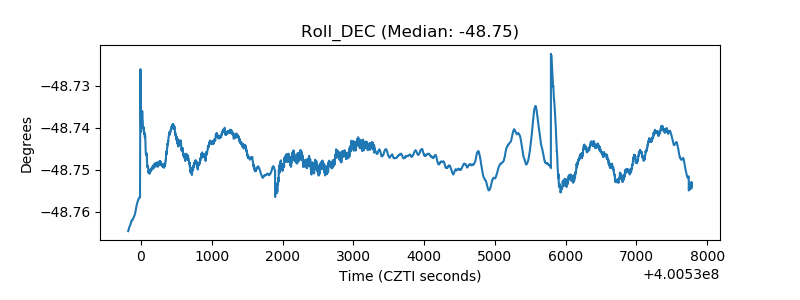 |
| _Roll_RA | 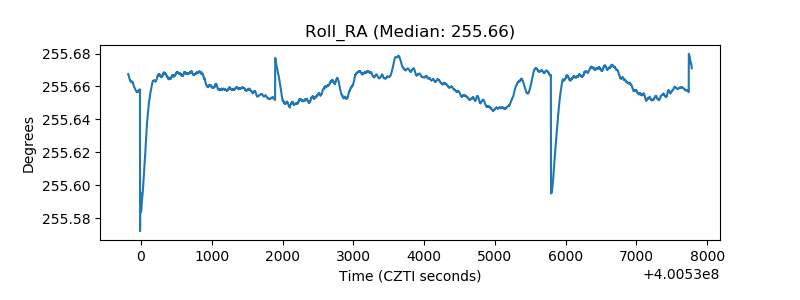 |
| Veto Counter | 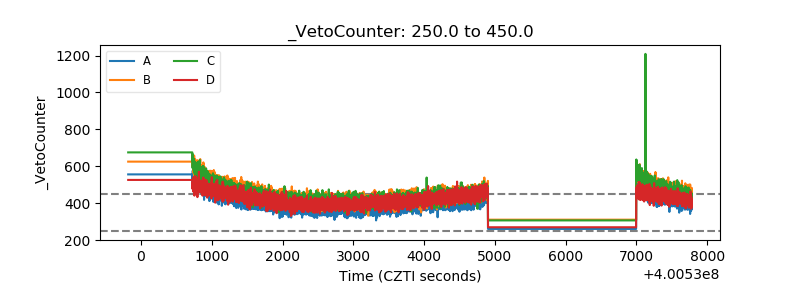 |