| Param | Original file | Final file |
|---|---|---|
| Filename | modeM0/AS1T05_053T01_9000005338_37594cztM0_level2.evt | modeM0/AS1T05_053T01_9000005338_37594cztM0_level2_quad_clean.evt |
| Size (bytes) | 406,609,920 | 58,547,520 |
| Size | 387.8 MB | 55.8 MB |
| Events in quadrant A | 2,598,153 | 367,943 |
| Events in quadrant B | 4,191,672 | 343,911 |
| Events in quadrant C | 2,630,214 | 367,929 |
| Events in quadrant D | 2,558,685 | 346,638 |
| Mode SS | |||
|---|---|---|---|
| Quadrant | BADHDUFLAG | Total packets | Discarded packets |
| A | 0 | 100 | 0 |
| B | 0 | 100 | 0 |
| C | 0 | 100 | 0 |
| D | 0 | 100 | 0 |
| Mode M0 | |||
|---|---|---|---|
| Quadrant | BADHDUFLAG | Total packets | Discarded packets |
| A | 0 | 10736 | 3 |
| B | 0 | 15655 | 2 |
| C | 0 | 10711 | 2 |
| D | 0 | 11039 | 2 |
| Mode M9 | |||
|---|---|---|---|
| Quadrant | BADHDUFLAG | Total packets | Discarded packets |
| A | 0 | 31 | 0 |
| B | 0 | 31 | 0 |
| C | 0 | 31 | 0 |
| D | 0 | 32 | 0 |
| Quadrant | Total seconds | Saturated seconds | Saturation percentage |
|---|---|---|---|
| A | 4934 | 18 | 0.364816% |
| B | 4934 | 630 | 12.768545% |
| C | 4934 | 66 | 1.337657% |
| D | 4934 | 49 | 0.993109% |
Noise dominated data is calculated using 1-second bins in cleaned event files. If a bin has >2000 counts, and if more than 50% of those come from <1% of pixels, then it is considered to be noise-dominated and hence unusable.
| Quadrant | # 1 sec bins | Bins with >0 counts | Bins with >2000 counts | High rate bins dominated by noise | Noise dominated (total time) | Noise dominated (detector-on time) | Marked lightcurve |
|---|---|---|---|---|---|---|---|
| A | 7088 | 4935 | 12 | 12 | 0.17% | 0.24% | 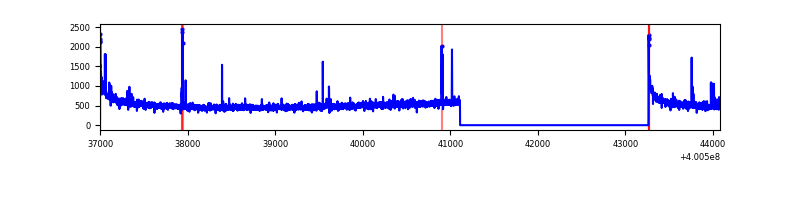 |
| B | 7088 | 4935 | 578 | 578 | 8.15% | 11.71% | 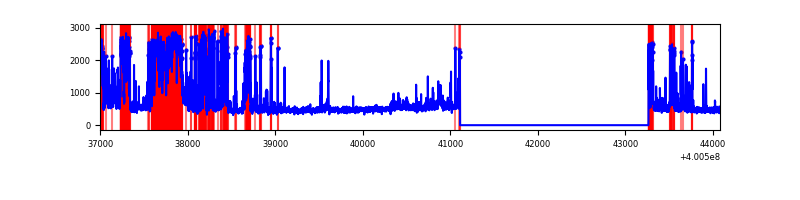 |
| C | 7088 | 4935 | 73 | 73 | 1.03% | 1.48% | 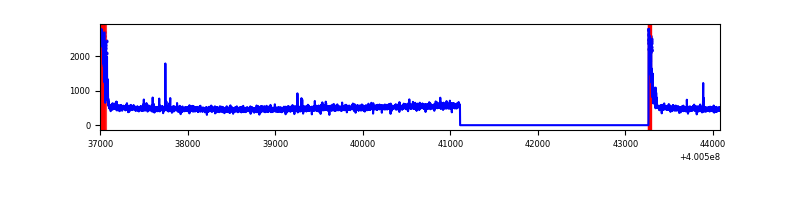 |
| D | 7088 | 4935 | 53 | 53 | 0.75% | 1.07% | 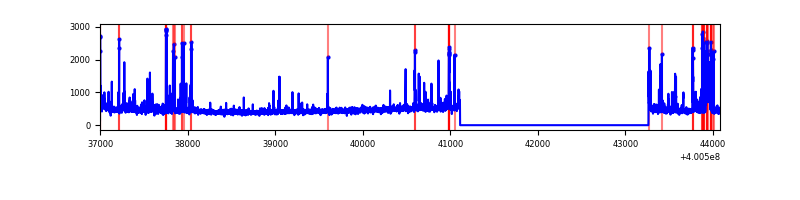 |
Top three noisy pixels from each quadrant. If the there are fewer than three noisy pixels in the level2.evt file, extra rows are filled as -1
| Pixel properties | Quadrant properties | ||||||
|---|---|---|---|---|---|---|---|
| Quadrant | DetID | PixID | Counts | Sigma | Mean | Median | Sigma |
| A | 10 | 83 | 293440 | 2526.15 | 575 | 564 | 115.9 |
| A | 9 | 143 | 45828 | 390.42 | 575 | 564 | 115.9 |
| A | 13 | 6 | 13151 | 108.57 | 575 | 564 | 115.9 |
| B | 5 | 255 | 1687146 | 15871.51 | 550 | 537 | 106.3 |
| B | 5 | 172 | 174754 | 1639.43 | 550 | 537 | 106.3 |
| B | 4 | 81 | 58407 | 544.57 | 550 | 537 | 106.3 |
| C | 0 | 10 | 223364 | 1716.42 | 558 | 562 | 129.8 |
| C | 15 | 214 | 212764 | 1634.76 | 558 | 562 | 129.8 |
| C | 14 | 254 | 5342 | 36.82 | 558 | 562 | 129.8 |
| D | 2 | 249 | 247024 | 1833.57 | 550 | 536 | 134.4 |
| D | 12 | 233 | 47421 | 348.77 | 550 | 536 | 134.4 |
| D | 13 | 249 | 31108 | 227.42 | 550 | 536 | 134.4 |
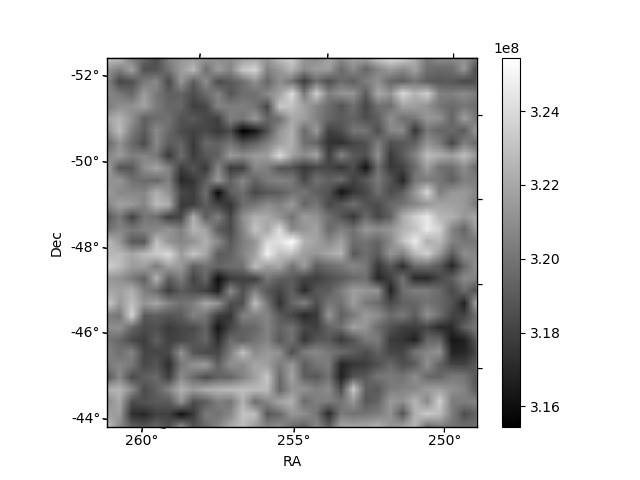
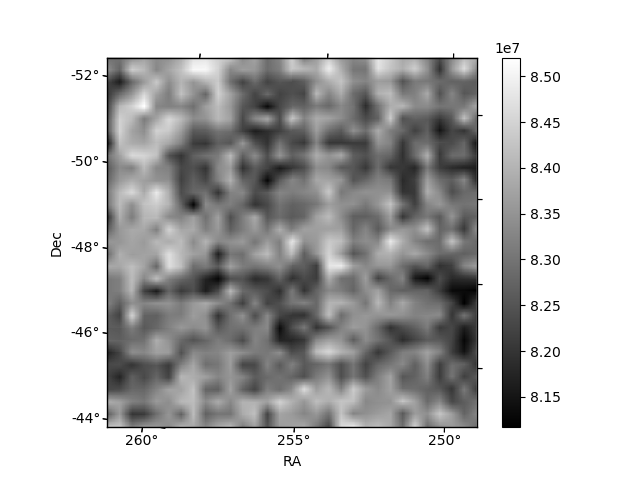
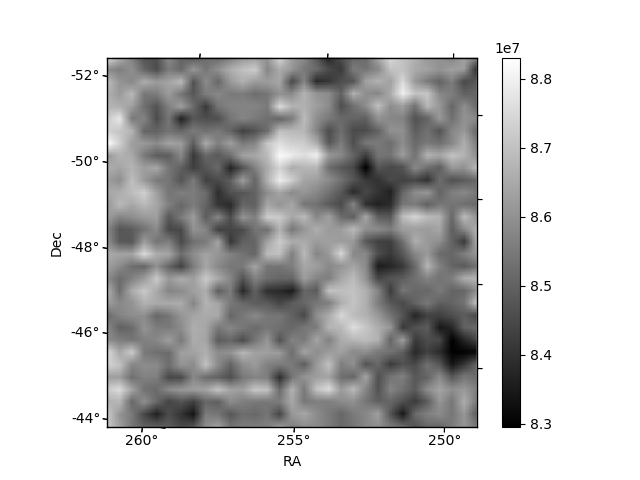
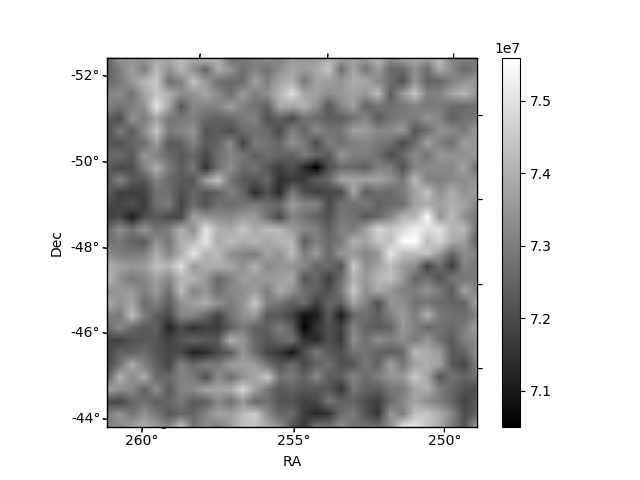
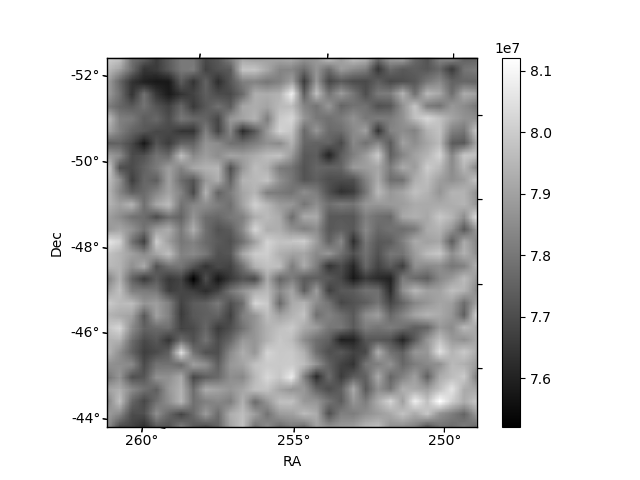
Histogram calculated using DETX and DETY for each event in the final _common_clean file
| Quadrant A | 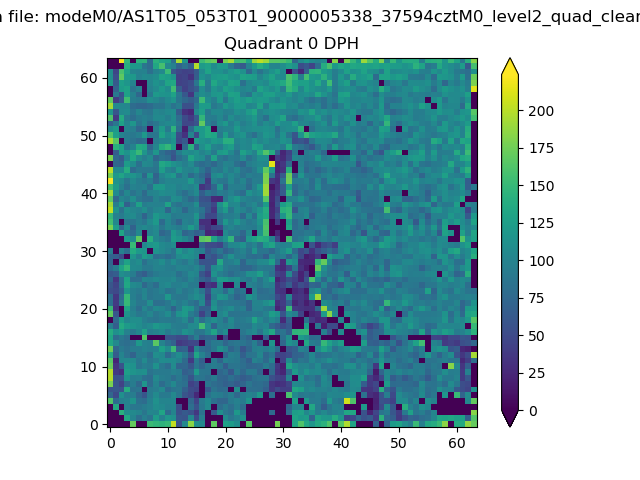 |
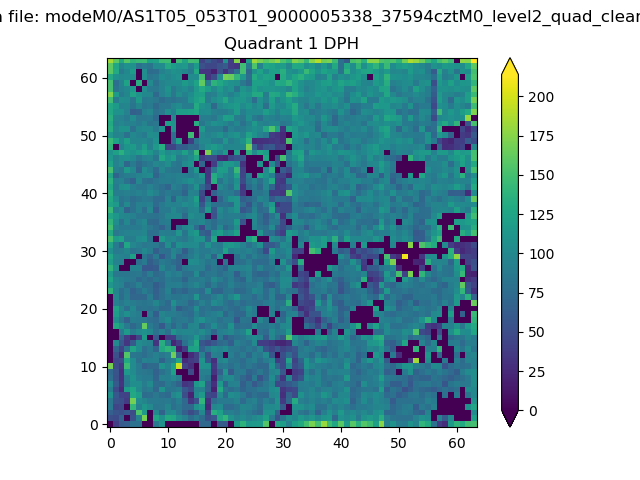 |
Quadrant B |
|---|---|---|---|
| Quadrant D | 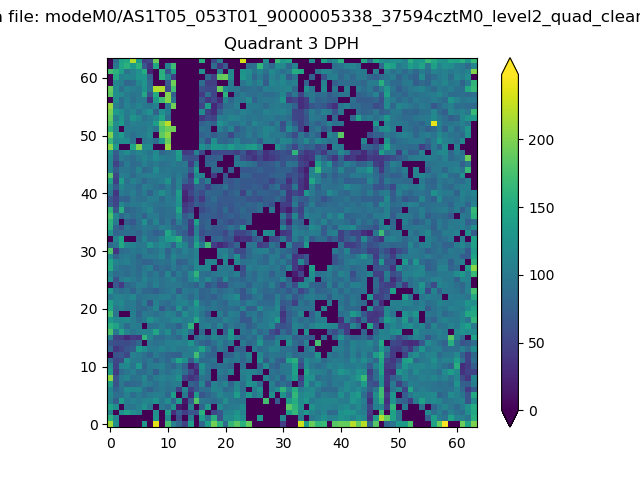 |
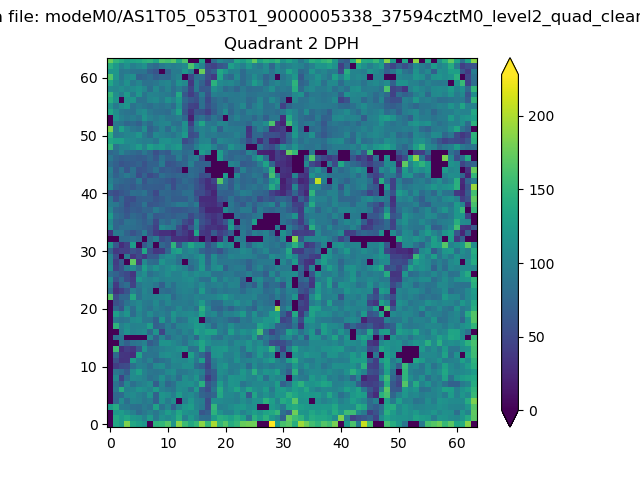 |
Quadrant C |
| Plot type | Count rate plots | Images |
|---|---|---|
| Comparison with Poisson distribution Blue bars denote a histogram of data divided into 1 sec bins. Red curve is a Poisson curve with rate = median count rate of data. |
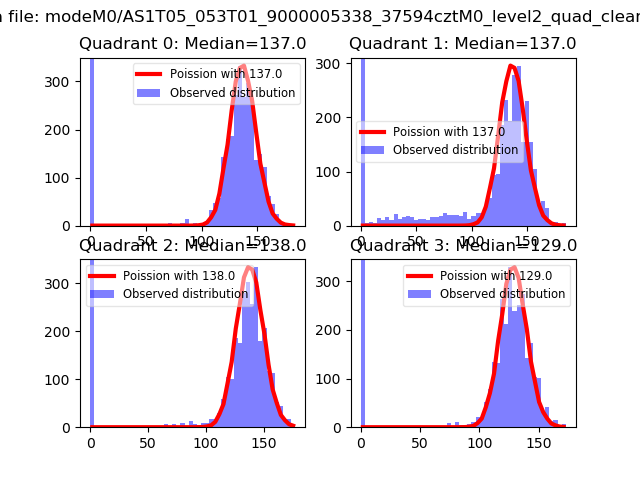 |
 |
| Quadrant-wise count rates Data is divided into 100 sec bins |
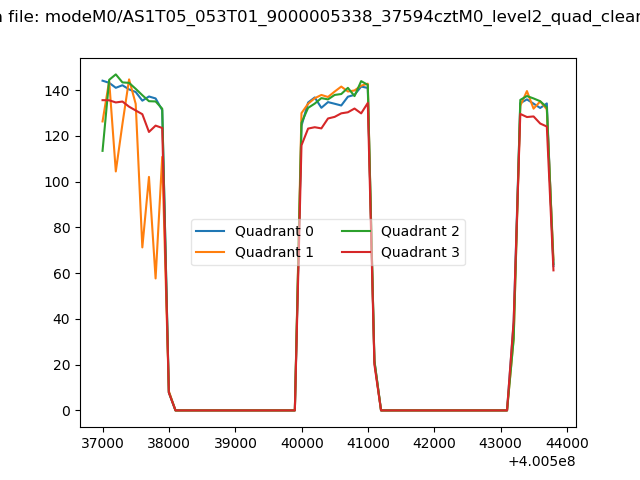 |
|
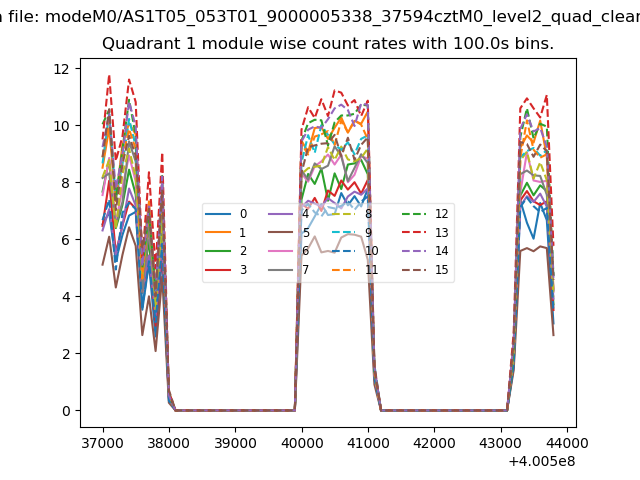
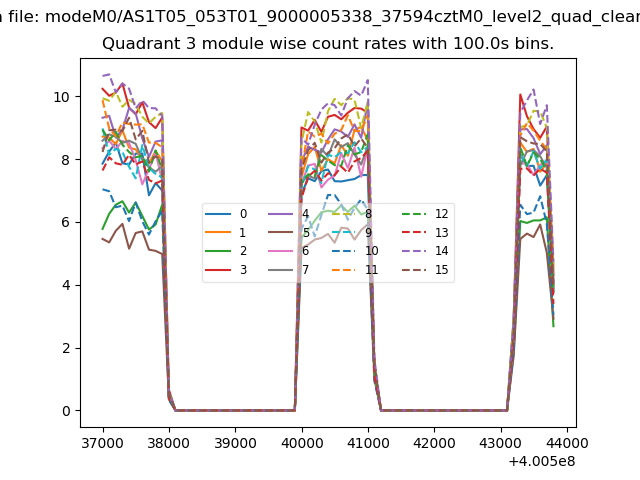
| Module-wise count rates for Quadrant A Data is divided into 100 sec bins |
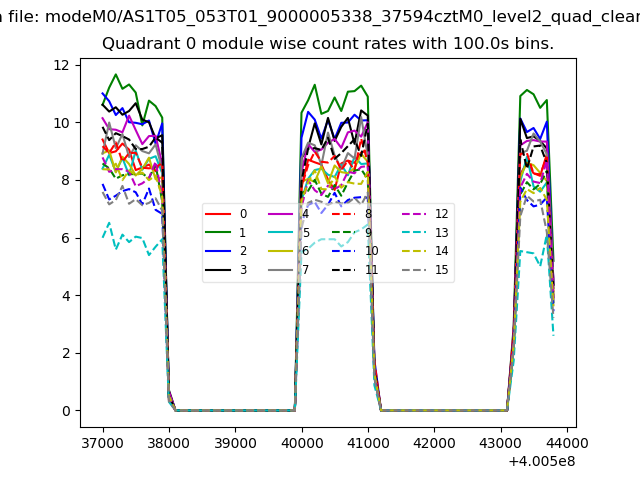 |
 |
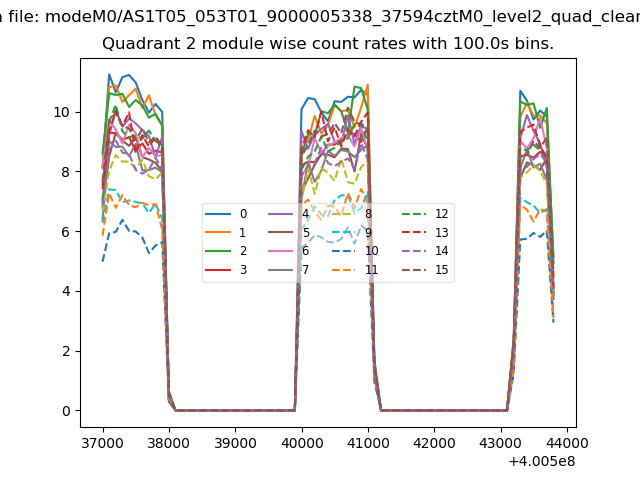
| Module-wise count rates for Quadrant B Data is divided into 100 sec bins |
 |
 |
| Module-wise count rates for Quadrant C Data is divided into 100 sec bins |
 |
 |
| Module-wise count rates for Quadrant D Data is divided into 100 sec bins |
 |
 |
| Parameter | Plot |
|---|---|
| CZT HV Monitor | 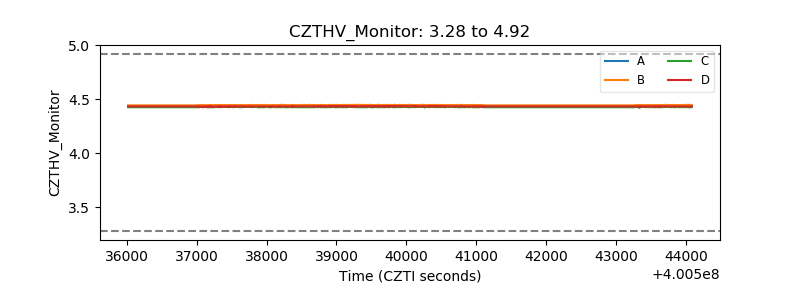 |
| D_VDD | 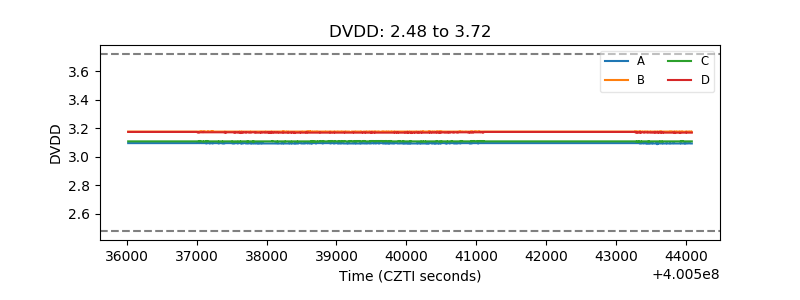 |
| Temperature 1 | 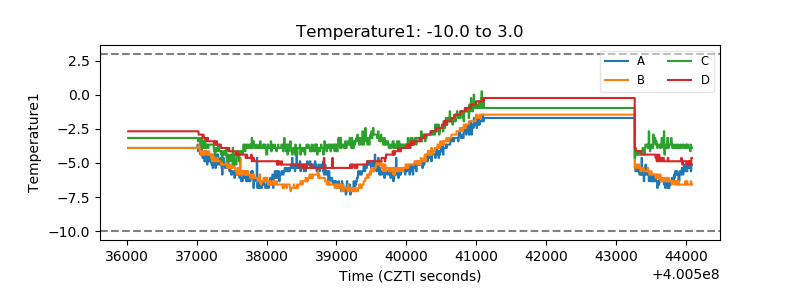 |
| Veto HV Monitor | 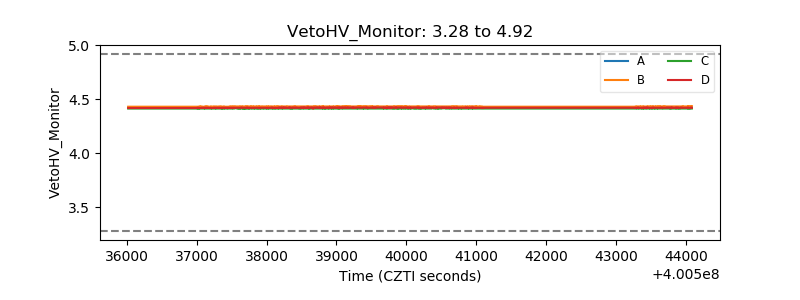 |
| Veto LLD | 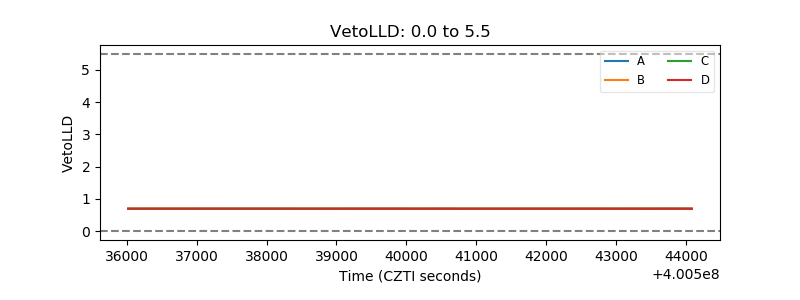 |
| Alpha Counter | 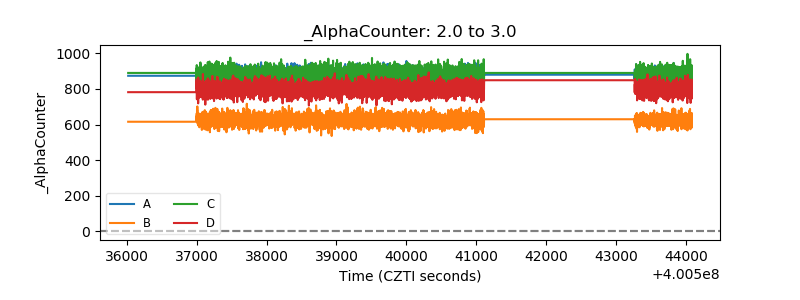 |
| _CPM_Rate | 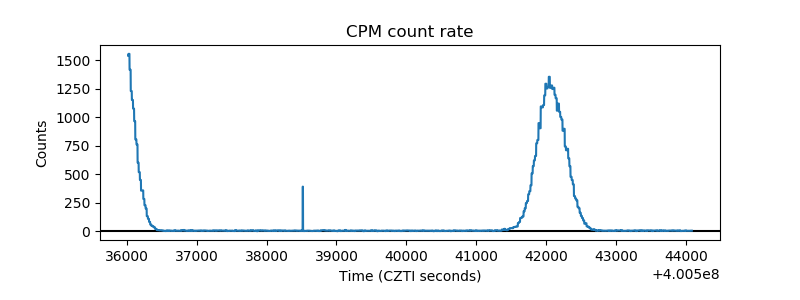 |
| CZT Counter | 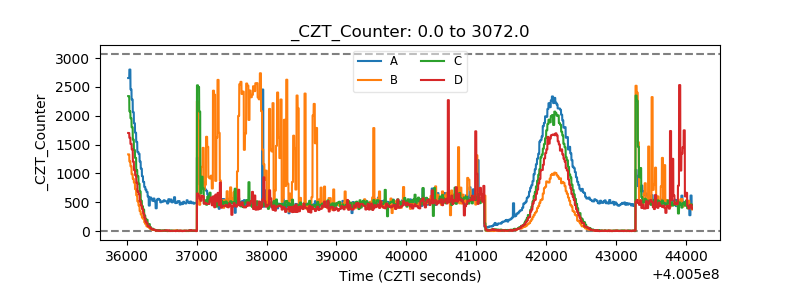 |
| +2.5 Volts monitor | 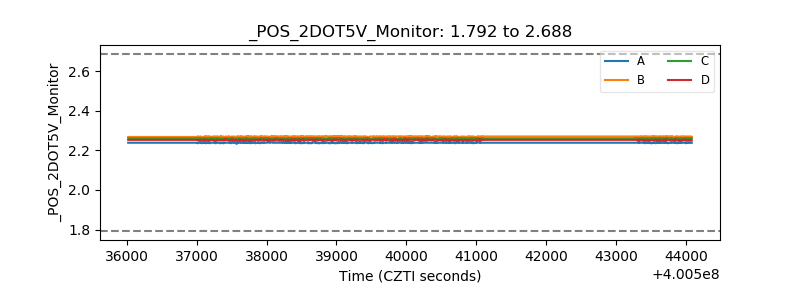 |
| +5 Volts monitor | 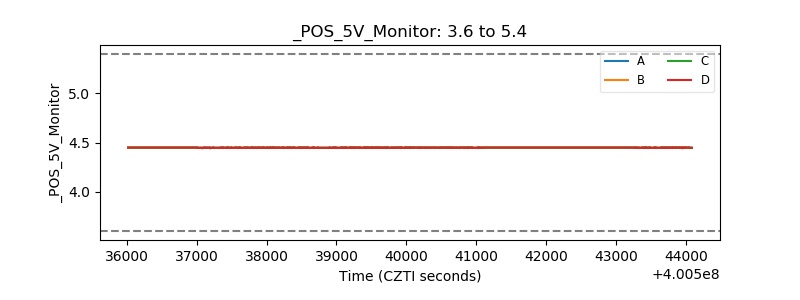 |
| _ROLL_ROT | 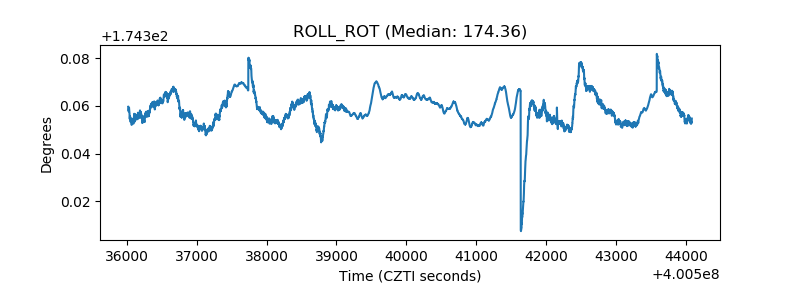 |
| _Roll_DEC | 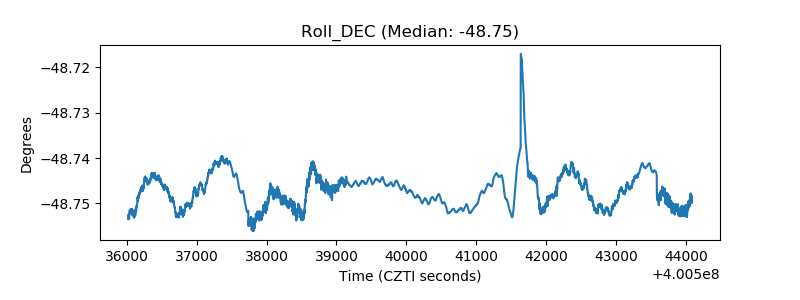 |
| _Roll_RA | 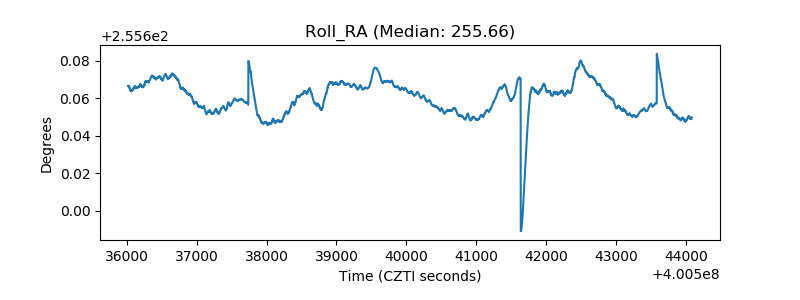 |
| Veto Counter | 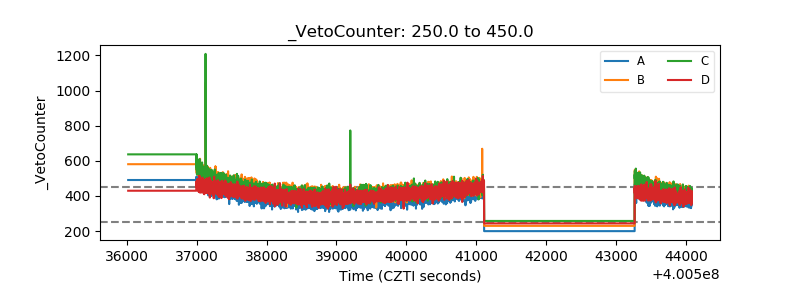 |