| Param | Original file | Final file |
|---|---|---|
| Filename | modeM0/AS1T05_053T01_9000005338_37596cztM0_level2.evt | modeM0/AS1T05_053T01_9000005338_37596cztM0_level2_quad_clean.evt |
| Size (bytes) | 376,920,000 | 52,724,160 |
| Size | 359.5 MB | 50.3 MB |
| Events in quadrant A | 2,661,914 | 309,890 |
| Events in quadrant B | 2,657,233 | 314,466 |
| Events in quadrant C | 2,671,162 | 313,982 |
| Events in quadrant D | 3,068,092 | 290,835 |
| Mode SS | |||
|---|---|---|---|
| Quadrant | BADHDUFLAG | Total packets | Discarded packets |
| A | 0 | 108 | 0 |
| B | 0 | 108 | 0 |
| C | 0 | 108 | 0 |
| D | 0 | 108 | 0 |
| Mode M0 | |||
|---|---|---|---|
| Quadrant | BADHDUFLAG | Total packets | Discarded packets |
| A | 0 | 11048 | 3 |
| B | 0 | 11363 | 2 |
| C | 0 | 11070 | 2 |
| D | 0 | 12799 | 2 |
| Mode M9 | |||
|---|---|---|---|
| Quadrant | BADHDUFLAG | Total packets | Discarded packets |
| A | 0 | 26 | 0 |
| B | 0 | 26 | 0 |
| C | 0 | 26 | 0 |
| D | 0 | 27 | 0 |
| Quadrant | Total seconds | Saturated seconds | Saturation percentage |
|---|---|---|---|
| A | 5234 | 13 | 0.248376% |
| B | 5234 | 32 | 0.611387% |
| C | 5234 | 40 | 0.764234% |
| D | 5234 | 166 | 3.171571% |
Noise dominated data is calculated using 1-second bins in cleaned event files. If a bin has >2000 counts, and if more than 50% of those come from <1% of pixels, then it is considered to be noise-dominated and hence unusable.
| Quadrant | # 1 sec bins | Bins with >0 counts | Bins with >2000 counts | High rate bins dominated by noise | Noise dominated (total time) | Noise dominated (detector-on time) | Marked lightcurve |
|---|---|---|---|---|---|---|---|
| A | 7088 | 5235 | 8 | 8 | 0.11% | 0.15% | 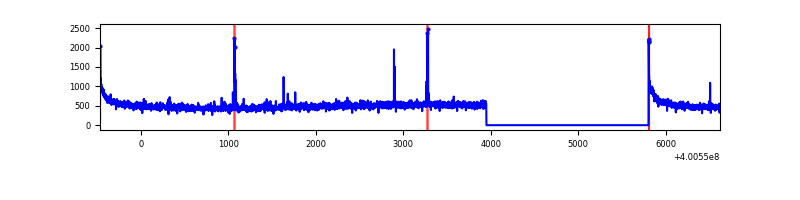 |
| B | 7088 | 5234 | 20 | 20 | 0.28% | 0.38% | 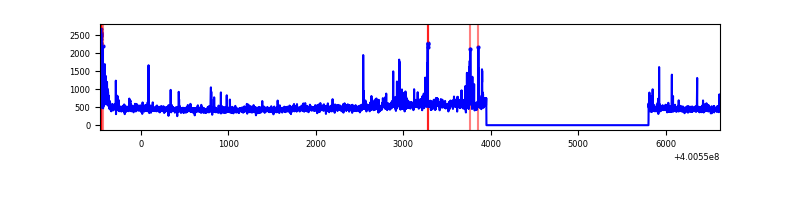 |
| C | 7088 | 5235 | 36 | 36 | 0.51% | 0.69% | 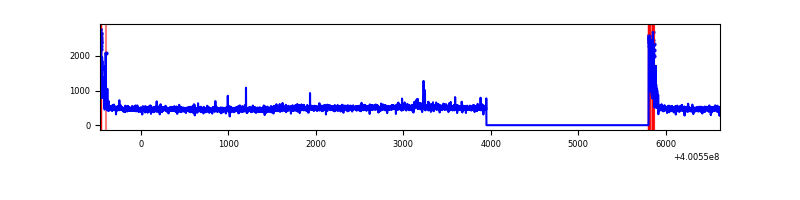 |
| D | 7088 | 5234 | 164 | 164 | 2.31% | 3.13% | 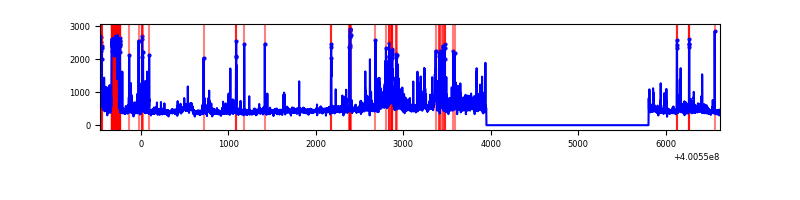 |
Top three noisy pixels from each quadrant. If the there are fewer than three noisy pixels in the level2.evt file, extra rows are filled as -1
| Pixel properties | Quadrant properties | ||||||
|---|---|---|---|---|---|---|---|
| Quadrant | DetID | PixID | Counts | Sigma | Mean | Median | Sigma |
| A | 10 | 83 | 302600 | 2534.84 | 590 | 578 | 119.1 |
| A | 9 | 143 | 20250 | 165.1 | 590 | 578 | 119.1 |
| A | 7 | 3 | 18095 | 147.02 | 590 | 578 | 119.1 |
| B | 5 | 255 | 113411 | 989.43 | 590 | 575 | 114.0 |
| B | 0 | 213 | 45302 | 392.2 | 590 | 575 | 114.0 |
| B | 0 | 245 | 33386 | 287.71 | 590 | 575 | 114.0 |
| C | 15 | 214 | 228311 | 1678.92 | 576 | 580 | 135.6 |
| C | 0 | 10 | 169002 | 1241.67 | 576 | 580 | 135.6 |
| C | 15 | 159 | 11835 | 82.98 | 576 | 580 | 135.6 |
| D | 2 | 249 | 420236 | 3009.99 | 565 | 549 | 139.4 |
| D | 10 | 253 | 107626 | 767.95 | 565 | 549 | 139.4 |
| D | 1 | 47 | 102318 | 729.89 | 565 | 549 | 139.4 |
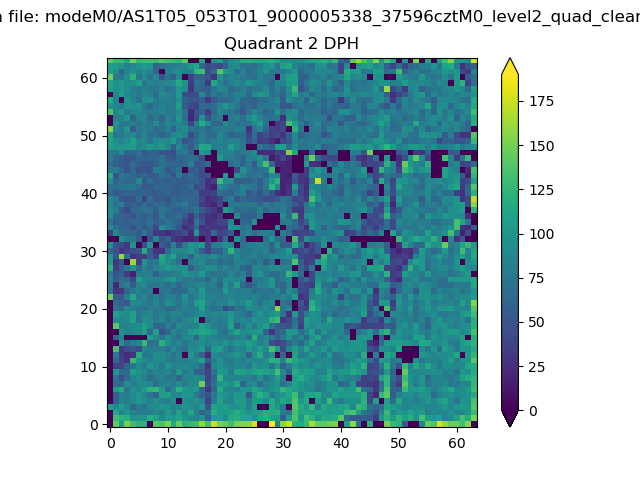
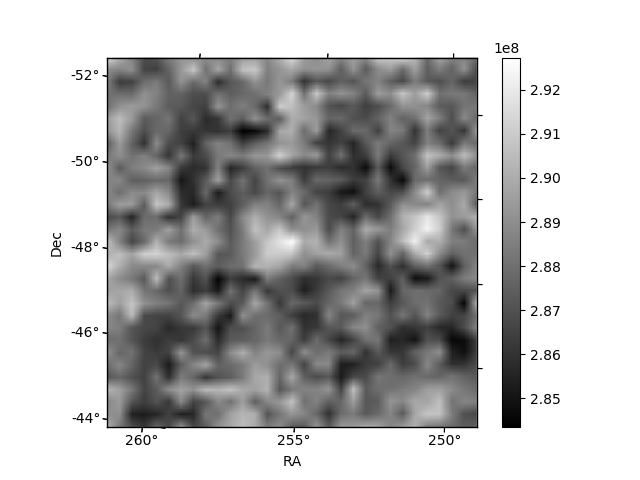
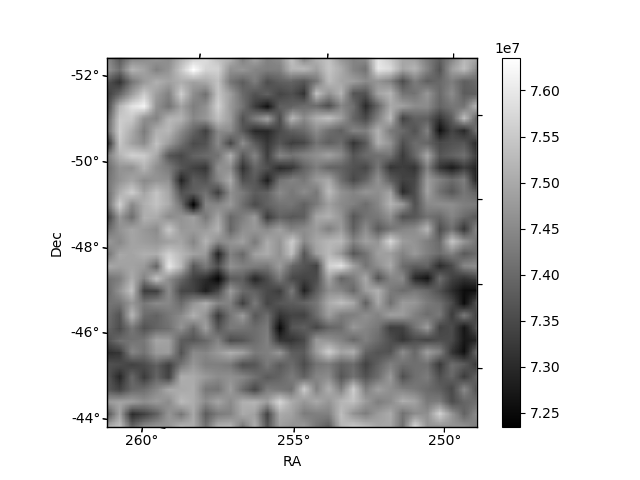
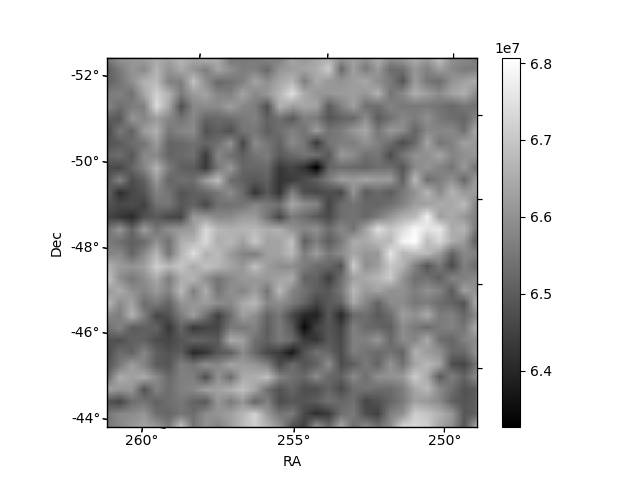
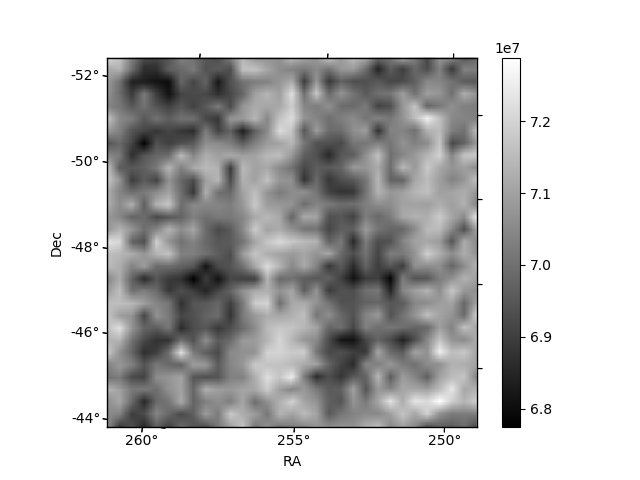
Histogram calculated using DETX and DETY for each event in the final _common_clean file
| Quadrant A | 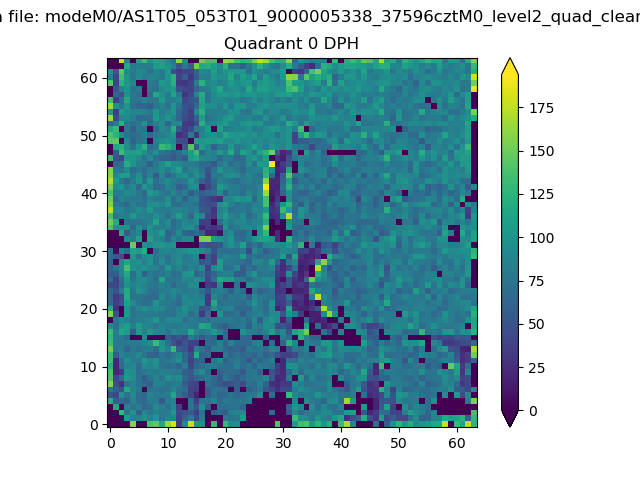 |
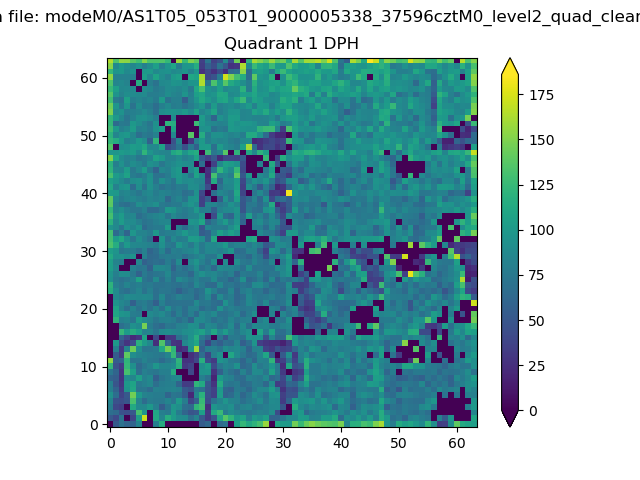 |
Quadrant B |
|---|---|---|---|
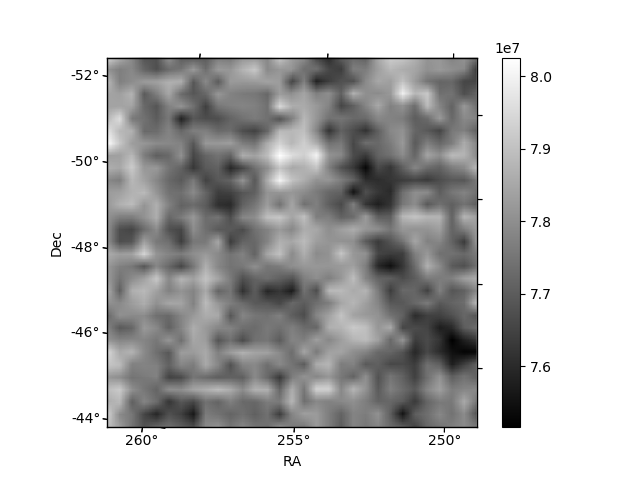
| Quadrant D | 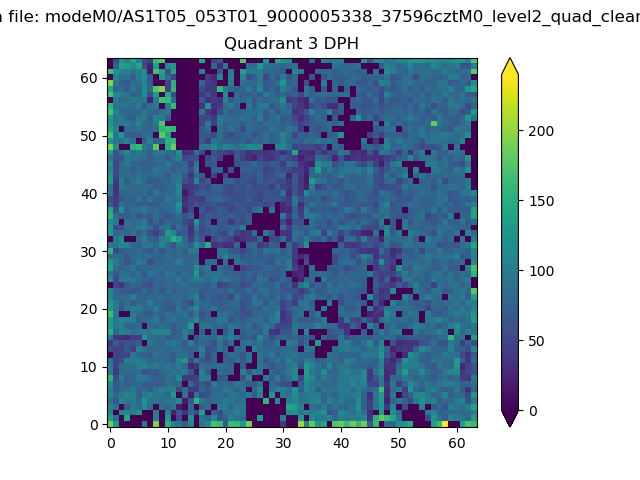 |
 |
Quadrant C |
| Plot type | Count rate plots | Images |
|---|---|---|
| Comparison with Poisson distribution Blue bars denote a histogram of data divided into 1 sec bins. Red curve is a Poisson curve with rate = median count rate of data. |
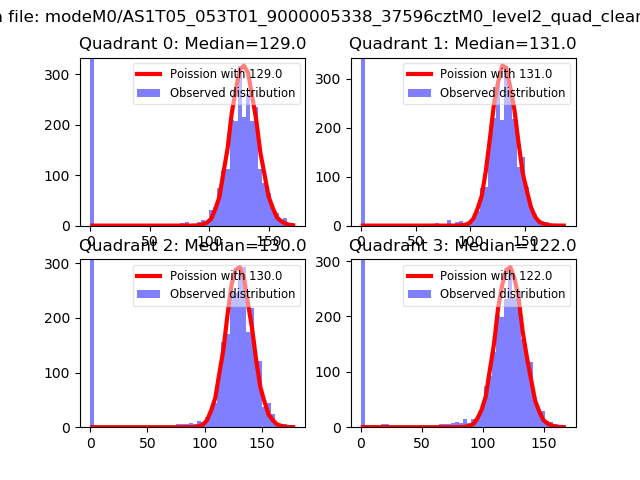 |
 |
| Quadrant-wise count rates Data is divided into 100 sec bins |
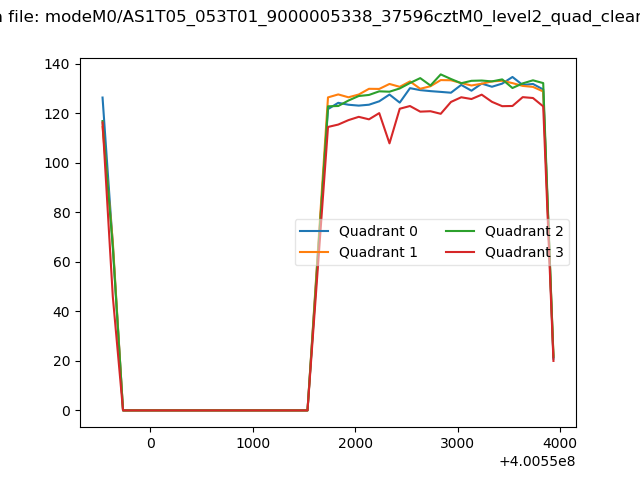 |
|
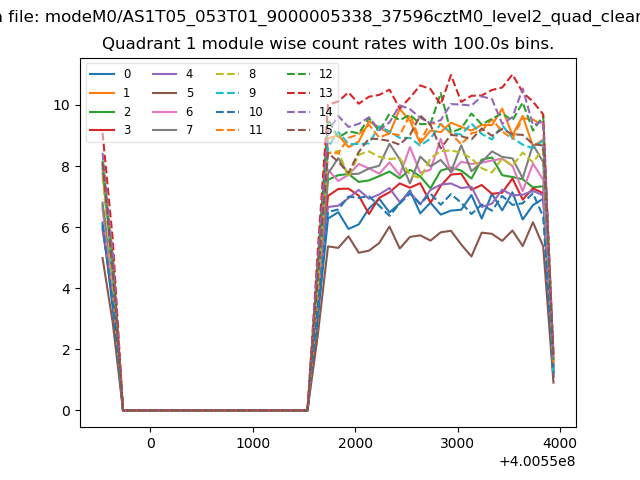
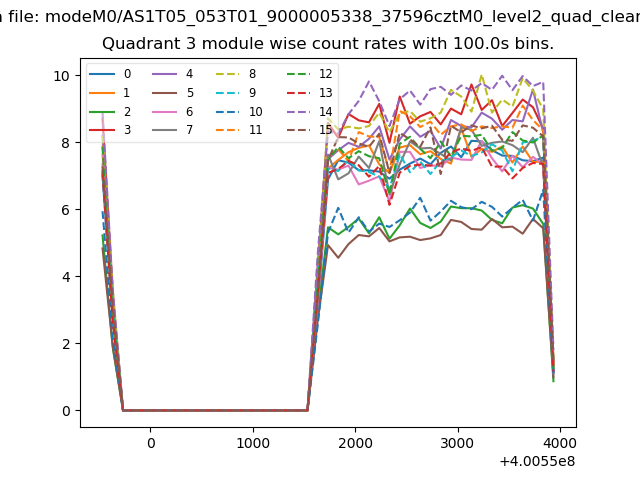
| Module-wise count rates for Quadrant A Data is divided into 100 sec bins |
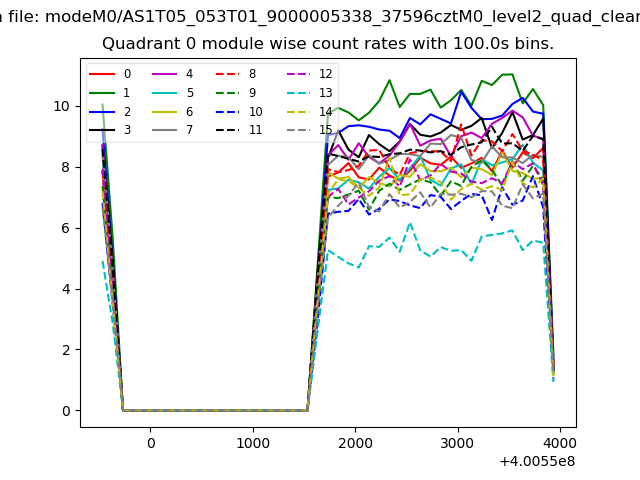 |
 |
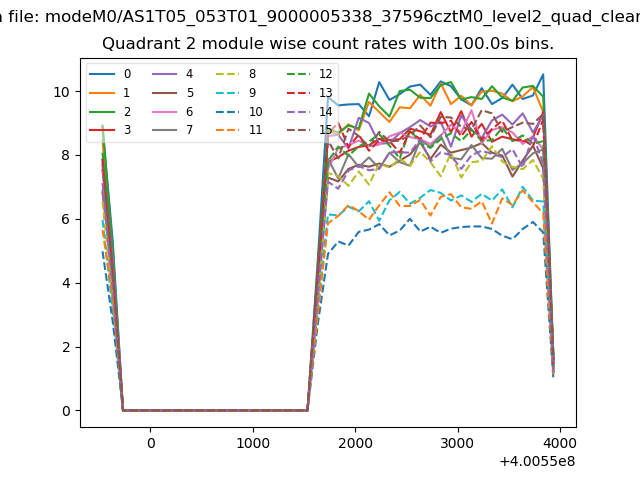
| Module-wise count rates for Quadrant B Data is divided into 100 sec bins |
 |
 |
| Module-wise count rates for Quadrant C Data is divided into 100 sec bins |
 |
 |
| Module-wise count rates for Quadrant D Data is divided into 100 sec bins |
 |
 |
| Parameter | Plot |
|---|---|
| CZT HV Monitor | 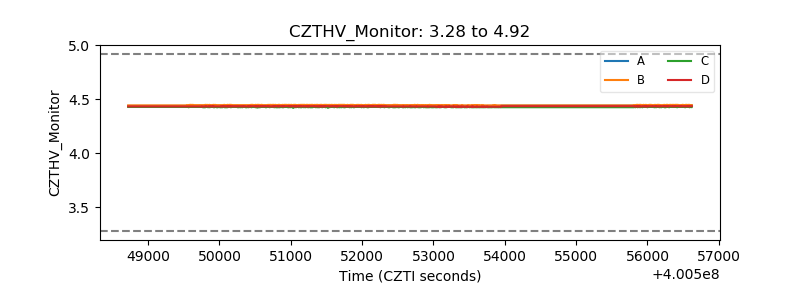 |
| D_VDD | 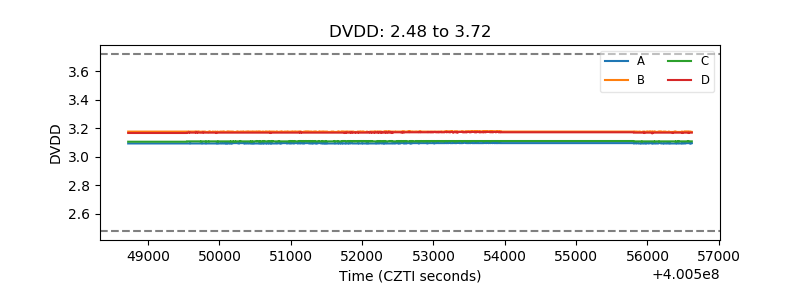 |
| Temperature 1 | 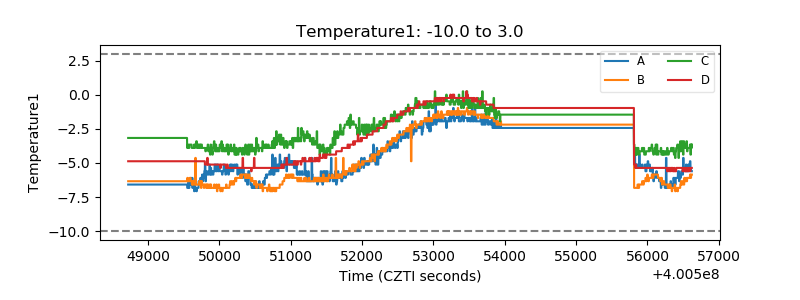 |
| Veto HV Monitor | 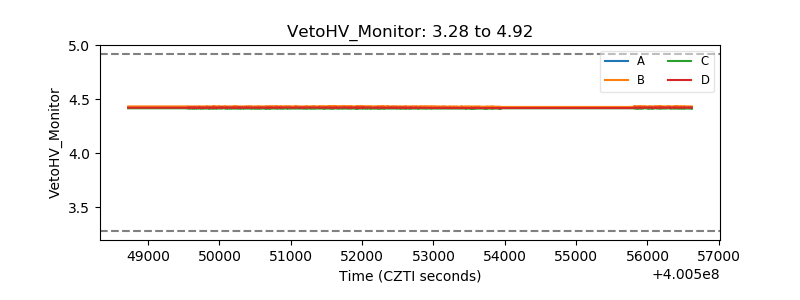 |
| Veto LLD | 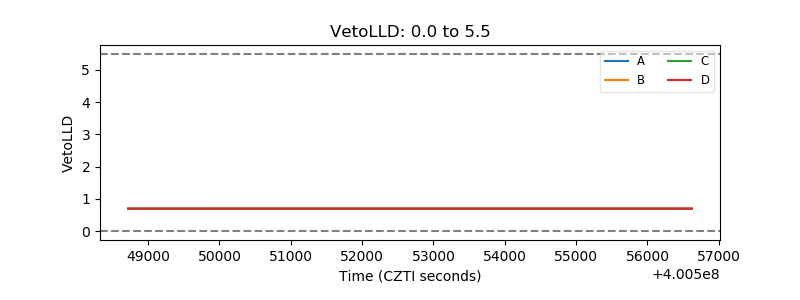 |
| Alpha Counter | 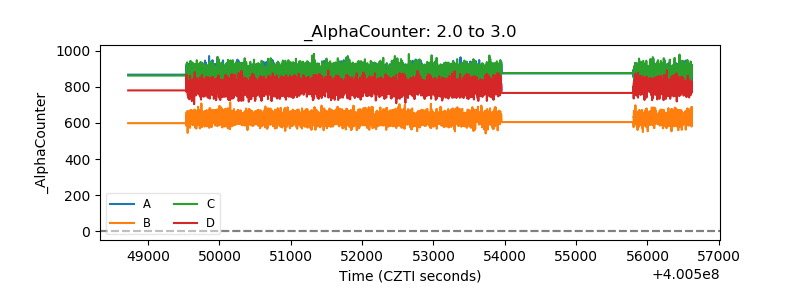 |
| _CPM_Rate | 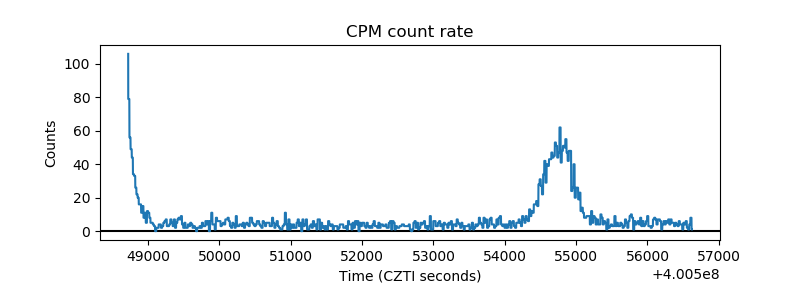 |
| CZT Counter | 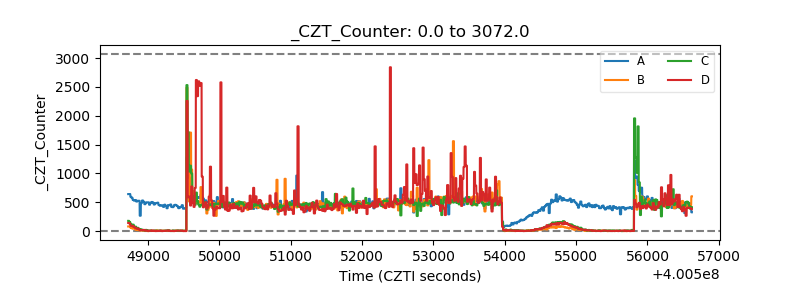 |
| +2.5 Volts monitor | 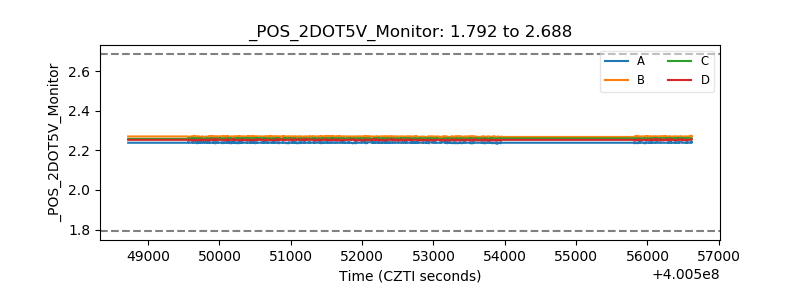 |
| +5 Volts monitor | 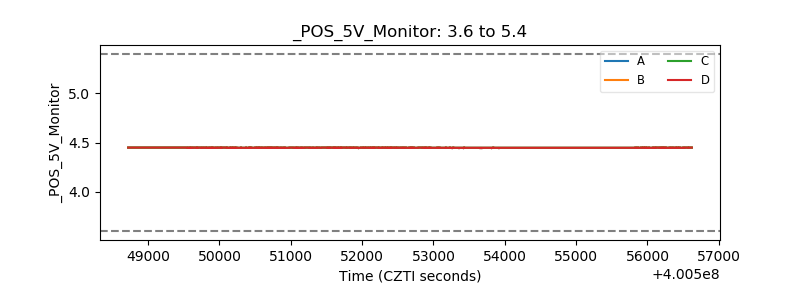 |
| _ROLL_ROT | 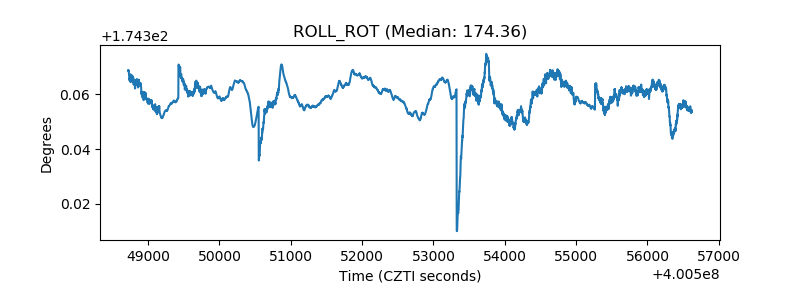 |
| _Roll_DEC | 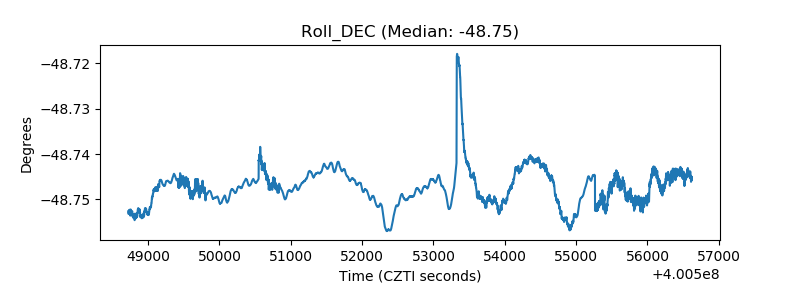 |
| _Roll_RA | 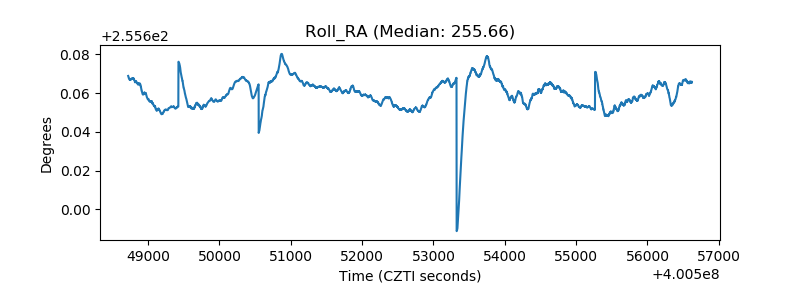 |
| Veto Counter | 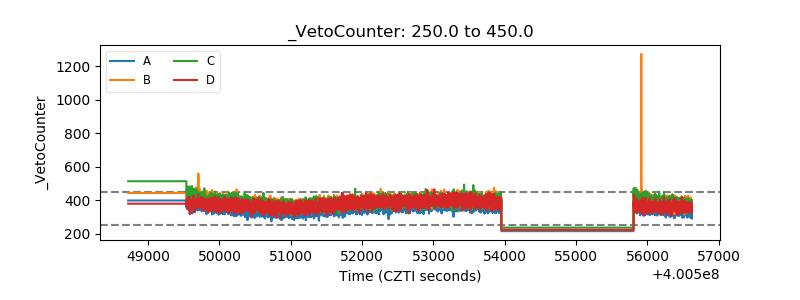 |