| Param | Original file | Final file |
|---|---|---|
| Filename | modeM0/AS1T05_053T01_9000005338_37597cztM0_level2.evt | modeM0/AS1T05_053T01_9000005338_37597cztM0_level2_quad_clean.evt |
| Size (bytes) | 399,830,400 | 62,991,360 |
| Size | 381.3 MB | 60.1 MB |
| Events in quadrant A | 2,861,879 | 380,603 |
| Events in quadrant B | 2,829,075 | 385,514 |
| Events in quadrant C | 2,905,797 | 385,299 |
| Events in quadrant D | 3,126,983 | 359,776 |
| Mode SS | |||
|---|---|---|---|
| Quadrant | BADHDUFLAG | Total packets | Discarded packets |
| A | 0 | 116 | 0 |
| B | 0 | 116 | 0 |
| C | 0 | 116 | 0 |
| D | 0 | 116 | 0 |
| Mode M0 | |||
|---|---|---|---|
| Quadrant | BADHDUFLAG | Total packets | Discarded packets |
| A | 0 | 11854 | 3 |
| B | 0 | 12037 | 2 |
| C | 0 | 12065 | 2 |
| D | 0 | 13274 | 2 |
| Mode M9 | |||
|---|---|---|---|
| Quadrant | BADHDUFLAG | Total packets | Discarded packets |
| A | 0 | 22 | 0 |
| B | 0 | 22 | 0 |
| C | 0 | 22 | 0 |
| D | 0 | 23 | 0 |
| Quadrant | Total seconds | Saturated seconds | Saturation percentage |
|---|---|---|---|
| A | 5659 | 12 | 0.212052% |
| B | 5659 | 43 | 0.759852% |
| C | 5659 | 48 | 0.848206% |
| D | 5659 | 108 | 1.908464% |
Noise dominated data is calculated using 1-second bins in cleaned event files. If a bin has >2000 counts, and if more than 50% of those come from <1% of pixels, then it is considered to be noise-dominated and hence unusable.
| Quadrant | # 1 sec bins | Bins with >0 counts | Bins with >2000 counts | High rate bins dominated by noise | Noise dominated (total time) | Noise dominated (detector-on time) | Marked lightcurve |
|---|---|---|---|---|---|---|---|
| A | 7182 | 5659 | 4 | 4 | 0.06% | 0.07% |  |
| B | 7182 | 5660 | 25 | 25 | 0.35% | 0.44% | 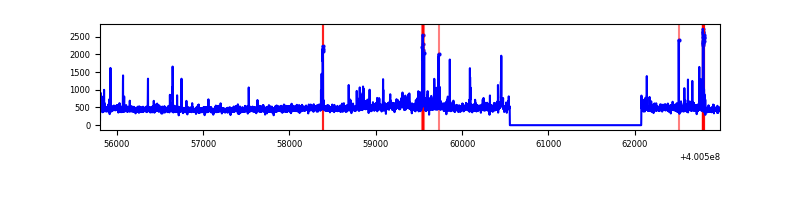 |
| C | 7182 | 5659 | 41 | 41 | 0.57% | 0.72% | 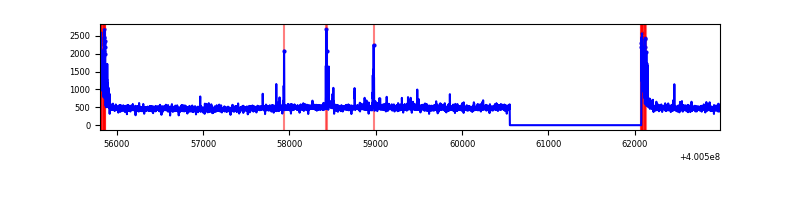 |
| D | 7182 | 5660 | 102 | 102 | 1.42% | 1.80% | 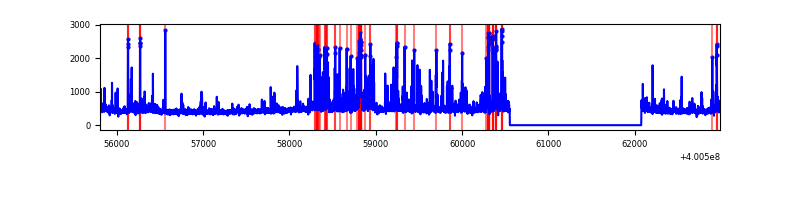 |
Top three noisy pixels from each quadrant. If the there are fewer than three noisy pixels in the level2.evt file, extra rows are filled as -1
| Pixel properties | Quadrant properties | ||||||
|---|---|---|---|---|---|---|---|
| Quadrant | DetID | PixID | Counts | Sigma | Mean | Median | Sigma |
| A | 10 | 83 | 330897 | 2539.41 | 637 | 623 | 130.1 |
| A | 13 | 6 | 22026 | 164.56 | 637 | 623 | 130.1 |
| A | 9 | 143 | 18637 | 138.51 | 637 | 623 | 130.1 |
| B | 5 | 172 | 79444 | 649.37 | 634 | 617 | 121.4 |
| B | 0 | 230 | 69788 | 569.82 | 634 | 617 | 121.4 |
| B | 5 | 255 | 47462 | 385.9 | 634 | 617 | 121.4 |
| C | 15 | 214 | 247872 | 1715.74 | 618 | 621 | 144.1 |
| C | 0 | 10 | 178990 | 1237.75 | 618 | 621 | 144.1 |
| C | 14 | 254 | 42005 | 287.18 | 618 | 621 | 144.1 |
| D | 2 | 249 | 241658 | 1602.6 | 613 | 596 | 150.4 |
| D | 1 | 47 | 174833 | 1158.34 | 613 | 596 | 150.4 |
| D | 12 | 233 | 84807 | 559.84 | 613 | 596 | 150.4 |
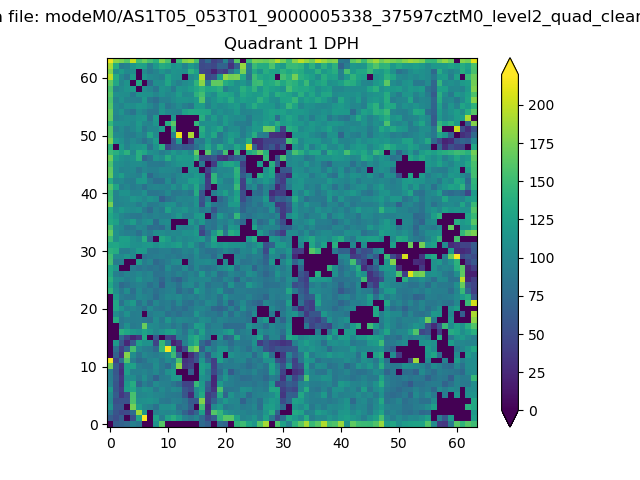
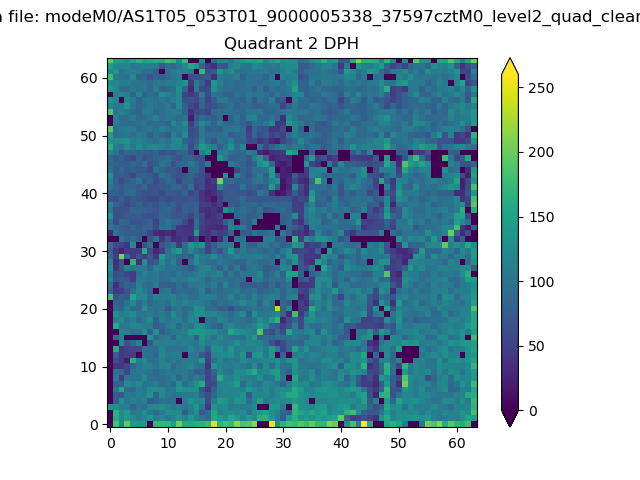
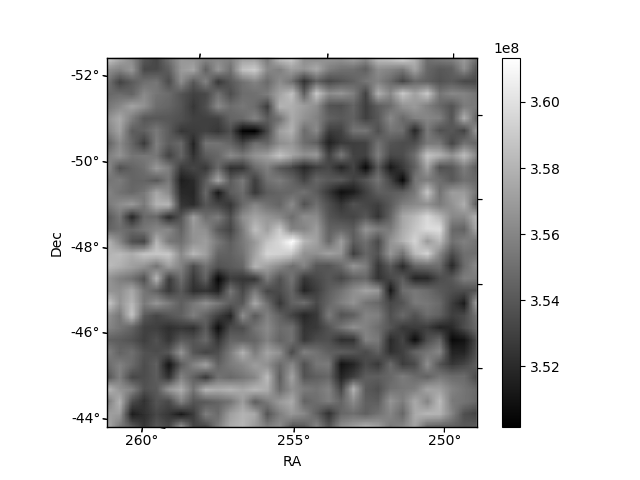
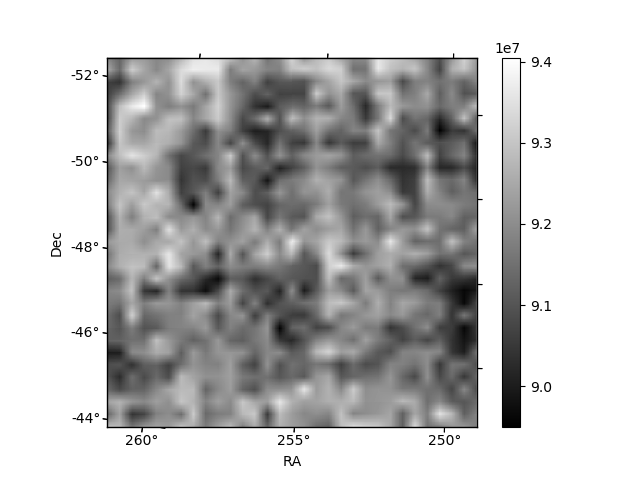
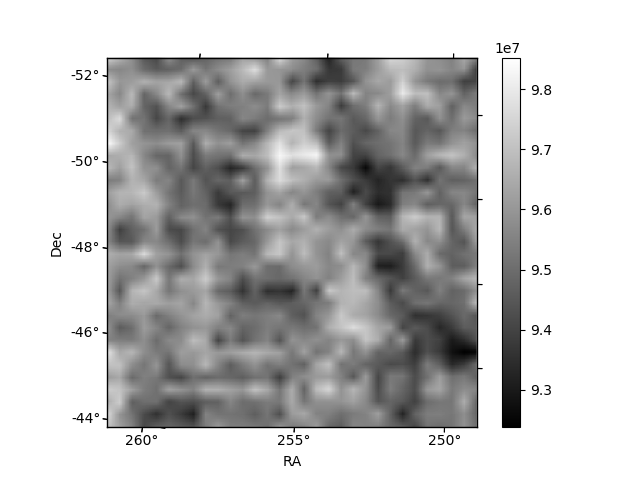
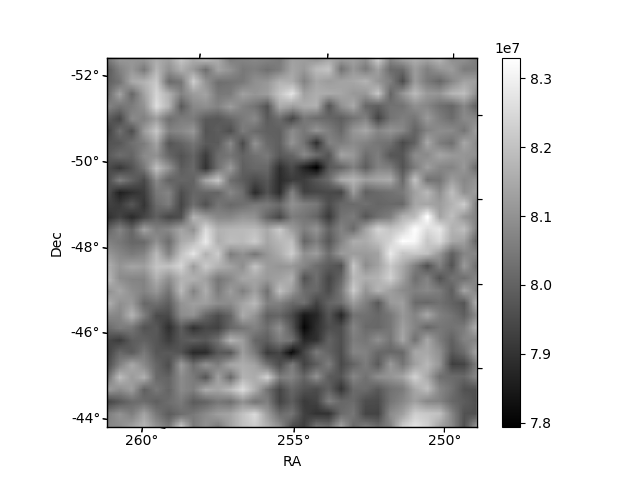
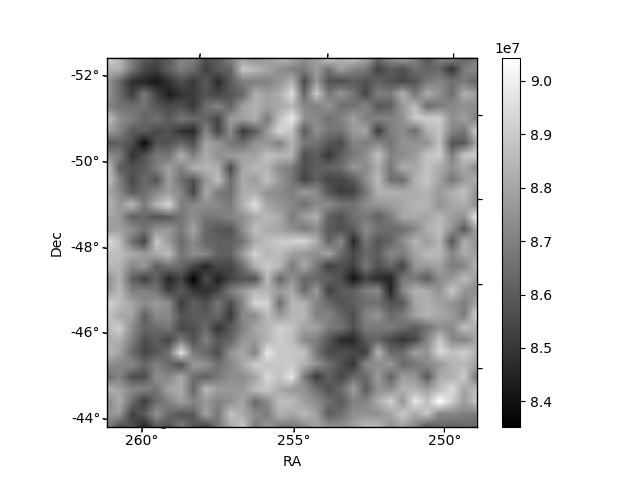
Histogram calculated using DETX and DETY for each event in the final _common_clean file
| Quadrant A | 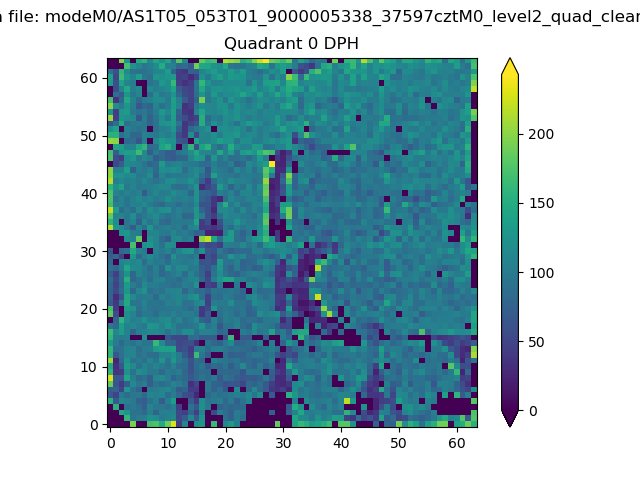 |
 |
Quadrant B |
|---|---|---|---|
| Quadrant D | 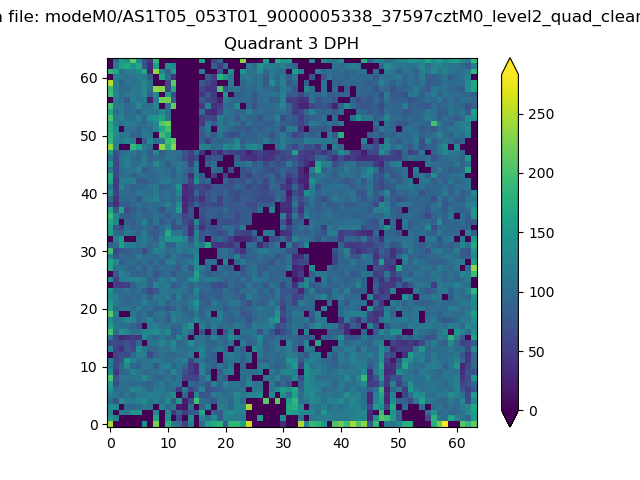 |
 |
Quadrant C |
| Plot type | Count rate plots | Images |
|---|---|---|
| Comparison with Poisson distribution Blue bars denote a histogram of data divided into 1 sec bins. Red curve is a Poisson curve with rate = median count rate of data. |
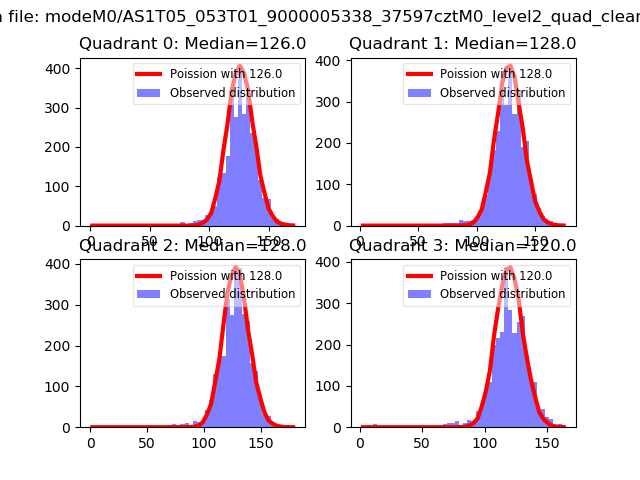 |
 |
| Quadrant-wise count rates Data is divided into 100 sec bins |
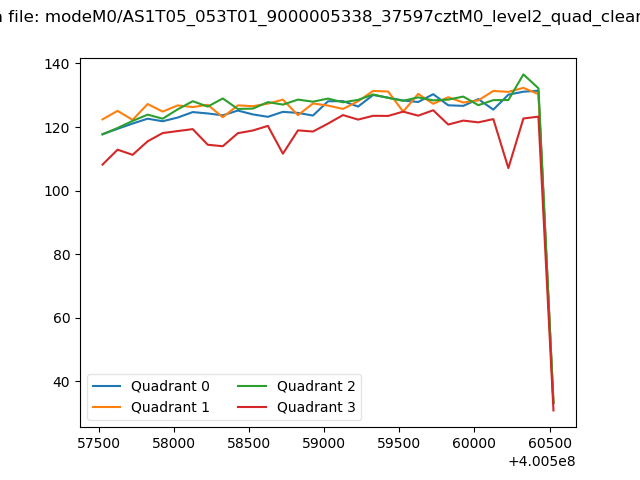 |
|
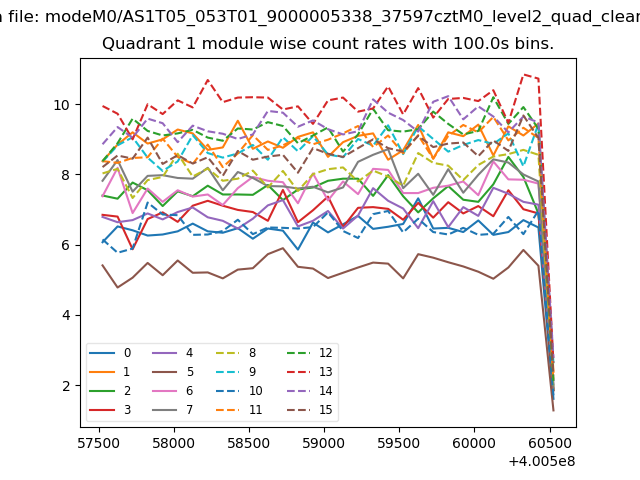
| Module-wise count rates for Quadrant A Data is divided into 100 sec bins |
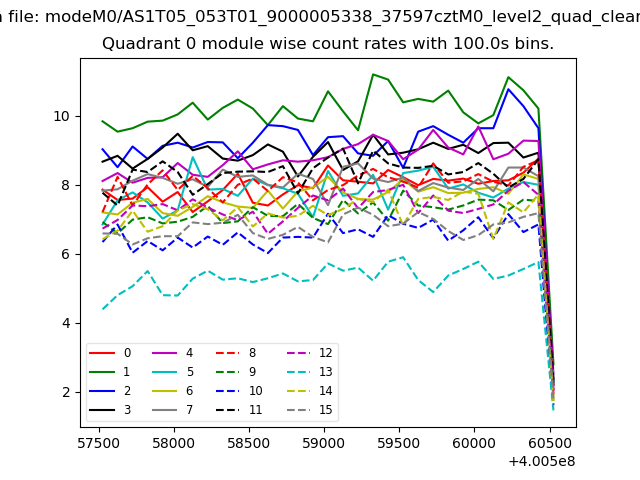 |
 |
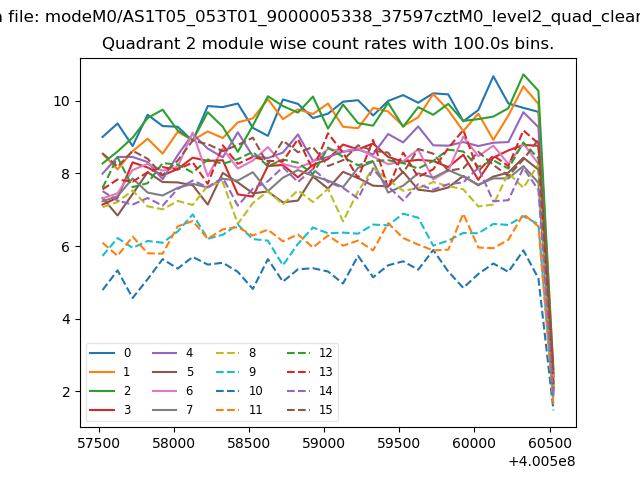
| Module-wise count rates for Quadrant B Data is divided into 100 sec bins |
 |
 |
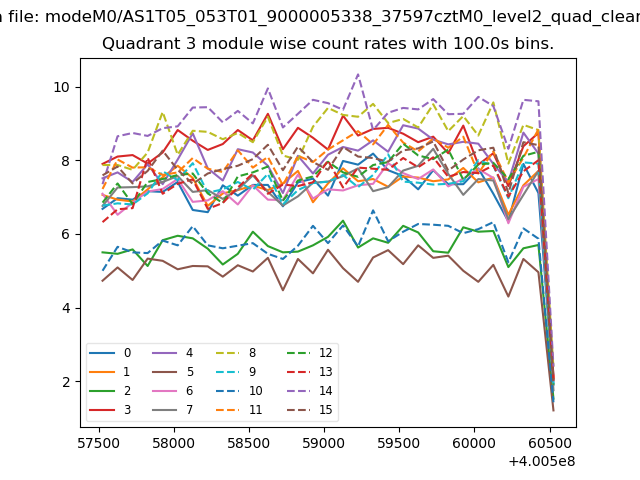
| Module-wise count rates for Quadrant C Data is divided into 100 sec bins |
 |
 |
| Module-wise count rates for Quadrant D Data is divided into 100 sec bins |
 |
 |
| Parameter | Plot |
|---|---|
| CZT HV Monitor | 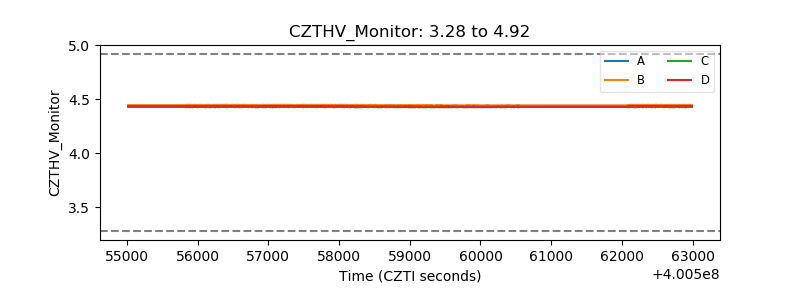 |
| D_VDD | 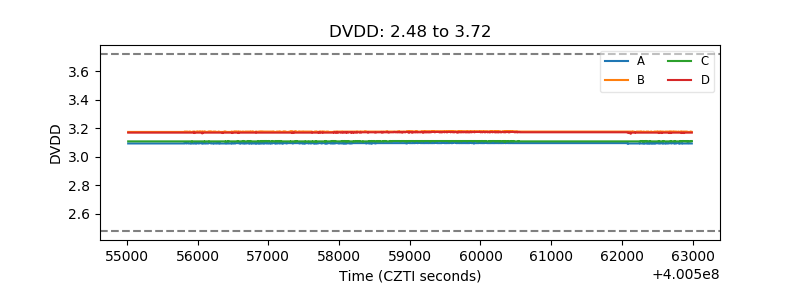 |
| Temperature 1 | 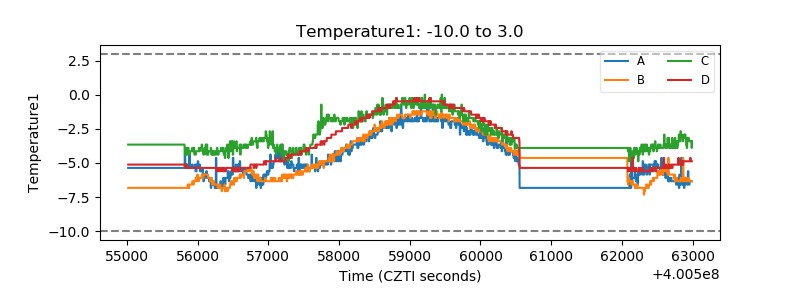 |
| Veto HV Monitor | 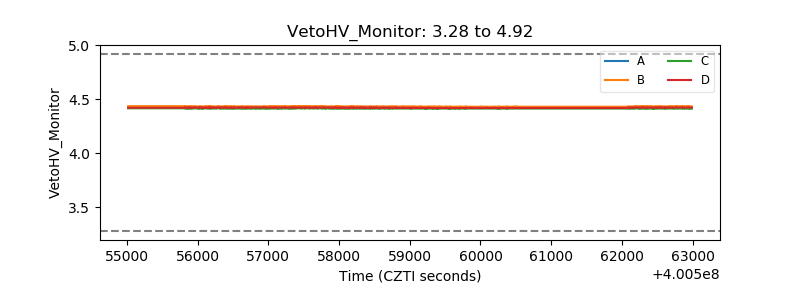 |
| Veto LLD | 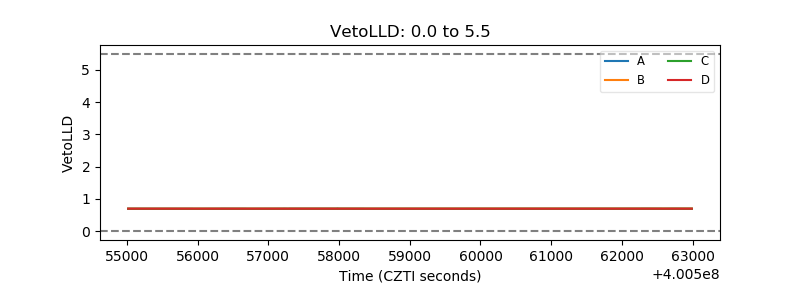 |
| Alpha Counter | 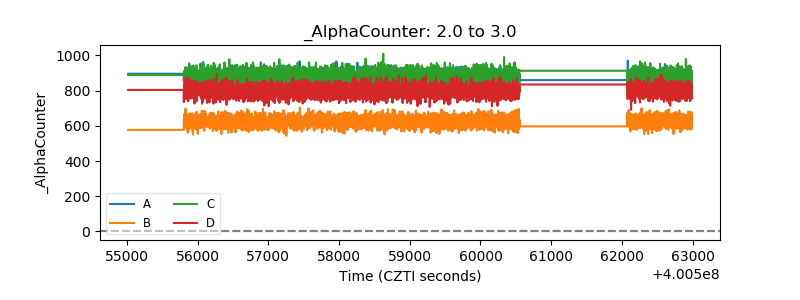 |
| _CPM_Rate | 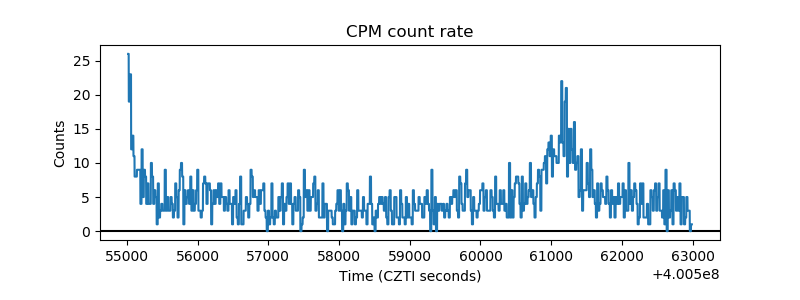 |
| CZT Counter | 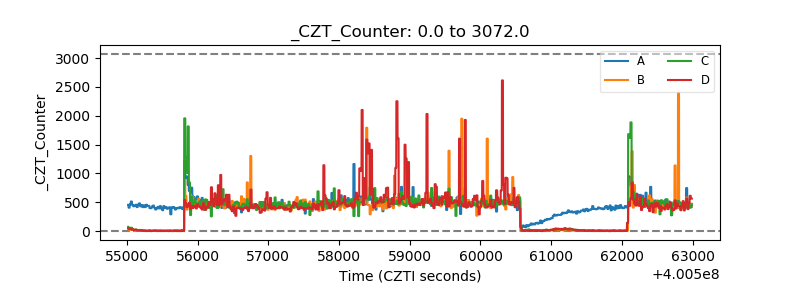 |
| +2.5 Volts monitor | 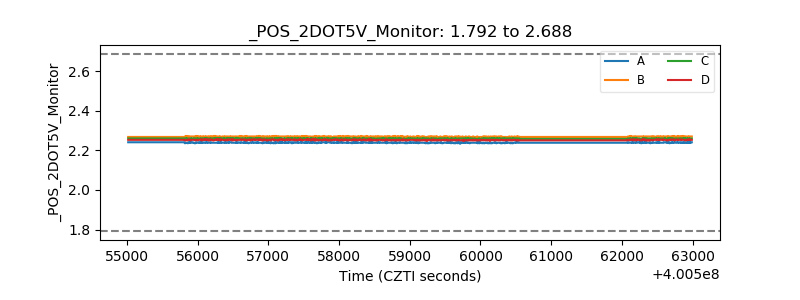 |
| +5 Volts monitor | 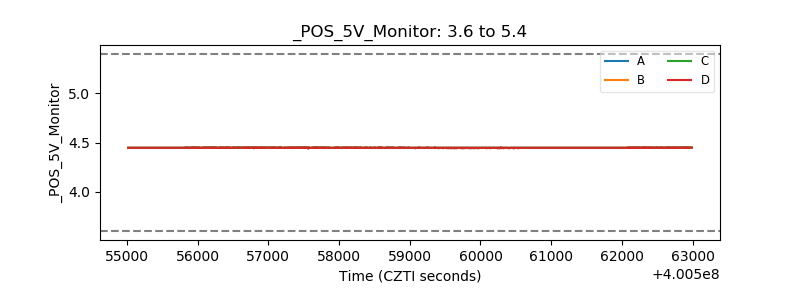 |
| _ROLL_ROT | 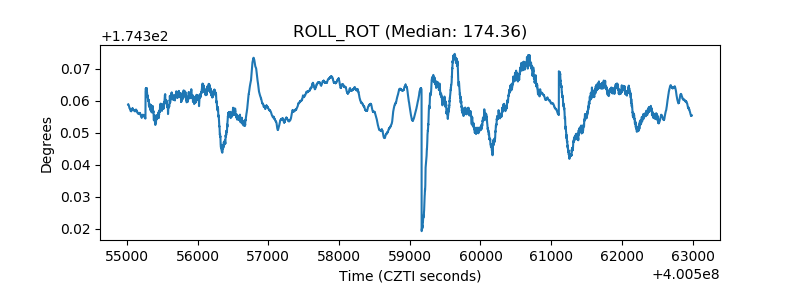 |
| _Roll_DEC | 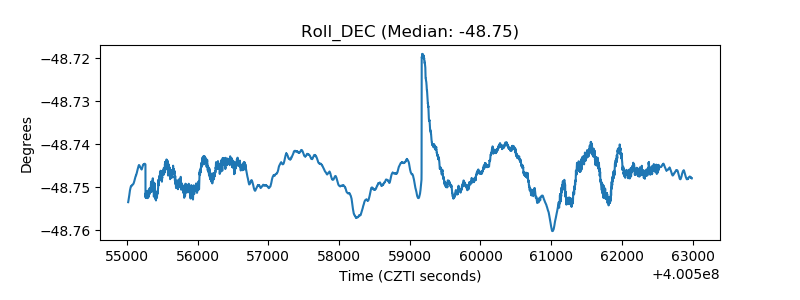 |
| _Roll_RA | 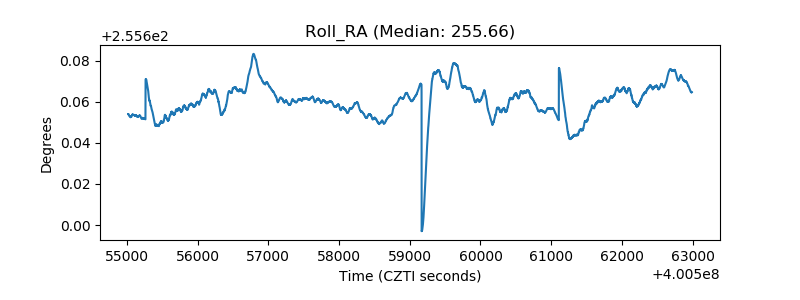 |
| Veto Counter | 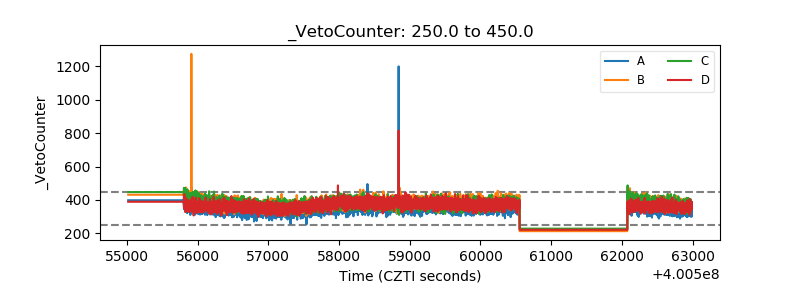 |