| Param | Original file | Final file |
|---|---|---|
| Filename | modeM0/AS1T05_053T01_9000005338_37598cztM0_level2.evt | modeM0/AS1T05_053T01_9000005338_37598cztM0_level2_quad_clean.evt |
| Size (bytes) | 449,452,800 | 73,327,680 |
| Size | 428.6 MB | 69.9 MB |
| Events in quadrant A | 2,940,465 | 457,940 |
| Events in quadrant B | 3,329,737 | 456,426 |
| Events in quadrant C | 3,038,727 | 463,738 |
| Events in quadrant D | 3,904,182 | 432,429 |
| Mode SS | |||
|---|---|---|---|
| Quadrant | BADHDUFLAG | Total packets | Discarded packets |
| A | 0 | 118 | 0 |
| B | 0 | 118 | 0 |
| C | 0 | 118 | 0 |
| D | 0 | 118 | 0 |
| Mode M0 | |||
|---|---|---|---|
| Quadrant | BADHDUFLAG | Total packets | Discarded packets |
| A | 0 | 12236 | 3 |
| B | 0 | 13661 | 2 |
| C | 0 | 12534 | 2 |
| D | 0 | 15633 | 2 |
| Mode M9 | |||
|---|---|---|---|
| Quadrant | BADHDUFLAG | Total packets | Discarded packets |
| A | 0 | 22 | 0 |
| B | 0 | 22 | 0 |
| C | 0 | 22 | 0 |
| D | 0 | 23 | 0 |
| Quadrant | Total seconds | Saturated seconds | Saturation percentage |
|---|---|---|---|
| A | 5870 | 12 | 0.204429% |
| B | 5870 | 142 | 2.419080% |
| C | 5870 | 41 | 0.698467% |
| D | 5870 | 373 | 6.354344% |
Noise dominated data is calculated using 1-second bins in cleaned event files. If a bin has >2000 counts, and if more than 50% of those come from <1% of pixels, then it is considered to be noise-dominated and hence unusable.
| Quadrant | # 1 sec bins | Bins with >0 counts | Bins with >2000 counts | High rate bins dominated by noise | Noise dominated (total time) | Noise dominated (detector-on time) | Marked lightcurve |
|---|---|---|---|---|---|---|---|
| A | 7211 | 5869 | 2 | 2 | 0.03% | 0.03% | 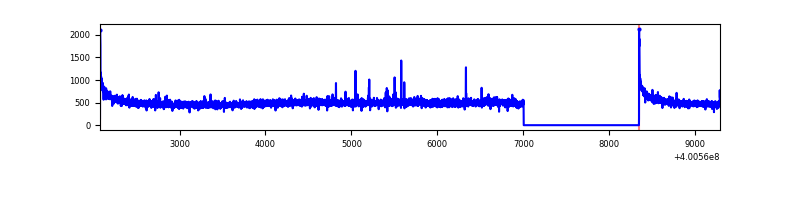 |
| B | 7211 | 5869 | 114 | 114 | 1.58% | 1.94% | 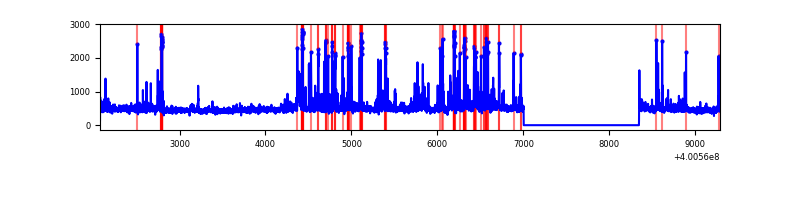 |
| C | 7211 | 5869 | 32 | 32 | 0.44% | 0.55% | 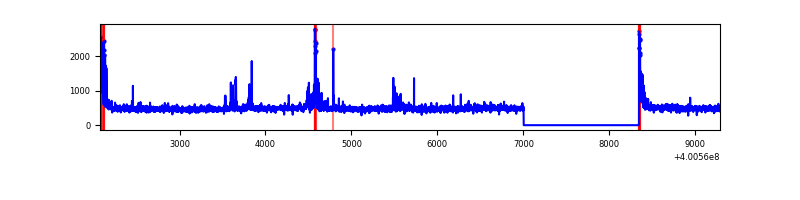 |
| D | 7211 | 5870 | 357 | 357 | 4.95% | 6.08% | 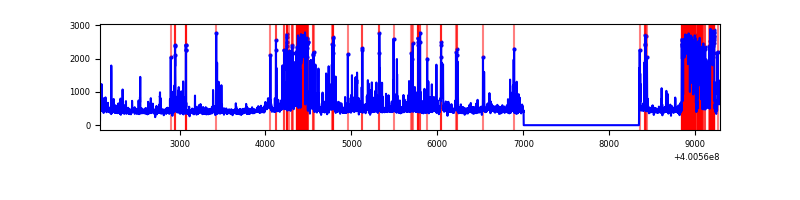 |
Top three noisy pixels from each quadrant. If the there are fewer than three noisy pixels in the level2.evt file, extra rows are filled as -1
| Pixel properties | Quadrant properties | ||||||
|---|---|---|---|---|---|---|---|
| Quadrant | DetID | PixID | Counts | Sigma | Mean | Median | Sigma |
| A | 10 | 83 | 340639 | 2507.11 | 661 | 646 | 135.6 |
| A | 9 | 143 | 20554 | 146.8 | 661 | 646 | 135.6 |
| A | 13 | 6 | 11519 | 80.18 | 661 | 646 | 135.6 |
| B | 5 | 172 | 309078 | 2441.91 | 655 | 639 | 126.3 |
| B | 5 | 255 | 192629 | 1519.98 | 655 | 639 | 126.3 |
| B | 5 | 200 | 67470 | 529.1 | 655 | 639 | 126.3 |
| C | 15 | 214 | 257211 | 1709.98 | 645 | 651 | 150.0 |
| C | 0 | 10 | 129879 | 861.31 | 645 | 651 | 150.0 |
| C | 12 | 249 | 95504 | 632.2 | 645 | 651 | 150.0 |
| D | 2 | 250 | 615684 | 3992.59 | 622 | 601 | 154.1 |
| D | 10 | 253 | 257713 | 1668.95 | 622 | 601 | 154.1 |
| D | 2 | 249 | 210005 | 1359.27 | 622 | 601 | 154.1 |
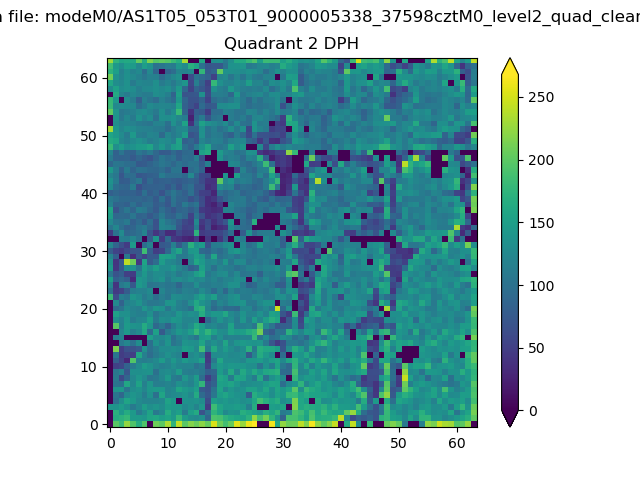
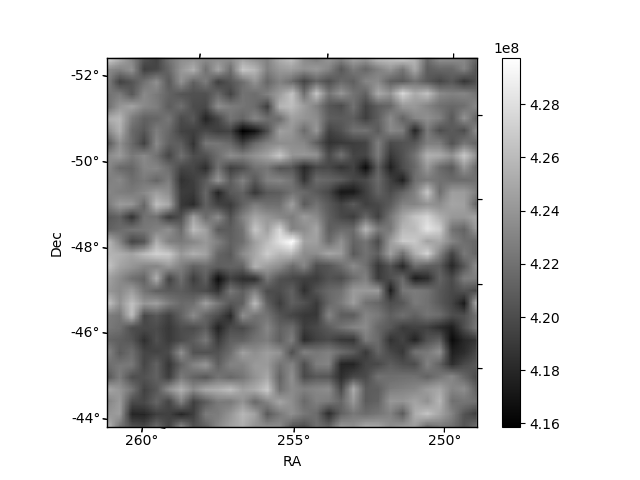
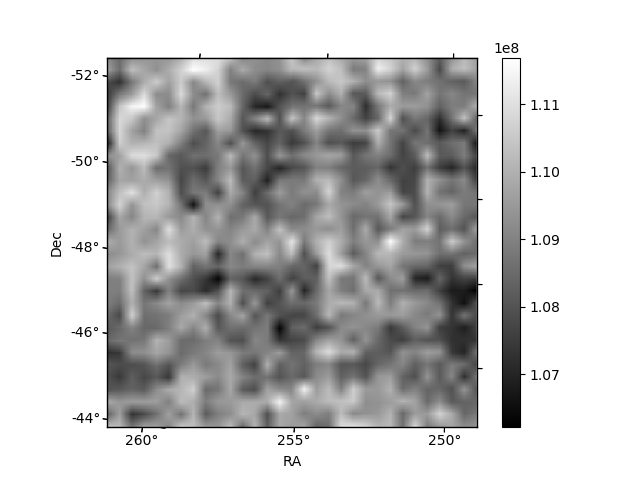
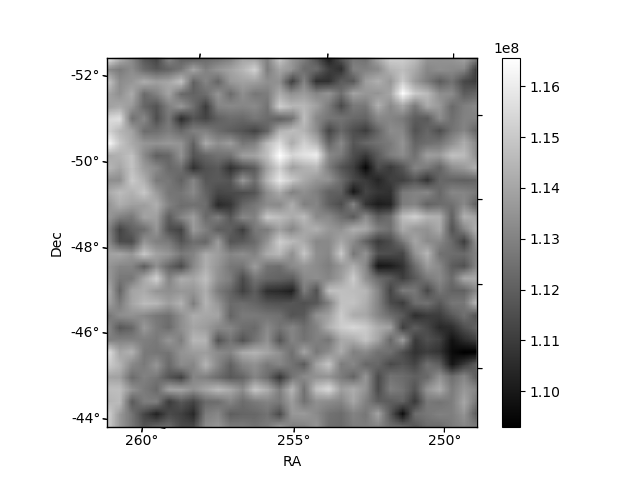
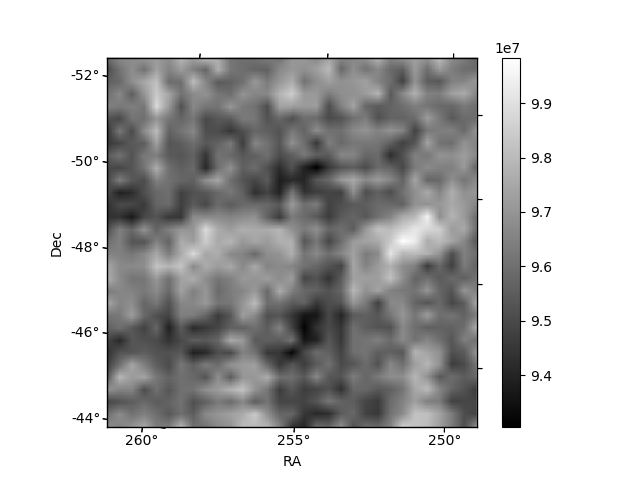
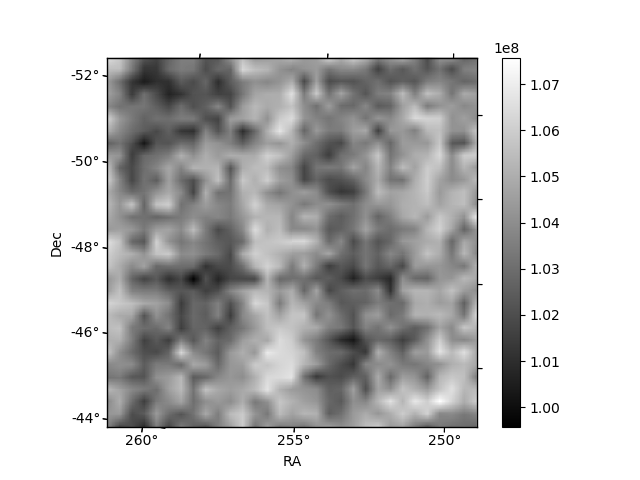
Histogram calculated using DETX and DETY for each event in the final _common_clean file
| Quadrant A | 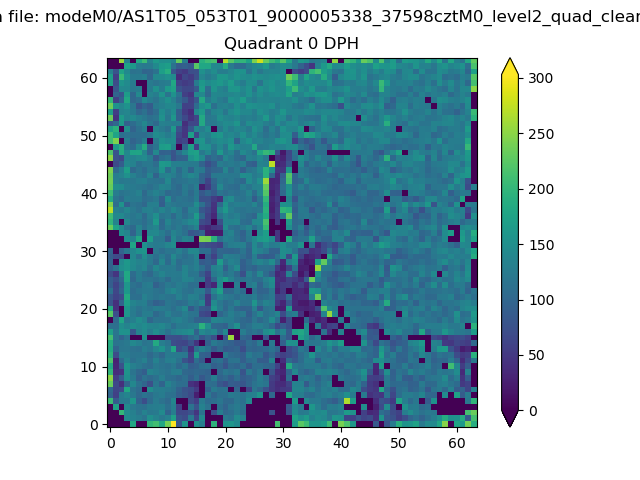 |
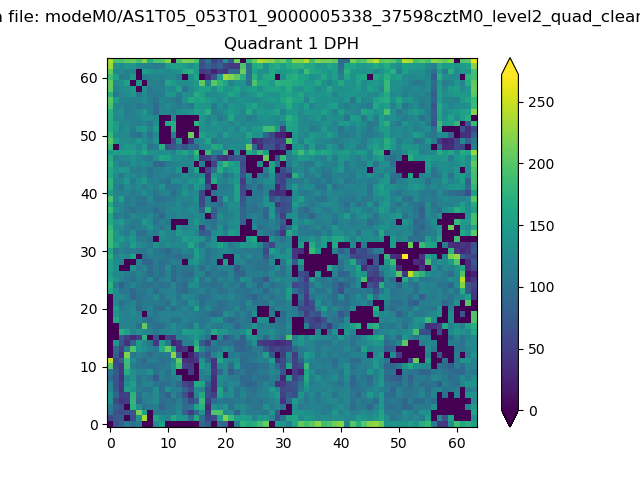 |
Quadrant B |
|---|---|---|---|
| Quadrant D | 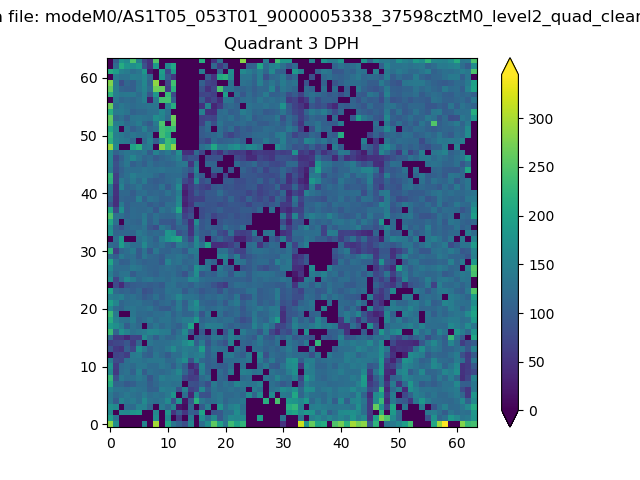 |
 |
Quadrant C |
| Plot type | Count rate plots | Images |
|---|---|---|
| Comparison with Poisson distribution Blue bars denote a histogram of data divided into 1 sec bins. Red curve is a Poisson curve with rate = median count rate of data. |
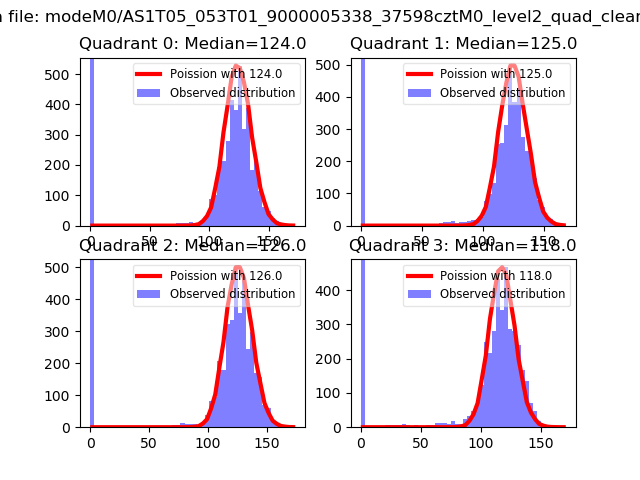 |
 |
| Quadrant-wise count rates Data is divided into 100 sec bins |
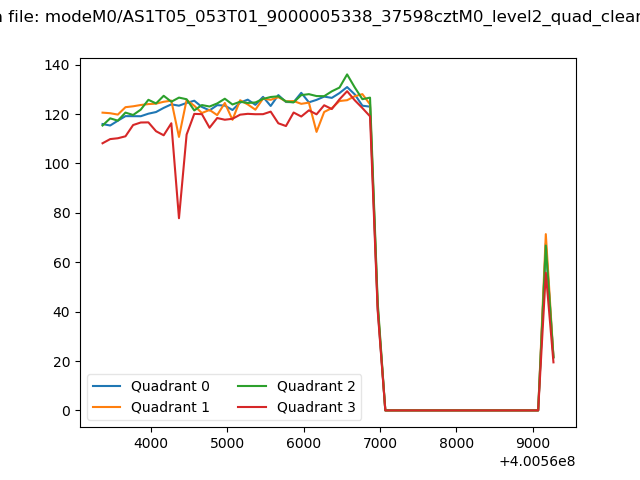 |
|
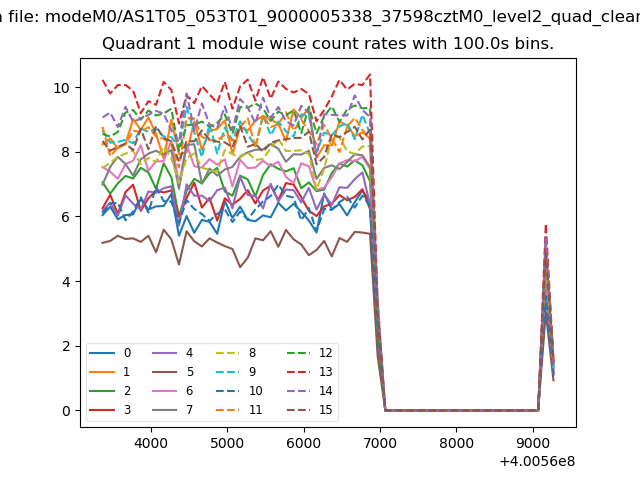
| Module-wise count rates for Quadrant A Data is divided into 100 sec bins |
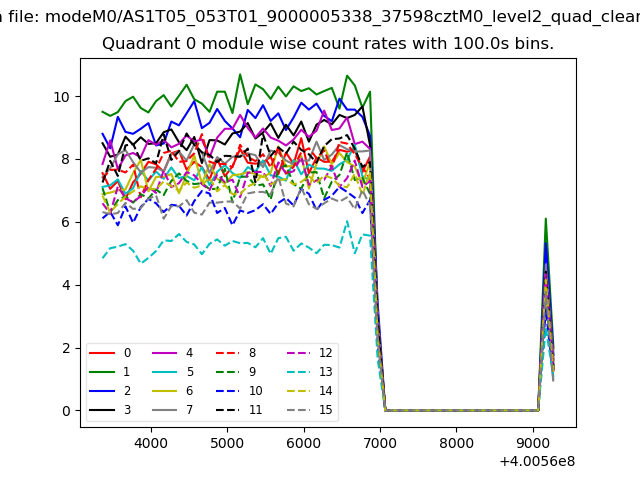 |
 |
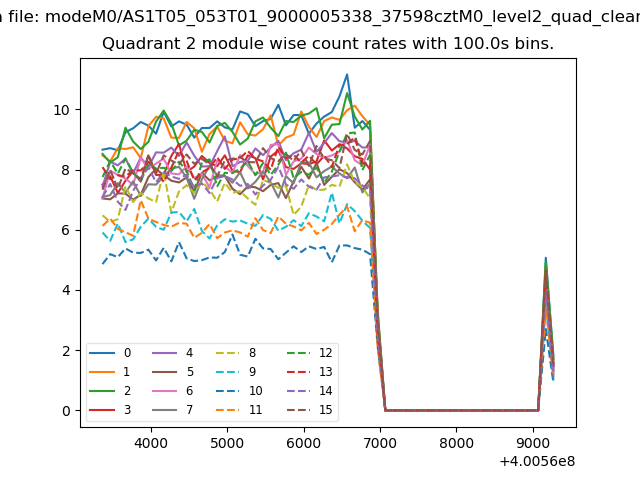
| Module-wise count rates for Quadrant B Data is divided into 100 sec bins |
 |
 |
| Module-wise count rates for Quadrant C Data is divided into 100 sec bins |
 |
 |
| Module-wise count rates for Quadrant D Data is divided into 100 sec bins |
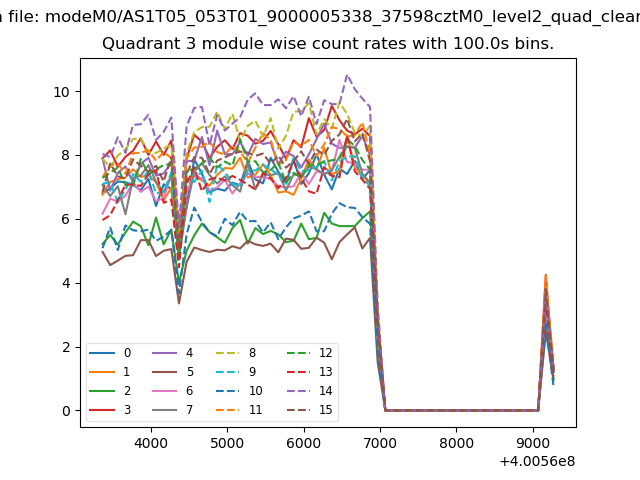 |
 |
| Parameter | Plot |
|---|---|
| CZT HV Monitor | 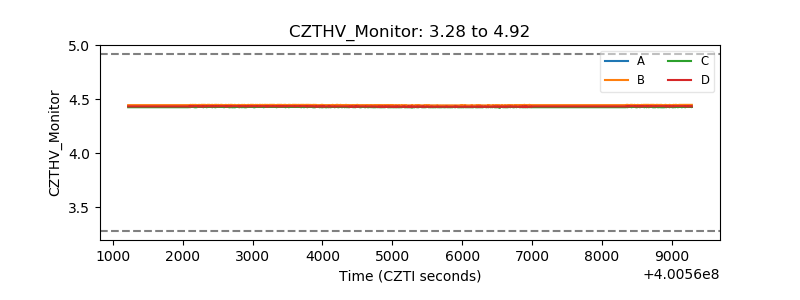 |
| D_VDD | 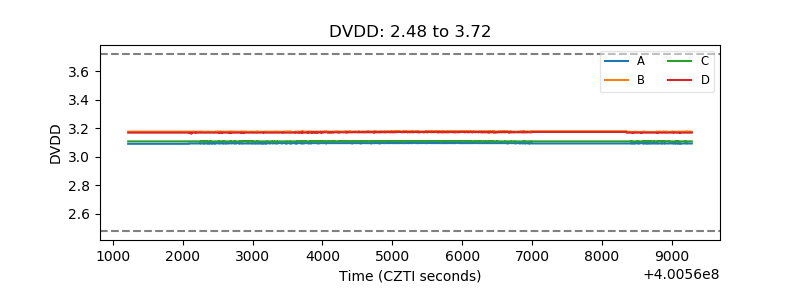 |
| Temperature 1 | 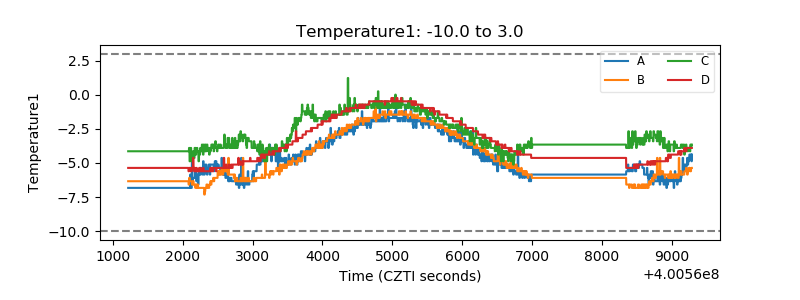 |
| Veto HV Monitor | 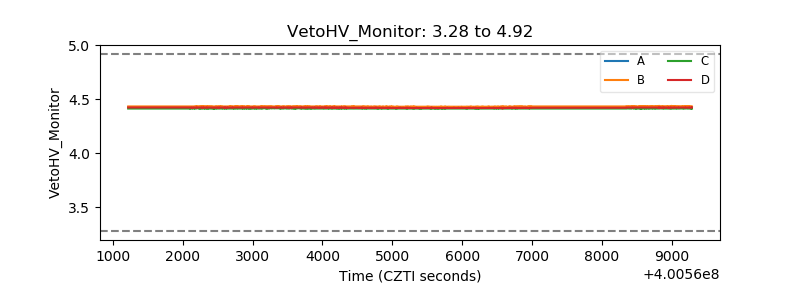 |
| Veto LLD | 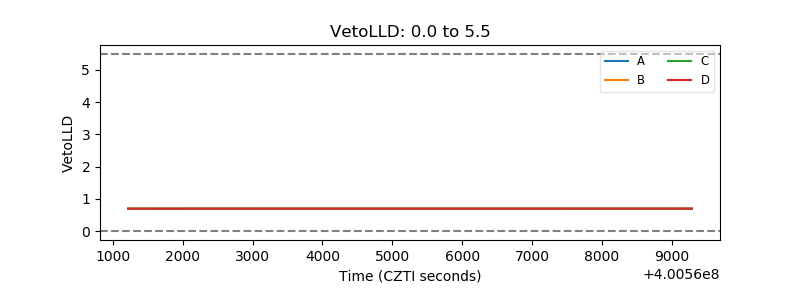 |
| Alpha Counter | 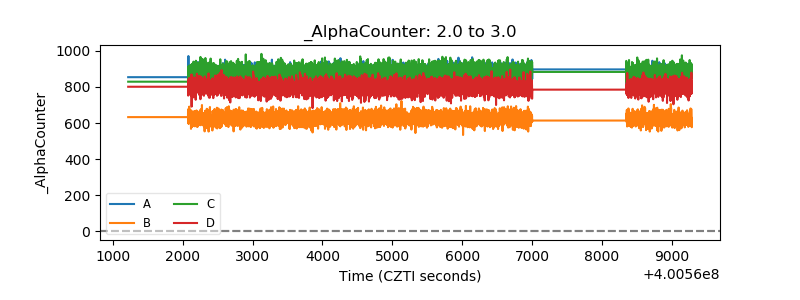 |
| _CPM_Rate | 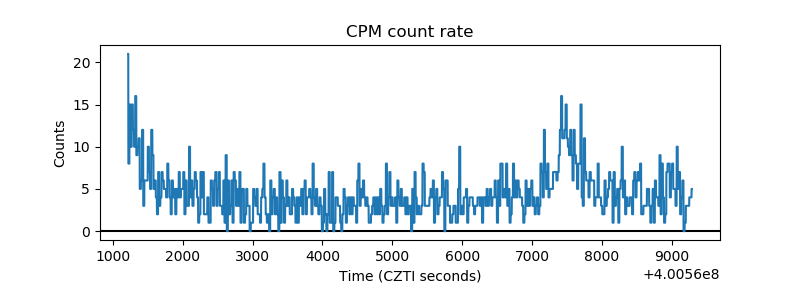 |
| CZT Counter | 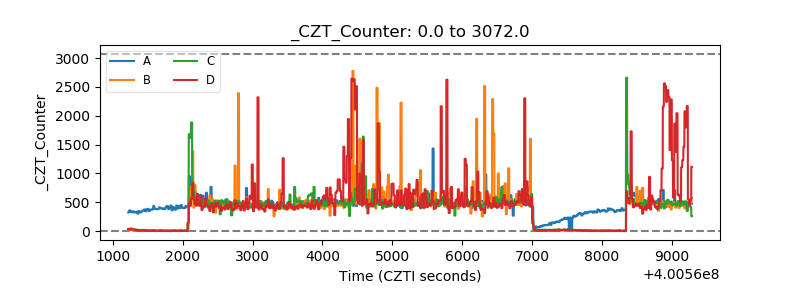 |
| +2.5 Volts monitor | 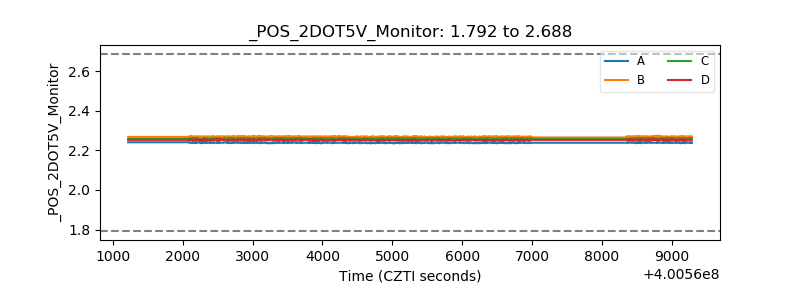 |
| +5 Volts monitor | 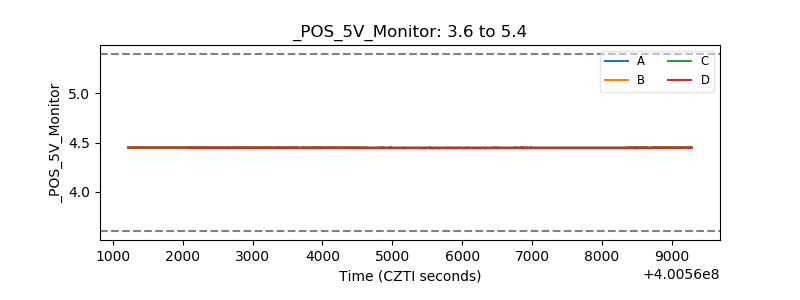 |
| _ROLL_ROT | 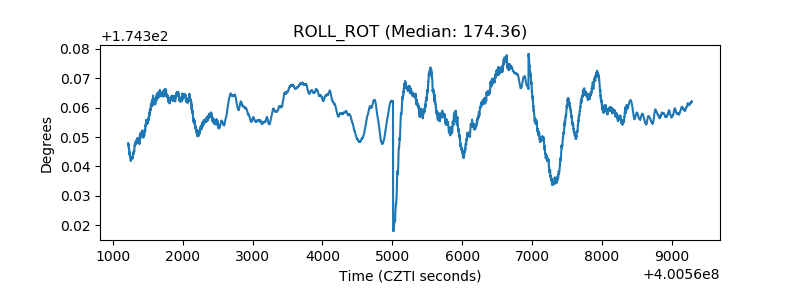 |
| _Roll_DEC | 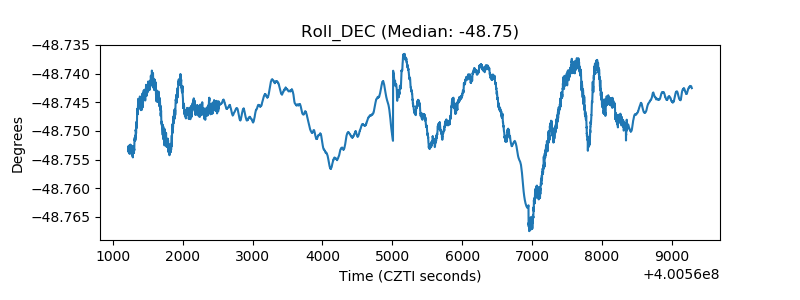 |
| _Roll_RA | 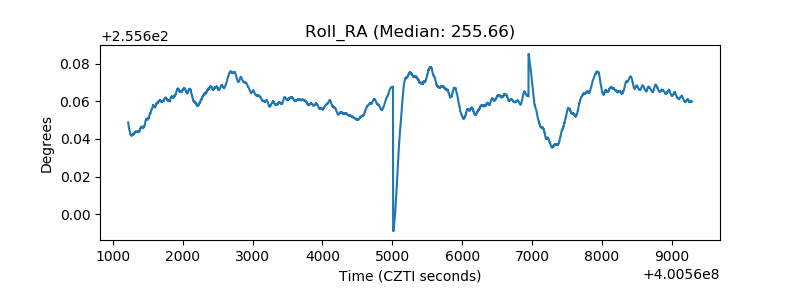 |
| Veto Counter | 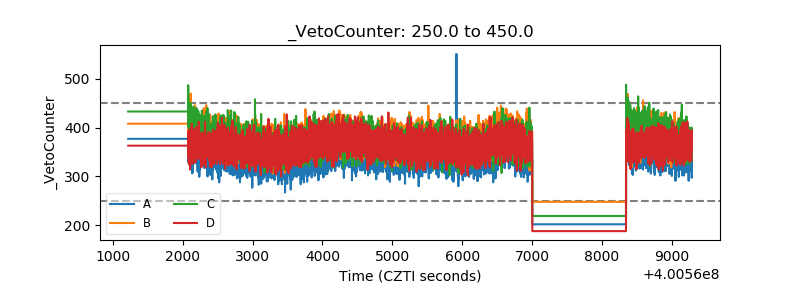 |