| Param | Original file | Final file |
|---|---|---|
| Filename | modeM0/AS1T05_053T01_9000005338_37599cztM0_level2.evt | modeM0/AS1T05_053T01_9000005338_37599cztM0_level2_quad_clean.evt |
| Size (bytes) | 457,084,800 | 84,265,920 |
| Size | 435.9 MB | 80.4 MB |
| Events in quadrant A | 3,000,900 | 538,423 |
| Events in quadrant B | 3,552,434 | 536,274 |
| Events in quadrant C | 2,935,449 | 547,254 |
| Events in quadrant D | 3,949,417 | 513,772 |
| Mode SS | |||
|---|---|---|---|
| Quadrant | BADHDUFLAG | Total packets | Discarded packets |
| A | 0 | 120 | 0 |
| B | 0 | 120 | 0 |
| C | 0 | 120 | 0 |
| D | 0 | 120 | 0 |
| Mode M0 | |||
|---|---|---|---|
| Quadrant | BADHDUFLAG | Total packets | Discarded packets |
| A | 0 | 12443 | 3 |
| B | 0 | 14383 | 2 |
| C | 0 | 12265 | 2 |
| D | 0 | 15677 | 2 |
| Mode M9 | |||
|---|---|---|---|
| Quadrant | BADHDUFLAG | Total packets | Discarded packets |
| A | 0 | 24 | 0 |
| B | 0 | 24 | 0 |
| C | 0 | 24 | 0 |
| D | 0 | 25 | 0 |
| Quadrant | Total seconds | Saturated seconds | Saturation percentage |
|---|---|---|---|
| A | 5959 | 7 | 0.117469% |
| B | 5959 | 190 | 3.188454% |
| C | 5959 | 15 | 0.251720% |
| D | 5959 | 318 | 5.336466% |
Noise dominated data is calculated using 1-second bins in cleaned event files. If a bin has >2000 counts, and if more than 50% of those come from <1% of pixels, then it is considered to be noise-dominated and hence unusable.
| Quadrant | # 1 sec bins | Bins with >0 counts | Bins with >2000 counts | High rate bins dominated by noise | Noise dominated (total time) | Noise dominated (detector-on time) | Marked lightcurve |
|---|---|---|---|---|---|---|---|
| A | 7271 | 5959 | 3 | 3 | 0.04% | 0.05% | 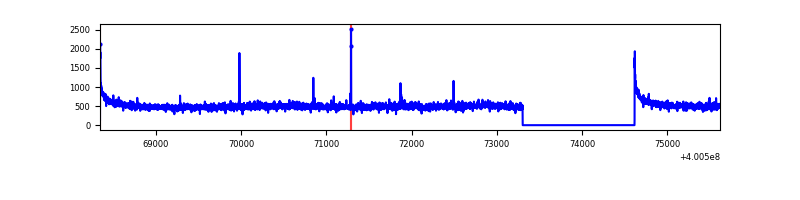 |
| B | 7271 | 5958 | 159 | 159 | 2.19% | 2.67% | 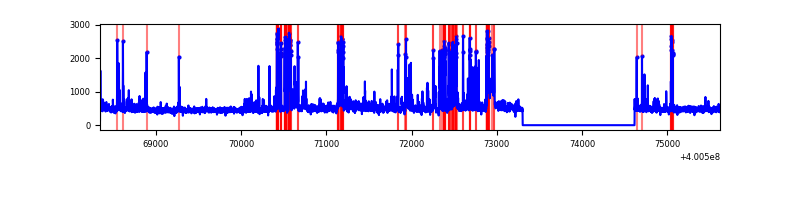 |
| C | 7271 | 5959 | 8 | 8 | 0.11% | 0.13% | 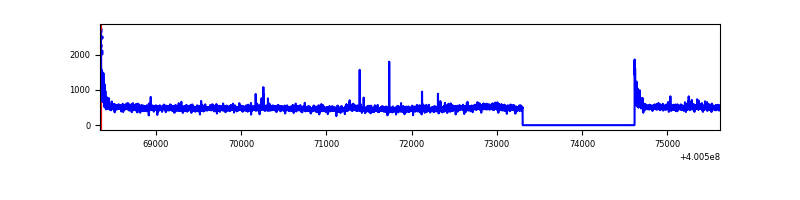 |
| D | 7271 | 5958 | 303 | 303 | 4.17% | 5.09% | 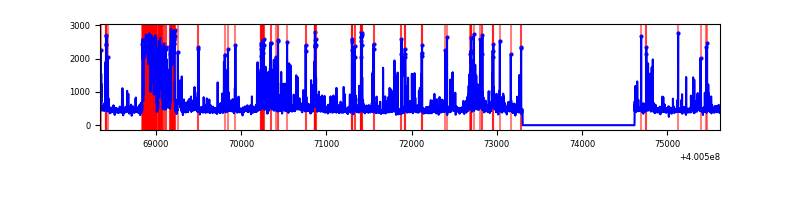 |
Top three noisy pixels from each quadrant. If the there are fewer than three noisy pixels in the level2.evt file, extra rows are filled as -1
| Pixel properties | Quadrant properties | ||||||
|---|---|---|---|---|---|---|---|
| Quadrant | DetID | PixID | Counts | Sigma | Mean | Median | Sigma |
| A | 10 | 83 | 336113 | 2448.64 | 675 | 661 | 137.0 |
| A | 13 | 6 | 17748 | 124.73 | 675 | 661 | 137.0 |
| A | 9 | 143 | 16686 | 116.97 | 675 | 661 | 137.0 |
| B | 5 | 172 | 446221 | 3495.9 | 664 | 645 | 127.5 |
| B | 4 | 81 | 140169 | 1094.68 | 664 | 645 | 127.5 |
| B | 0 | 213 | 85732 | 667.58 | 664 | 645 | 127.5 |
| C | 15 | 214 | 259644 | 1676.14 | 659 | 662 | 154.5 |
| C | 0 | 10 | 72393 | 464.25 | 659 | 662 | 154.5 |
| C | 14 | 254 | 8491 | 50.67 | 659 | 662 | 154.5 |
| D | 2 | 250 | 660311 | 4188.01 | 641 | 620 | 157.5 |
| D | 2 | 249 | 160932 | 1017.73 | 641 | 620 | 157.5 |
| D | 1 | 47 | 133797 | 845.47 | 641 | 620 | 157.5 |
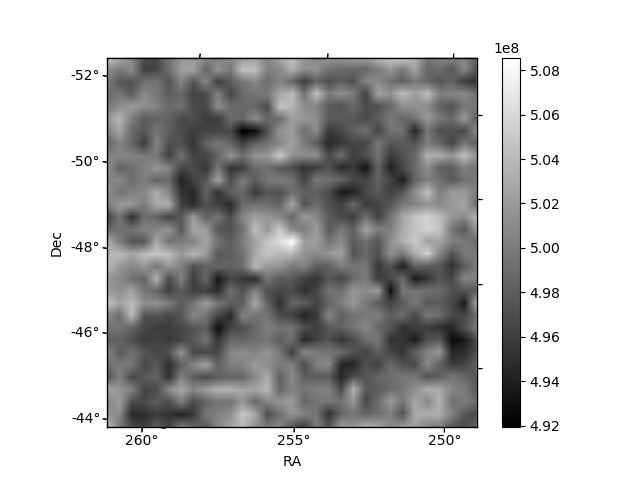
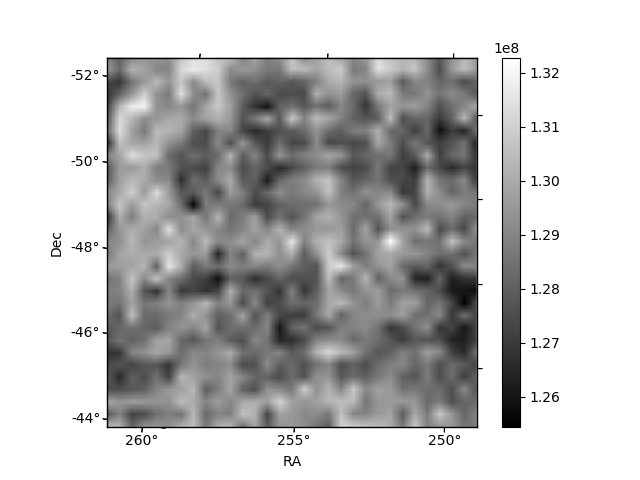
Histogram calculated using DETX and DETY for each event in the final _common_clean file
| Quadrant A | 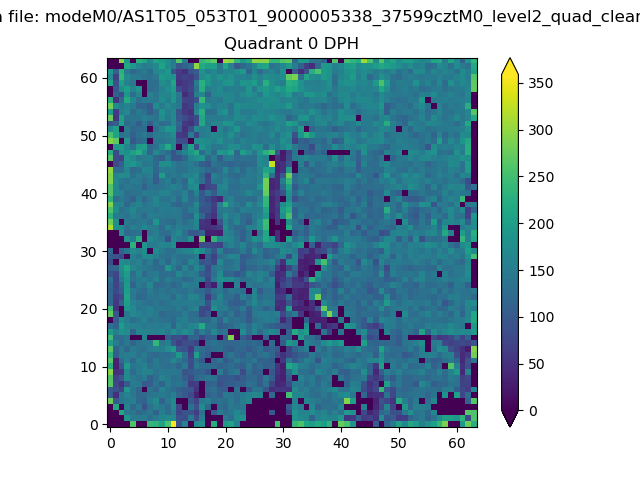 |
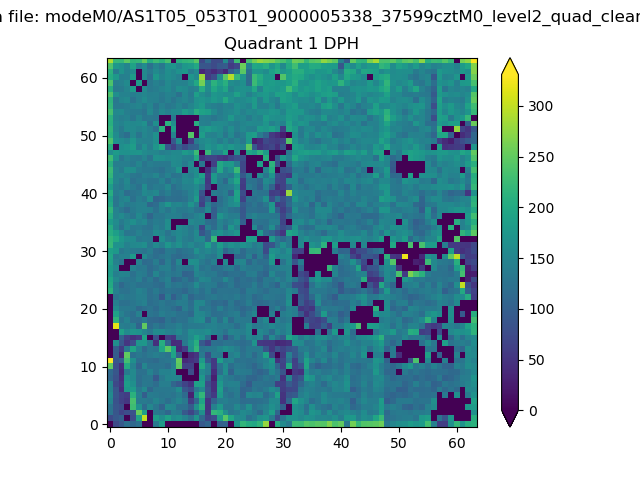 |
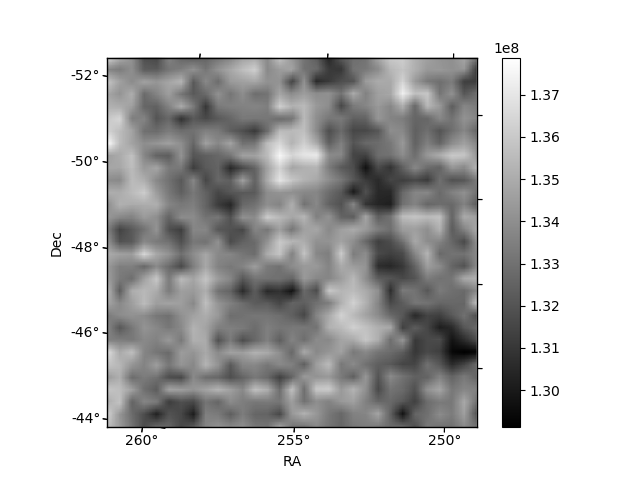
Quadrant B |
|---|---|---|---|
| Quadrant D | 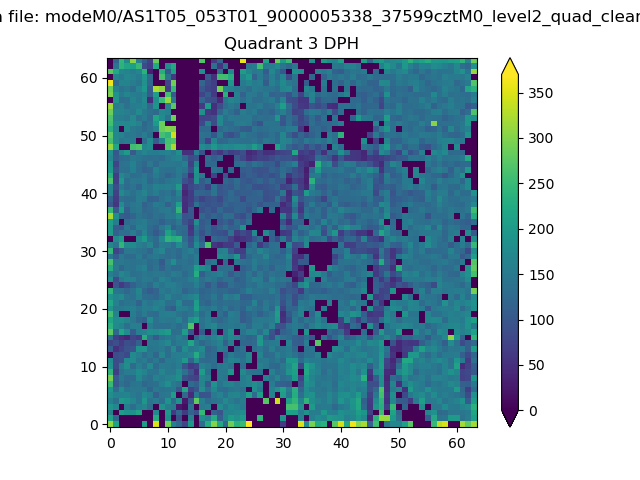 |
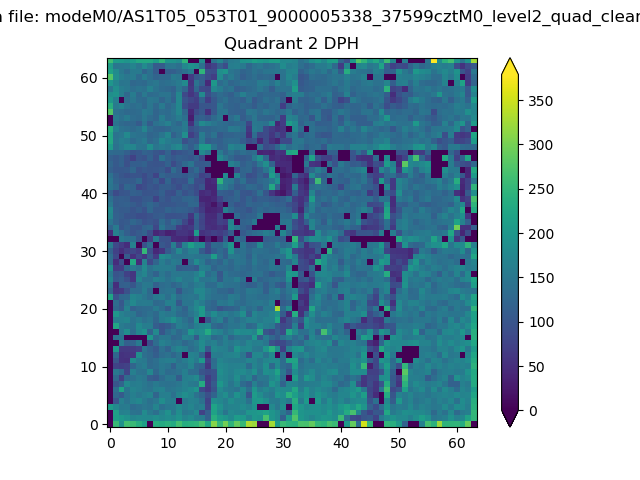 |
Quadrant C |
| Plot type | Count rate plots | Images |
|---|---|---|
| Comparison with Poisson distribution Blue bars denote a histogram of data divided into 1 sec bins. Red curve is a Poisson curve with rate = median count rate of data. |
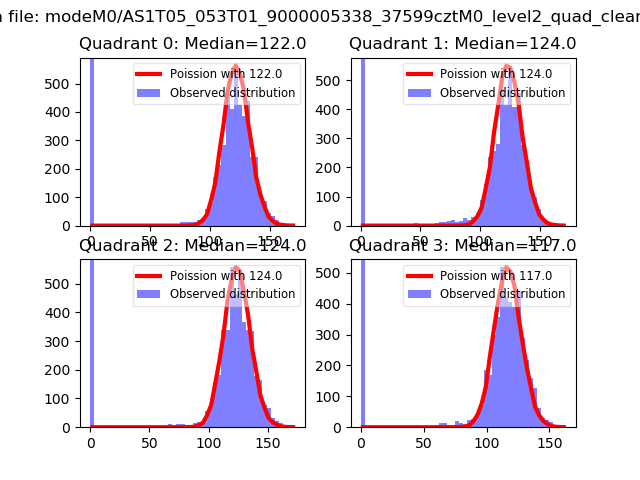 |
 |
| Quadrant-wise count rates Data is divided into 100 sec bins |
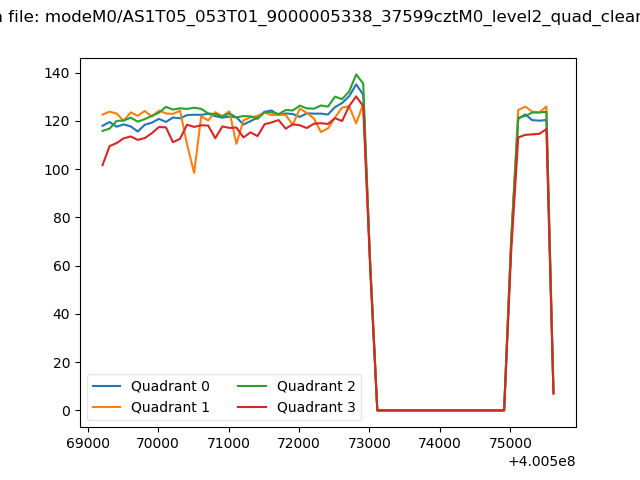 |
|
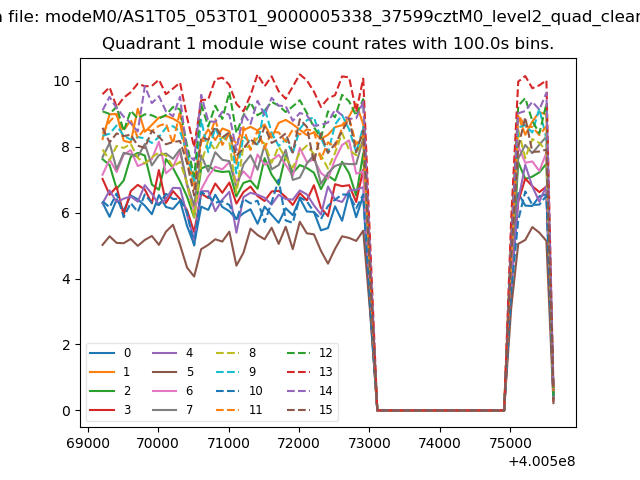
| Module-wise count rates for Quadrant A Data is divided into 100 sec bins |
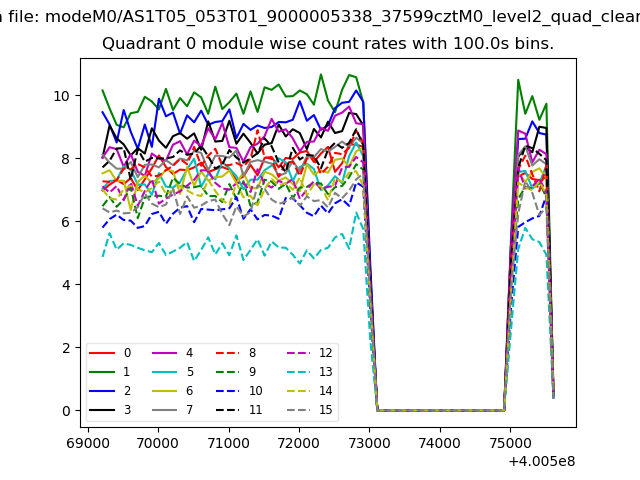 |
 |
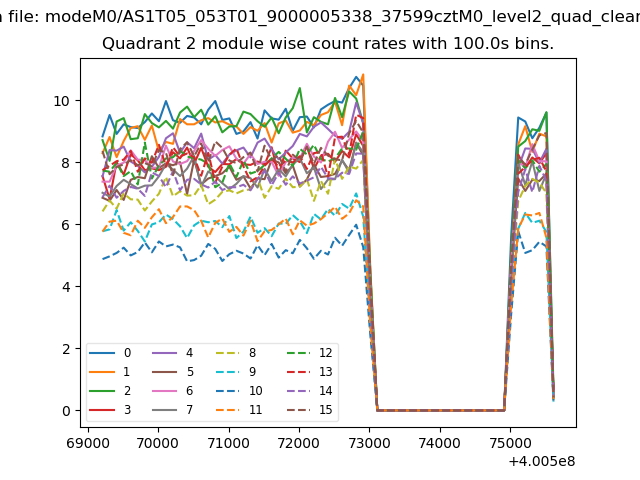
| Module-wise count rates for Quadrant B Data is divided into 100 sec bins |
 |
 |
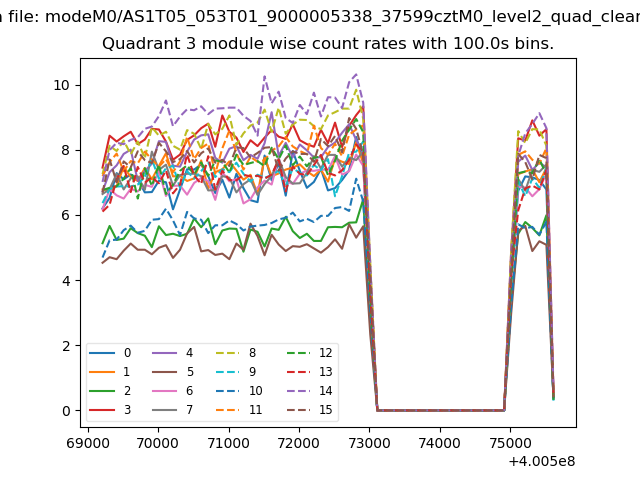
| Module-wise count rates for Quadrant C Data is divided into 100 sec bins |
 |
 |
| Module-wise count rates for Quadrant D Data is divided into 100 sec bins |
 |
 |
| Parameter | Plot |
|---|---|
| CZT HV Monitor | 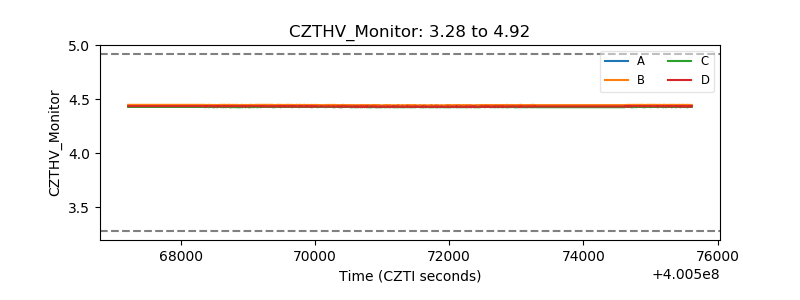 |
| D_VDD | 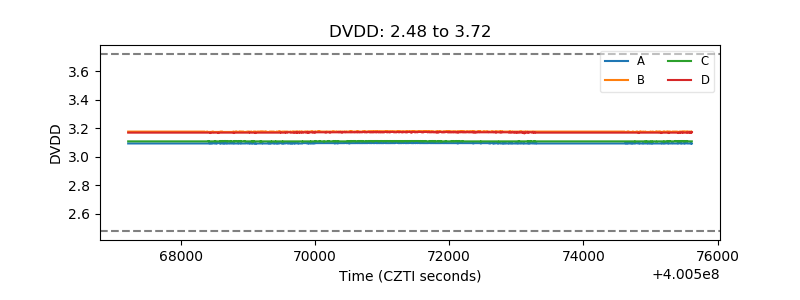 |
| Temperature 1 | 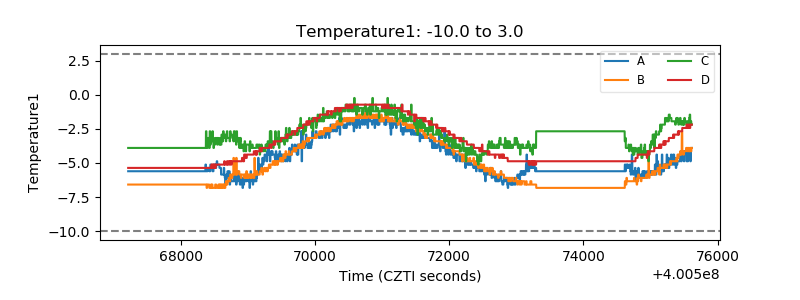 |
| Veto HV Monitor | 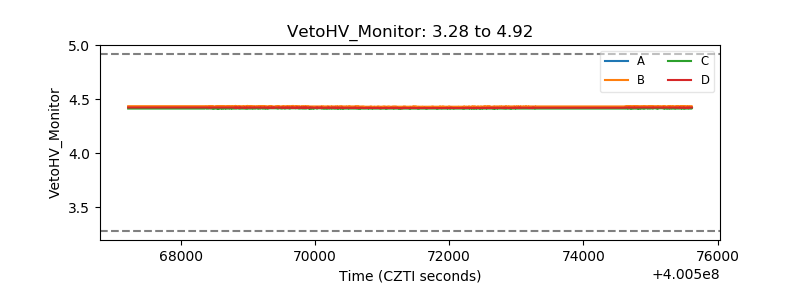 |
| Veto LLD | 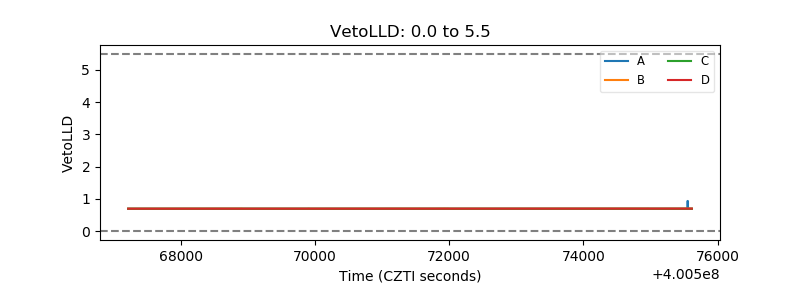 |
| Alpha Counter | 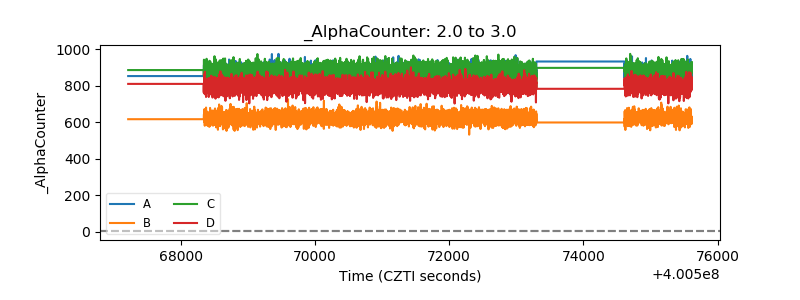 |
| _CPM_Rate | 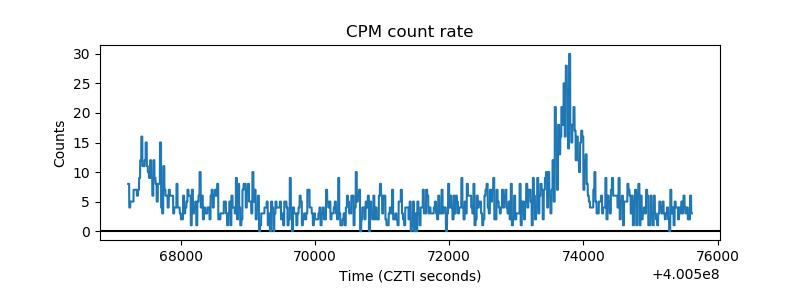 |
| CZT Counter | 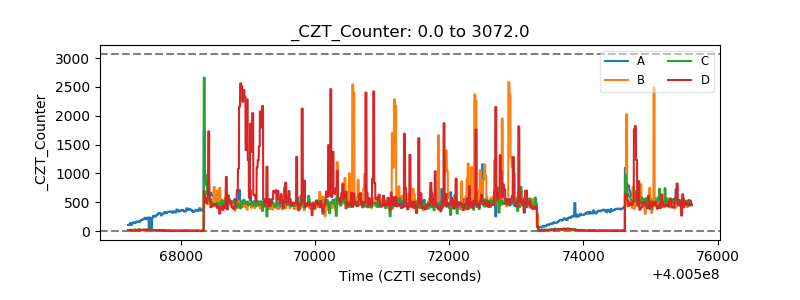 |
| +2.5 Volts monitor | 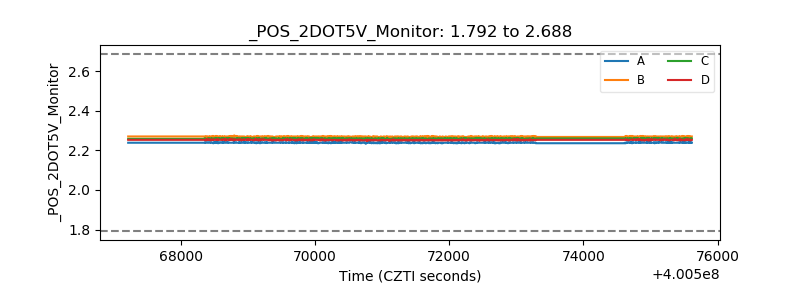 |
| +5 Volts monitor | 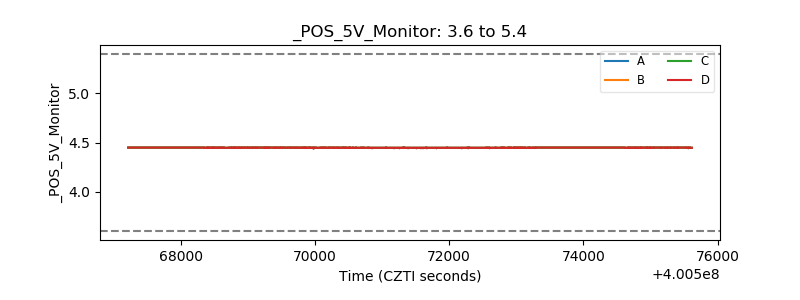 |
| _ROLL_ROT | 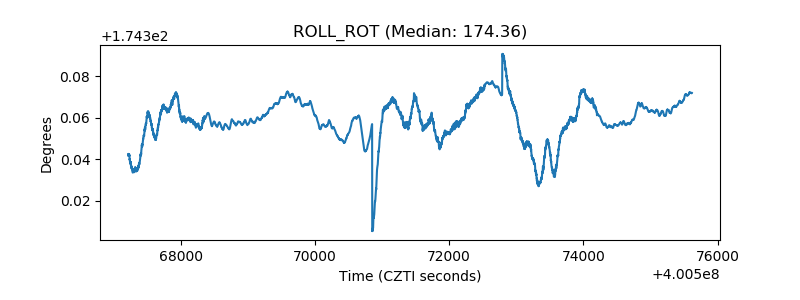 |
| _Roll_DEC | 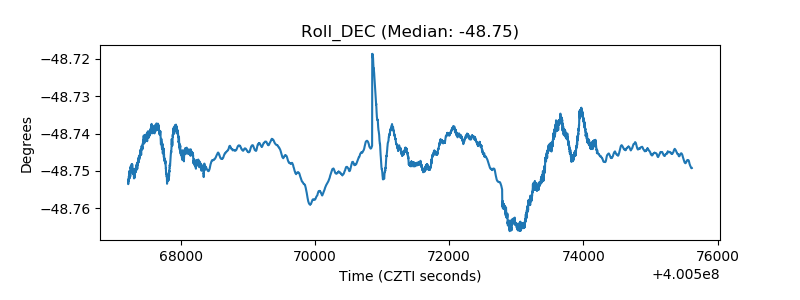 |
| _Roll_RA | 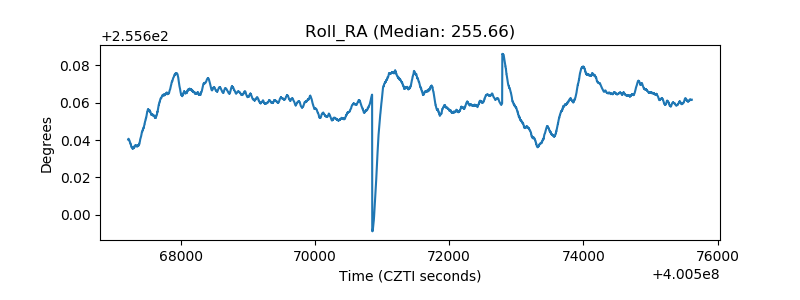 |
| Veto Counter | 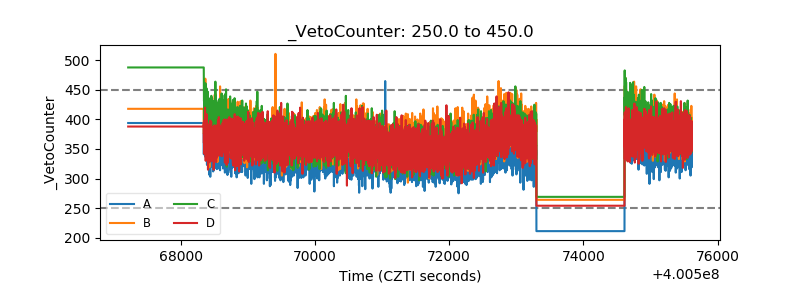 |