| Param | Original file | Final file |
|---|---|---|
| Filename | modeM0/AS1T05_053T01_9000005338_37601cztM0_level2.evt | modeM0/AS1T05_053T01_9000005338_37601cztM0_level2_quad_clean.evt |
| Size (bytes) | 873,662,400 | 162,682,560 |
| Size | 833.2 MB | 155.1 MB |
| Events in quadrant A | 5,774,112 | 1,053,984 |
| Events in quadrant B | 6,477,585 | 1,062,213 |
| Events in quadrant C | 5,398,487 | 1,080,177 |
| Events in quadrant D | 8,072,261 | 976,308 |
| Mode SS | |||
|---|---|---|---|
| Quadrant | BADHDUFLAG | Total packets | Discarded packets |
| A | 0 | 222 | 0 |
| B | 0 | 222 | 0 |
| C | 0 | 222 | 0 |
| D | 0 | 222 | 0 |
| Mode M0 | |||
|---|---|---|---|
| Quadrant | BADHDUFLAG | Total packets | Discarded packets |
| A | 0 | 23748 | 4 |
| B | 0 | 26013 | 3 |
| C | 0 | 22607 | 3 |
| D | 0 | 31363 | 3 |
| Mode M9 | |||
|---|---|---|---|
| Quadrant | BADHDUFLAG | Total packets | Discarded packets |
| A | 0 | 42 | 0 |
| B | 0 | 42 | 0 |
| C | 0 | 42 | 0 |
| D | 0 | 42 | 0 |
| Quadrant | Total seconds | Saturated seconds | Saturation percentage |
|---|---|---|---|
| A | 10901 | 156 | 1.431061% |
| B | 10901 | 236 | 2.164939% |
| C | 10901 | 30 | 0.275204% |
| D | 10901 | 769 | 7.054399% |
Noise dominated data is calculated using 1-second bins in cleaned event files. If a bin has >2000 counts, and if more than 50% of those come from <1% of pixels, then it is considered to be noise-dominated and hence unusable.
| Quadrant | # 1 sec bins | Bins with >0 counts | Bins with >2000 counts | High rate bins dominated by noise | Noise dominated (total time) | Noise dominated (detector-on time) | Marked lightcurve |
|---|---|---|---|---|---|---|---|
| A | 15049 | 10902 | 126 | 126 | 0.84% | 1.16% | 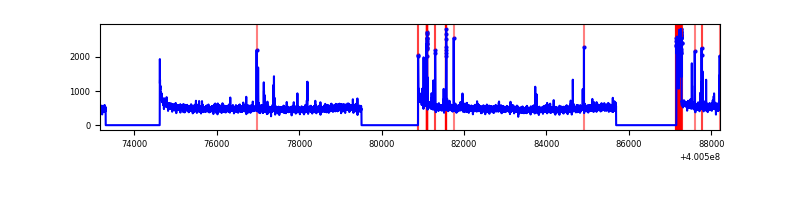 |
| B | 15049 | 10900 | 192 | 192 | 1.28% | 1.76% | 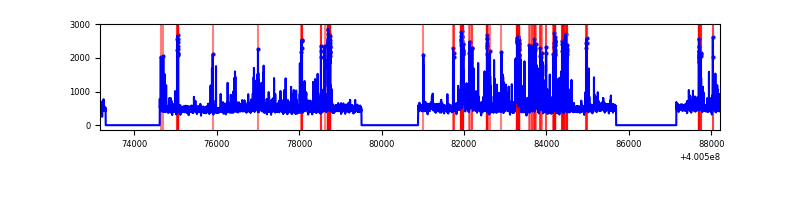 |
| C | 15049 | 10901 | 22 | 22 | 0.15% | 0.20% | 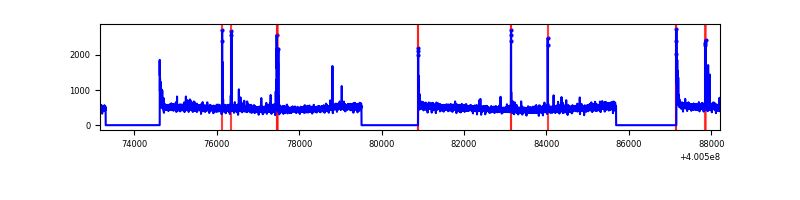 |
| D | 15050 | 10901 | 801 | 801 | 5.32% | 7.35% | 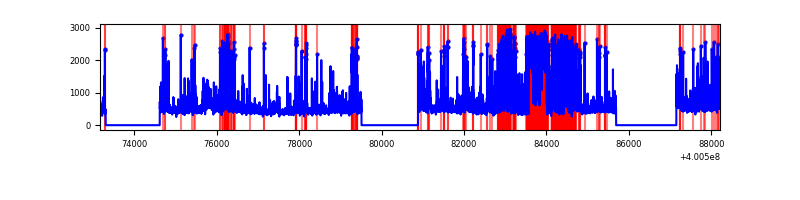 |
Top three noisy pixels from each quadrant. If the there are fewer than three noisy pixels in the level2.evt file, extra rows are filled as -1
| Pixel properties | Quadrant properties | ||||||
|---|---|---|---|---|---|---|---|
| Quadrant | DetID | PixID | Counts | Sigma | Mean | Median | Sigma |
| A | 10 | 83 | 565547 | 2280.45 | 1237 | 1216 | 247.5 |
| A | 9 | 143 | 320578 | 1290.53 | 1237 | 1216 | 247.5 |
| A | 13 | 248 | 48189 | 189.82 | 1237 | 1216 | 247.5 |
| B | 5 | 172 | 467932 | 1975.68 | 1227 | 1192 | 236.2 |
| B | 5 | 255 | 423388 | 1787.13 | 1227 | 1192 | 236.2 |
| B | 0 | 213 | 242430 | 1021.15 | 1227 | 1192 | 236.2 |
| C | 15 | 214 | 470958 | 1663.21 | 1210 | 1218 | 282.4 |
| C | 14 | 254 | 90686 | 316.78 | 1210 | 1218 | 282.4 |
| C | 0 | 10 | 86587 | 302.27 | 1210 | 1218 | 282.4 |
| D | 2 | 250 | 1689308 | 5914.61 | 1175 | 1144 | 285.4 |
| D | 2 | 249 | 595127 | 2081.06 | 1175 | 1144 | 285.4 |
| D | 13 | 249 | 382844 | 1337.31 | 1175 | 1144 | 285.4 |
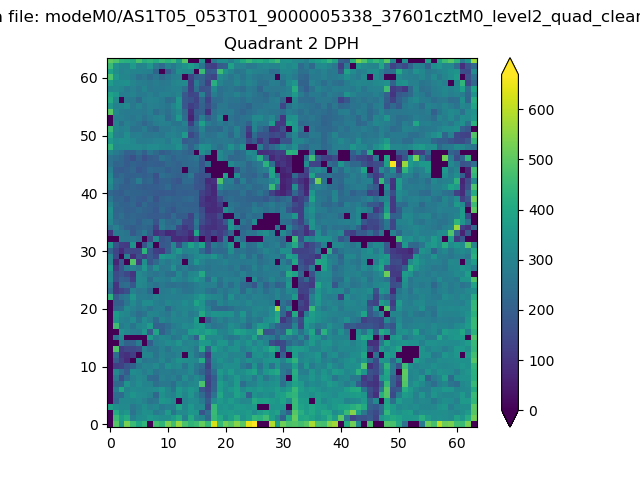
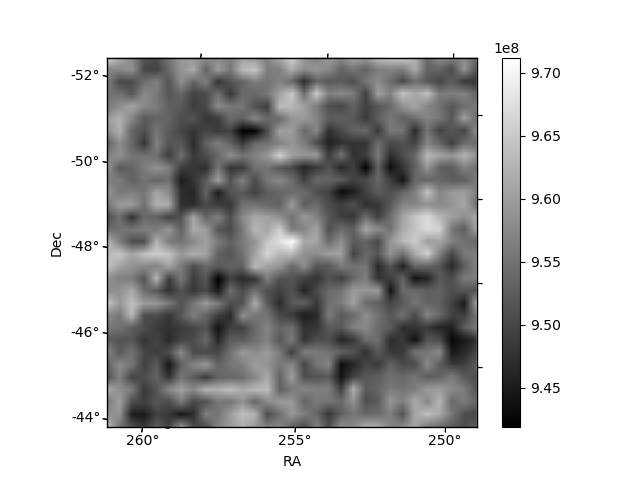
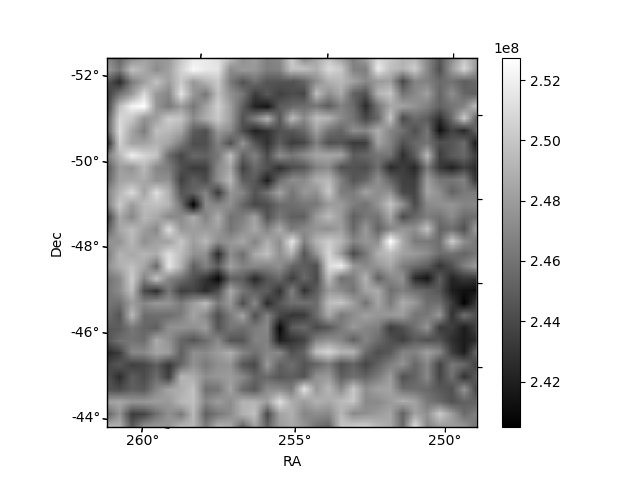
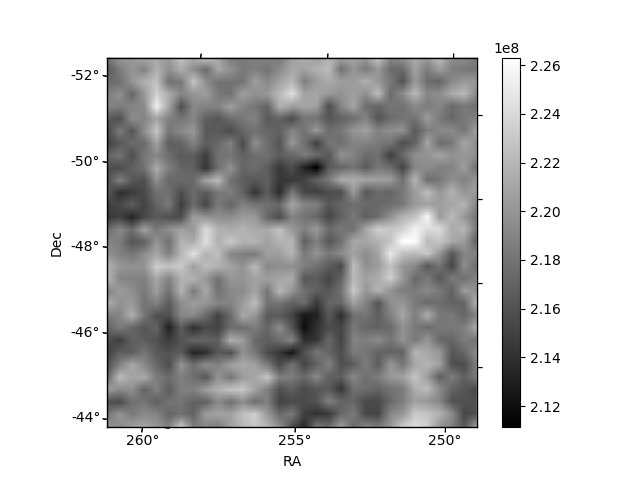
Histogram calculated using DETX and DETY for each event in the final _common_clean file
| Quadrant A | 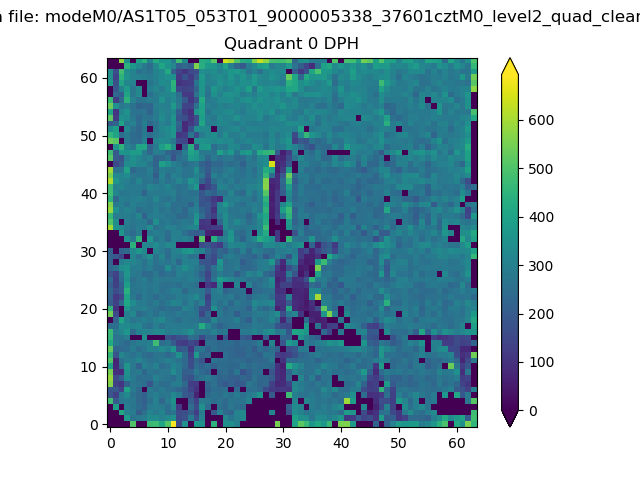 |
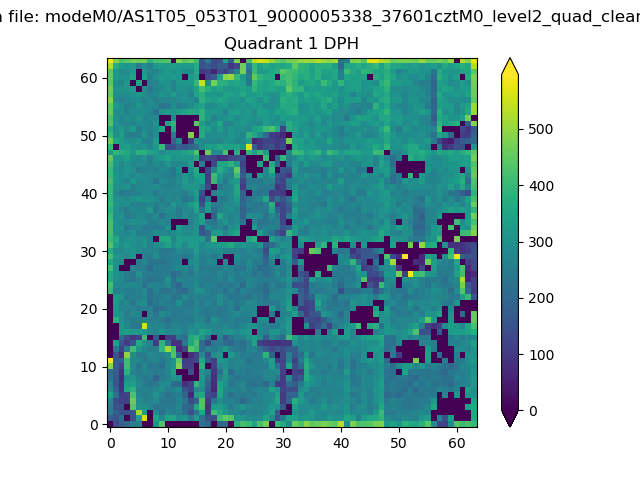 |
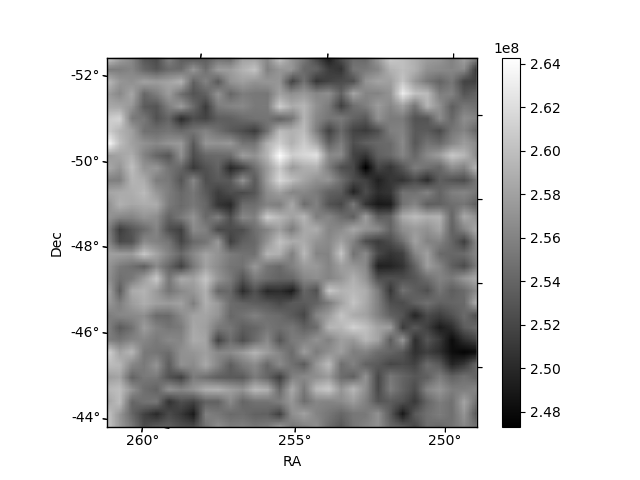
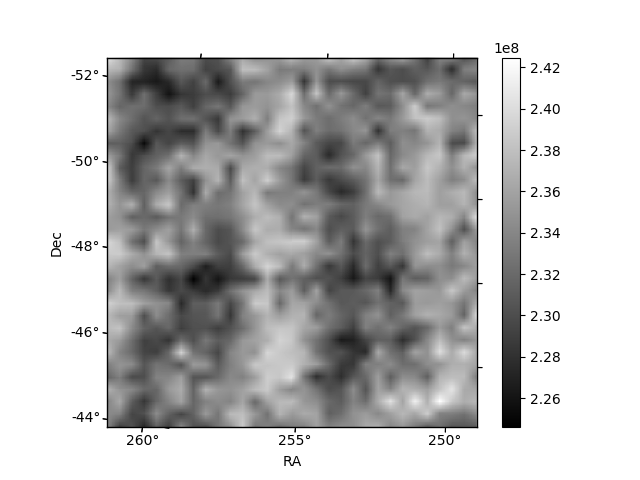
Quadrant B |
|---|---|---|---|
| Quadrant D | 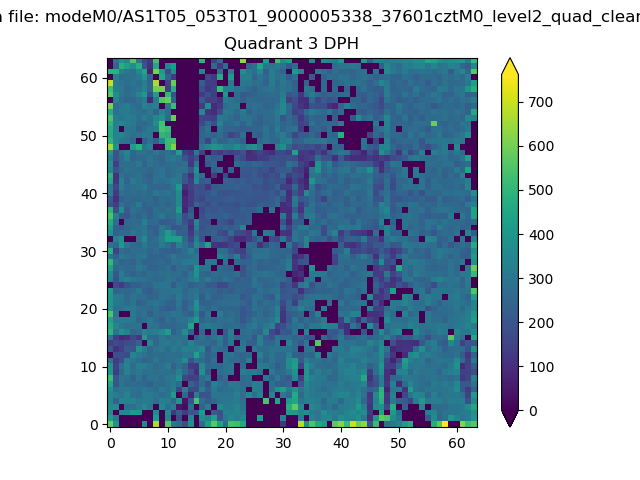 |
 |
Quadrant C |
| Plot type | Count rate plots | Images |
|---|---|---|
| Comparison with Poisson distribution Blue bars denote a histogram of data divided into 1 sec bins. Red curve is a Poisson curve with rate = median count rate of data. |
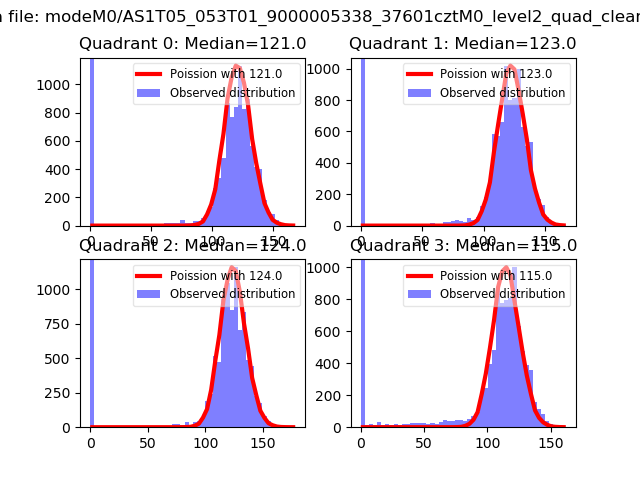 |
 |
| Quadrant-wise count rates Data is divided into 100 sec bins |
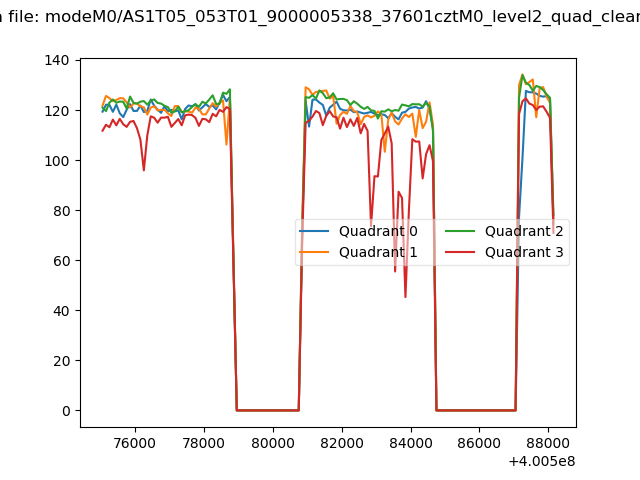 |
|
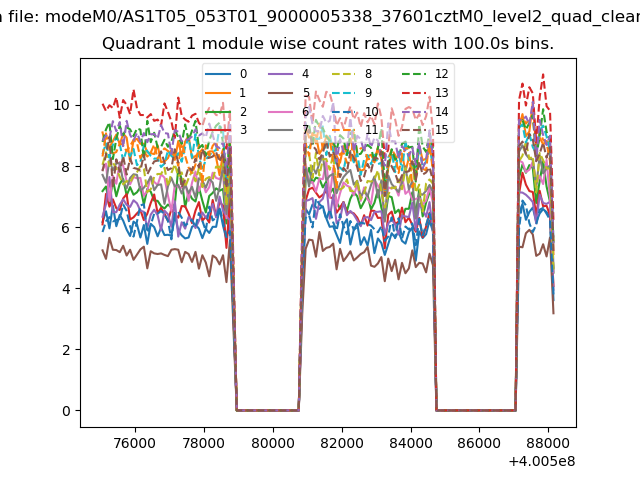
| Module-wise count rates for Quadrant A Data is divided into 100 sec bins |
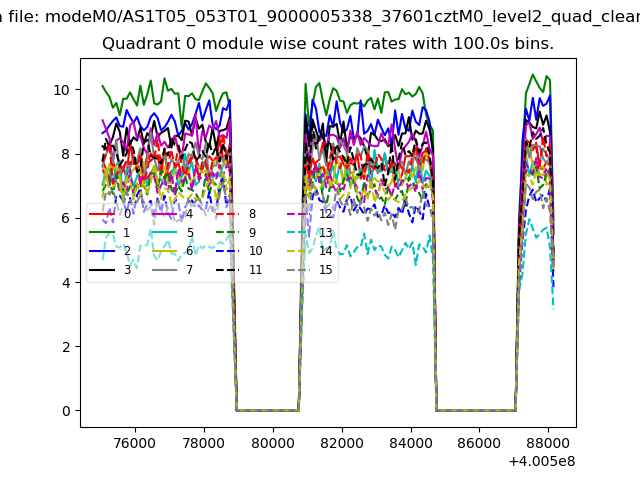 |
 |
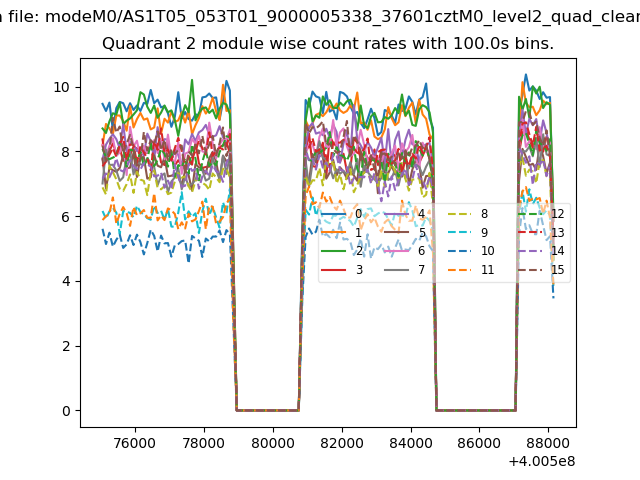
| Module-wise count rates for Quadrant B Data is divided into 100 sec bins |
 |
 |
| Module-wise count rates for Quadrant C Data is divided into 100 sec bins |
 |
 |
| Module-wise count rates for Quadrant D Data is divided into 100 sec bins |
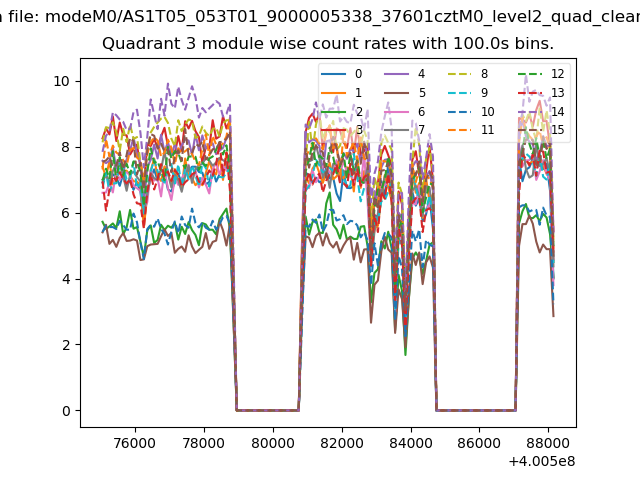 |
 |
| Parameter | Plot |
|---|---|
| CZT HV Monitor | 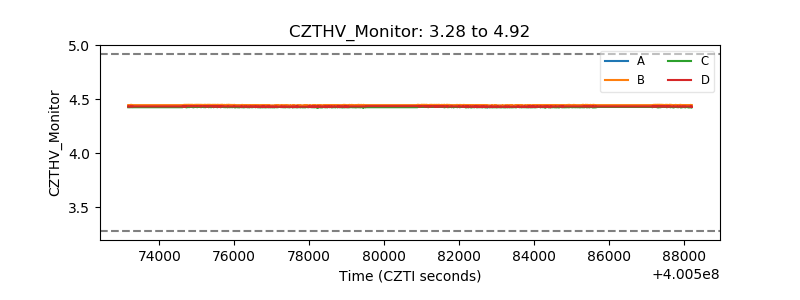 |
| D_VDD | 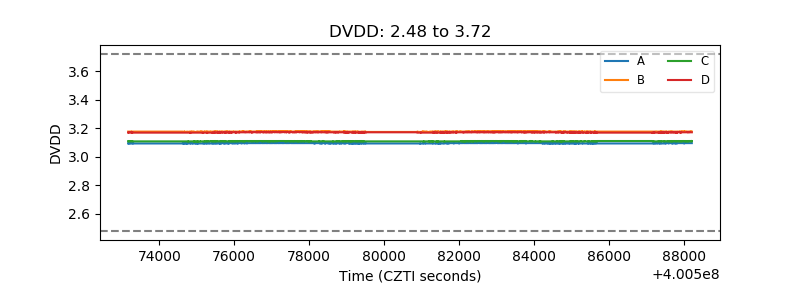 |
| Temperature 1 | 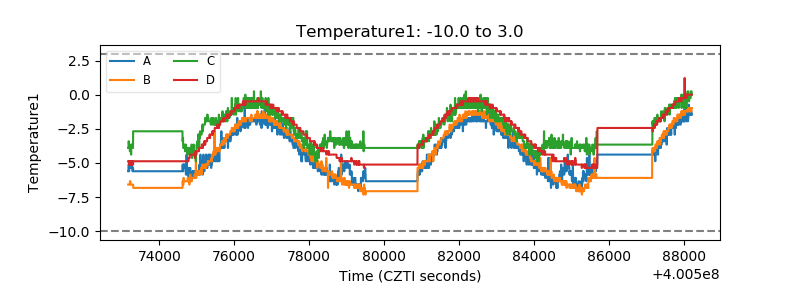 |
| Veto HV Monitor | 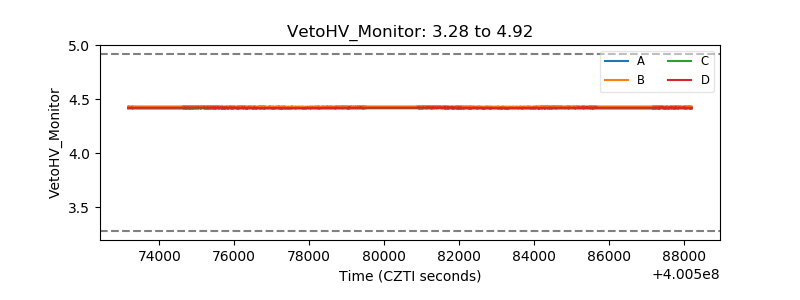 |
| Veto LLD | 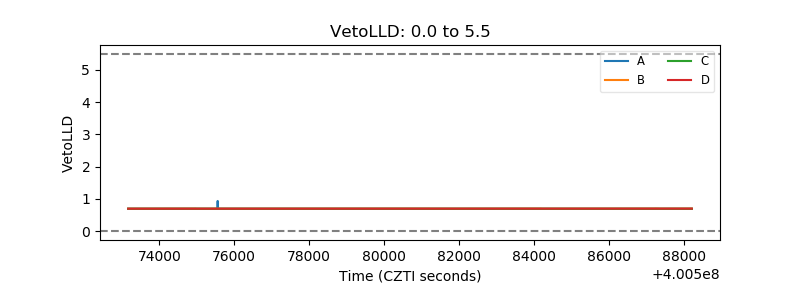 |
| Alpha Counter | 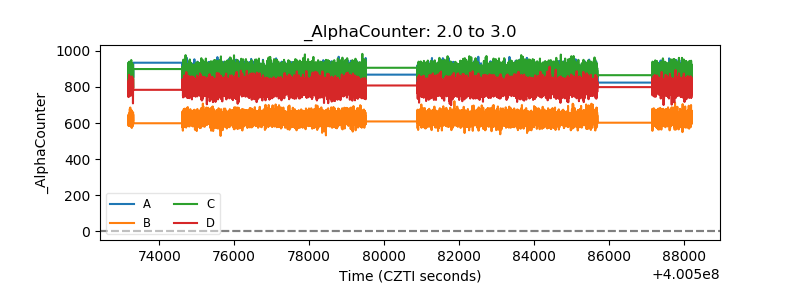 |
| _CPM_Rate | 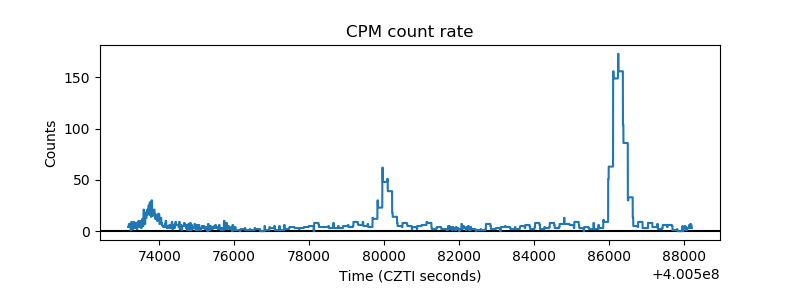 |
| CZT Counter | 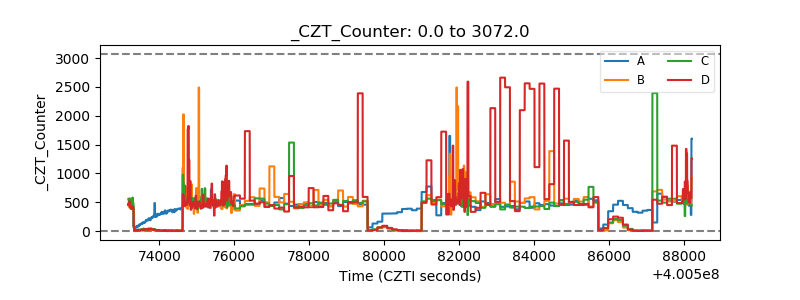 |
| +2.5 Volts monitor | 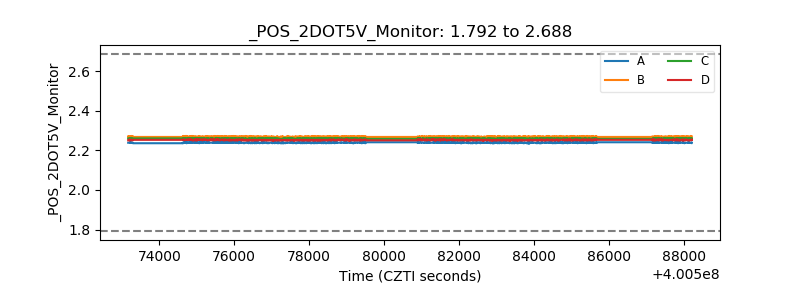 |
| +5 Volts monitor | 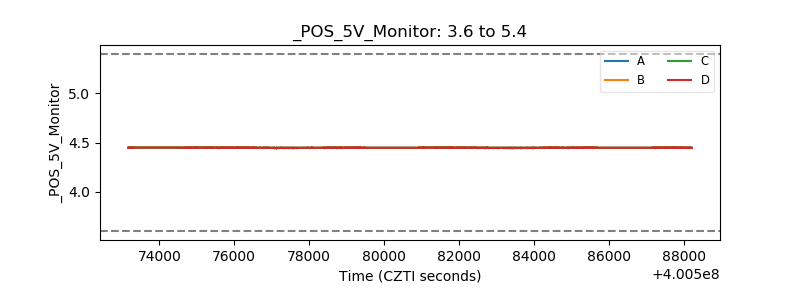 |
| _ROLL_ROT | 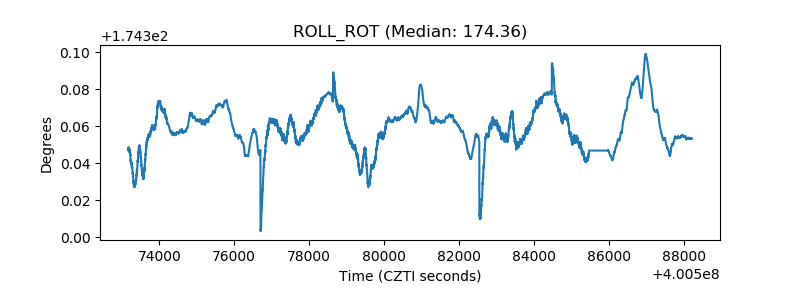 |
| _Roll_DEC | 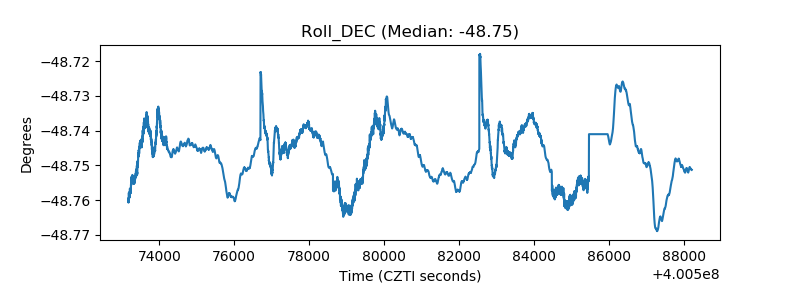 |
| _Roll_RA | 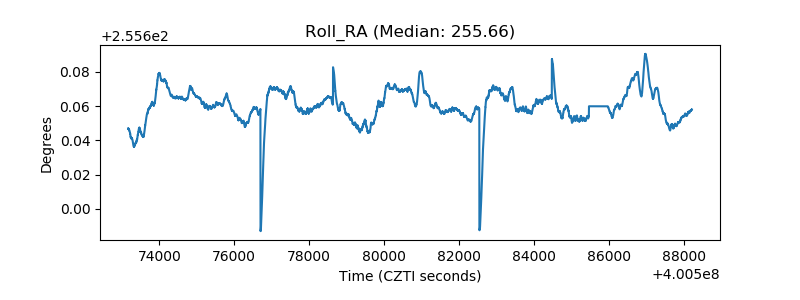 |
| Veto Counter | 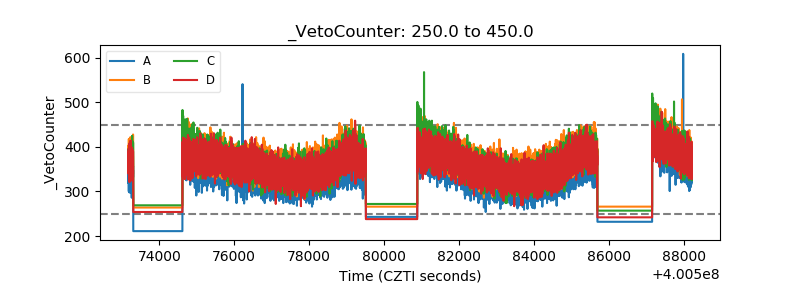 |