| Param | Original file | Final file |
|---|---|---|
| Filename | modeM0/AS1T05_053T01_9000005338_37602cztM0_level2.evt | modeM0/AS1T05_053T01_9000005338_37602cztM0_level2_quad_clean.evt |
| Size (bytes) | 497,223,360 | 84,404,160 |
| Size | 474.2 MB | 80.5 MB |
| Events in quadrant A | 3,201,879 | 541,363 |
| Events in quadrant B | 3,376,388 | 546,707 |
| Events in quadrant C | 2,880,490 | 558,040 |
| Events in quadrant D | 5,211,646 | 509,739 |
| Mode SS | |||
|---|---|---|---|
| Quadrant | BADHDUFLAG | Total packets | Discarded packets |
| A | 0 | 118 | 0 |
| B | 0 | 118 | 0 |
| C | 0 | 118 | 0 |
| D | 0 | 118 | 0 |
| Mode M0 | |||
|---|---|---|---|
| Quadrant | BADHDUFLAG | Total packets | Discarded packets |
| A | 0 | 13054 | 3 |
| B | 0 | 13695 | 2 |
| C | 0 | 12101 | 2 |
| D | 0 | 19347 | 2 |
| Mode M9 | |||
|---|---|---|---|
| Quadrant | BADHDUFLAG | Total packets | Discarded packets |
| A | 0 | 17 | 0 |
| B | 0 | 17 | 0 |
| C | 0 | 17 | 0 |
| D | 0 | 18 | 0 |
| Quadrant | Total seconds | Saturated seconds | Saturation percentage |
|---|---|---|---|
| A | 5714 | 136 | 2.380119% |
| B | 5714 | 141 | 2.467623% |
| C | 5714 | 19 | 0.332517% |
| D | 5714 | 503 | 8.802940% |
Noise dominated data is calculated using 1-second bins in cleaned event files. If a bin has >2000 counts, and if more than 50% of those come from <1% of pixels, then it is considered to be noise-dominated and hence unusable.
| Quadrant | # 1 sec bins | Bins with >0 counts | Bins with >2000 counts | High rate bins dominated by noise | Noise dominated (total time) | Noise dominated (detector-on time) | Marked lightcurve |
|---|---|---|---|---|---|---|---|
| A | 7267 | 5715 | 102 | 102 | 1.40% | 1.78% | 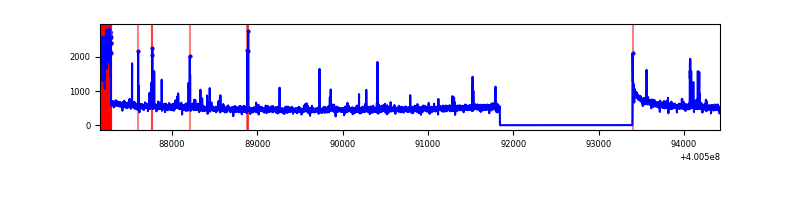 |
| B | 7266 | 5713 | 112 | 112 | 1.54% | 1.96% | 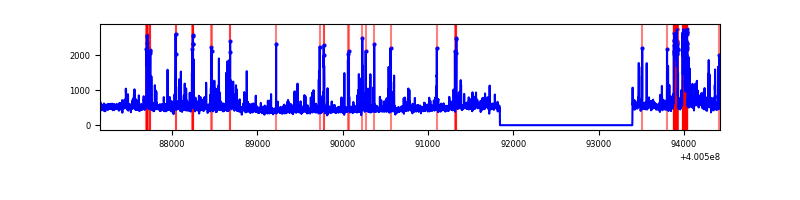 |
| C | 7266 | 5713 | 11 | 11 | 0.15% | 0.19% | 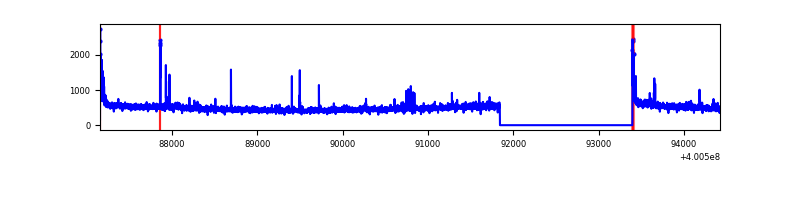 |
| D | 7266 | 5713 | 522 | 522 | 7.18% | 9.14% | 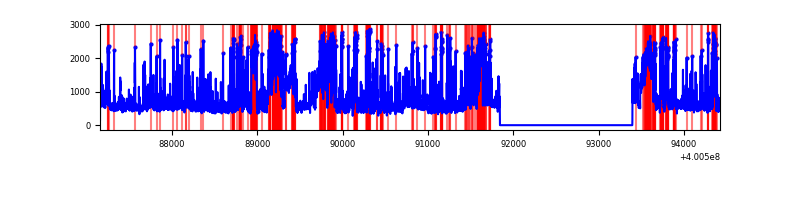 |
Top three noisy pixels from each quadrant. If the there are fewer than three noisy pixels in the level2.evt file, extra rows are filled as -1
| Pixel properties | Quadrant properties | ||||||
|---|---|---|---|---|---|---|---|
| Quadrant | DetID | PixID | Counts | Sigma | Mean | Median | Sigma |
| A | 10 | 83 | 328555 | 2473.26 | 652 | 640 | 132.6 |
| A | 9 | 143 | 301738 | 2270.99 | 652 | 640 | 132.6 |
| A | 12 | 189 | 20898 | 152.79 | 652 | 640 | 132.6 |
| B | 5 | 172 | 389021 | 3118.28 | 645 | 628 | 124.6 |
| B | 5 | 255 | 93709 | 747.32 | 645 | 628 | 124.6 |
| B | 0 | 189 | 84864 | 676.3 | 645 | 628 | 124.6 |
| C | 15 | 214 | 250620 | 1675.31 | 636 | 639 | 149.2 |
| C | 0 | 10 | 68867 | 457.25 | 636 | 639 | 149.2 |
| C | 14 | 128 | 35764 | 235.4 | 636 | 639 | 149.2 |
| D | 10 | 204 | 846403 | 5537.5 | 623 | 607 | 152.7 |
| D | 2 | 250 | 394195 | 2576.85 | 623 | 607 | 152.7 |
| D | 2 | 249 | 381418 | 2493.2 | 623 | 607 | 152.7 |
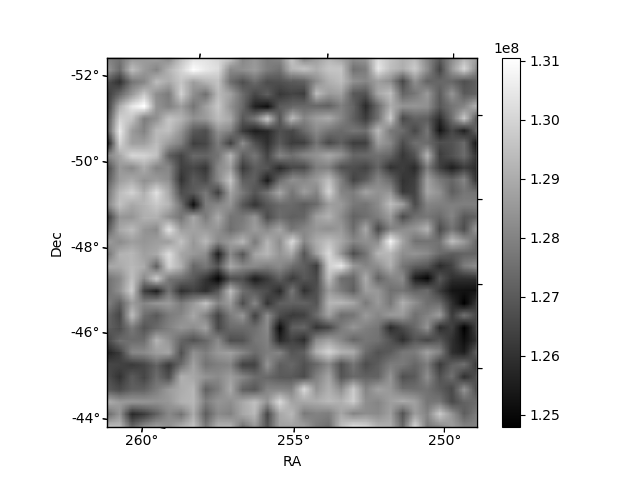
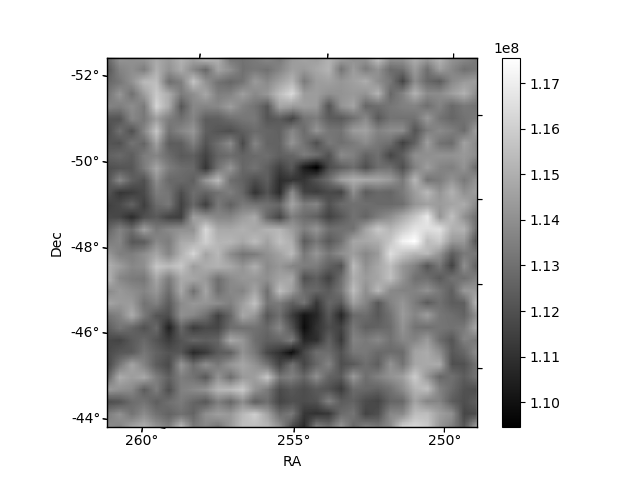
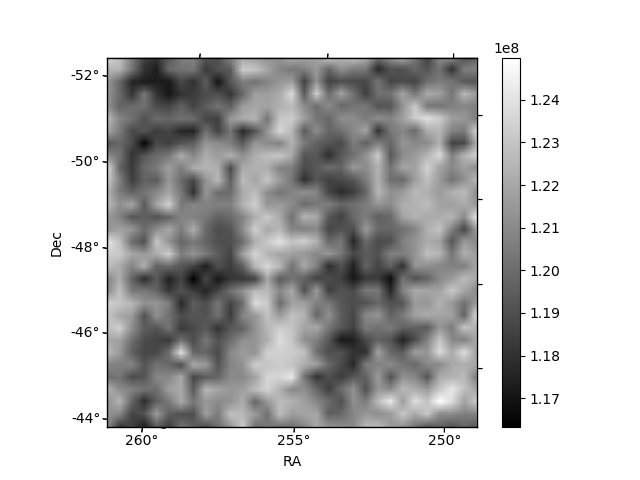
Histogram calculated using DETX and DETY for each event in the final _common_clean file
| Quadrant A | 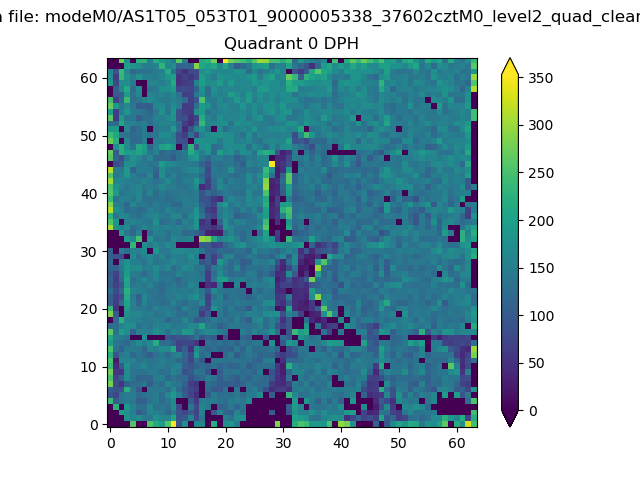 |
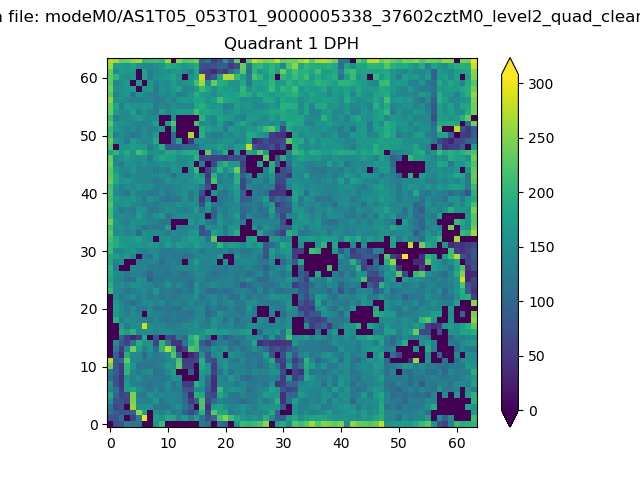 |
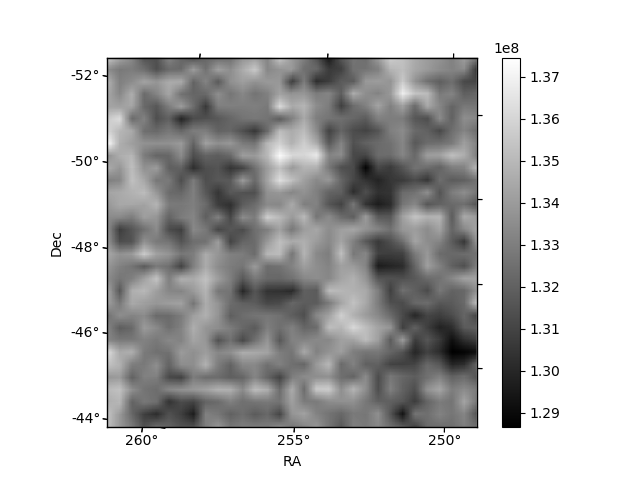
Quadrant B |
|---|---|---|---|
| Quadrant D | 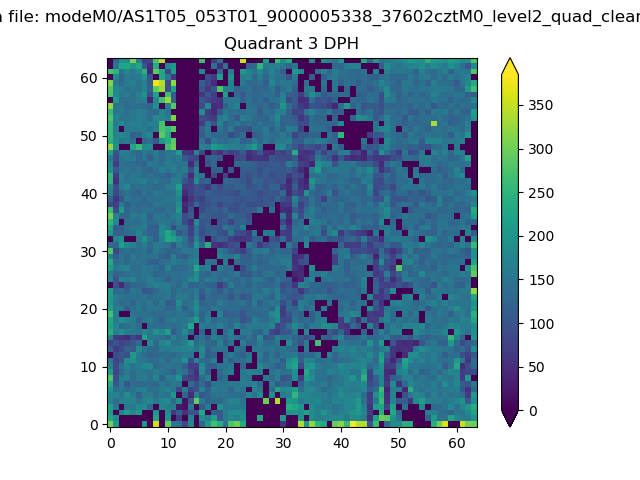 |
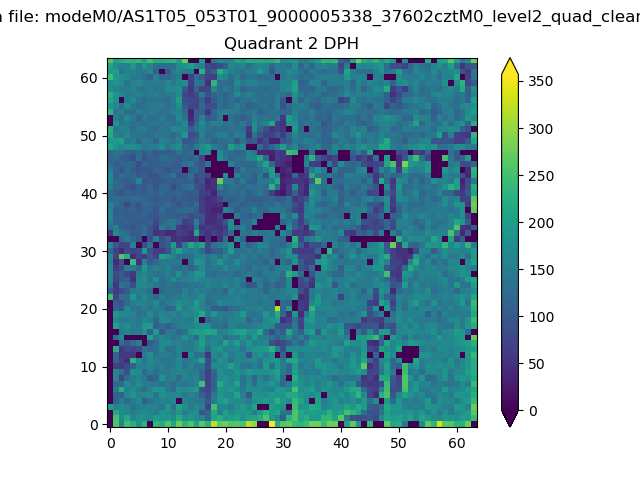 |
Quadrant C |
| Plot type | Count rate plots | Images |
|---|---|---|
| Comparison with Poisson distribution Blue bars denote a histogram of data divided into 1 sec bins. Red curve is a Poisson curve with rate = median count rate of data. |
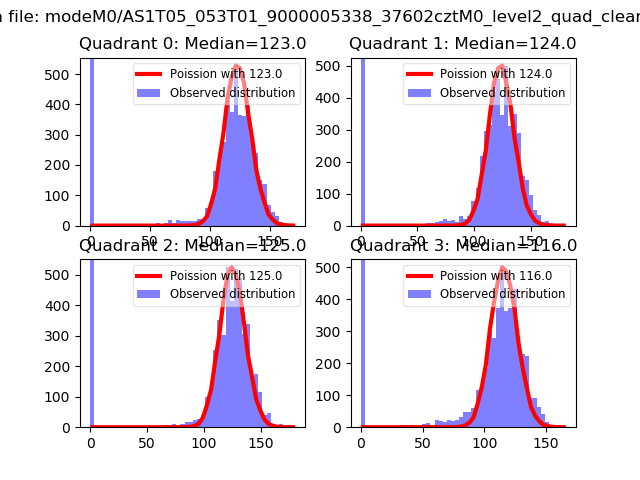 |
 |
| Quadrant-wise count rates Data is divided into 100 sec bins |
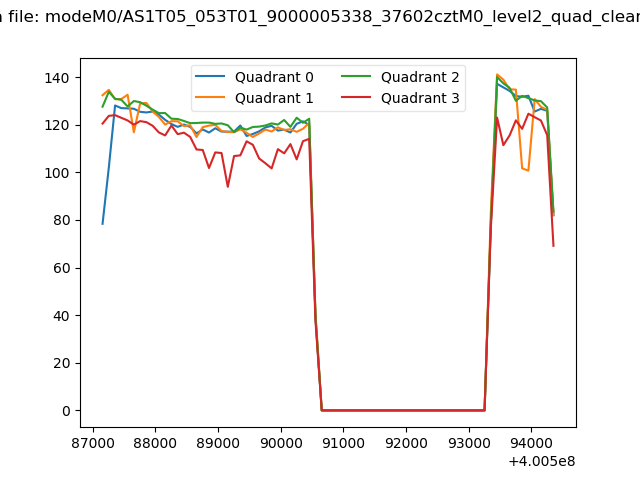 |
|
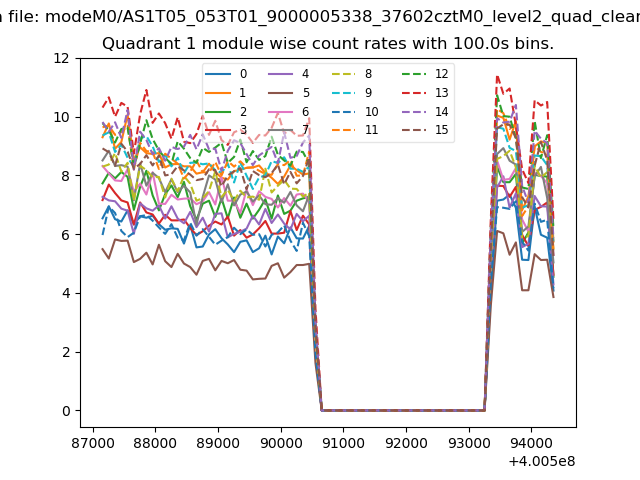
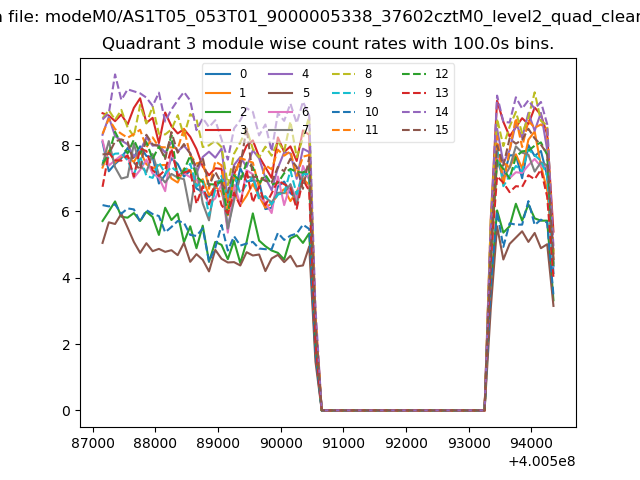
| Module-wise count rates for Quadrant A Data is divided into 100 sec bins |
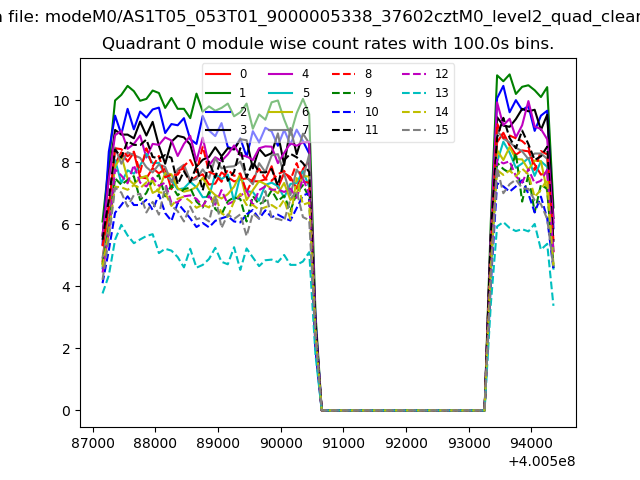 |
 |
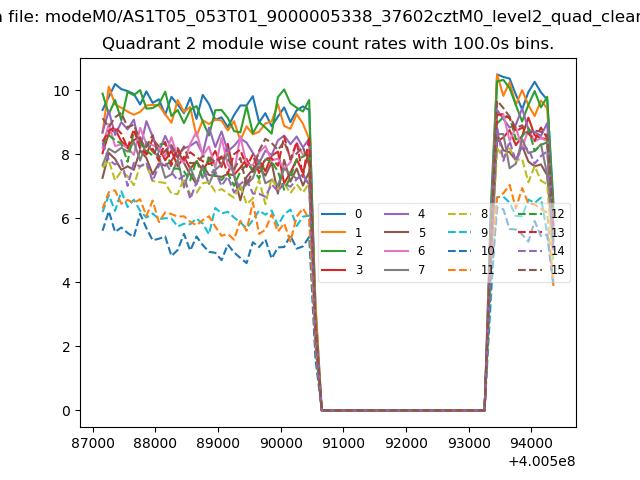
| Module-wise count rates for Quadrant B Data is divided into 100 sec bins |
 |
 |
| Module-wise count rates for Quadrant C Data is divided into 100 sec bins |
 |
 |
| Module-wise count rates for Quadrant D Data is divided into 100 sec bins |
 |
 |
| Parameter | Plot |
|---|---|
| CZT HV Monitor | 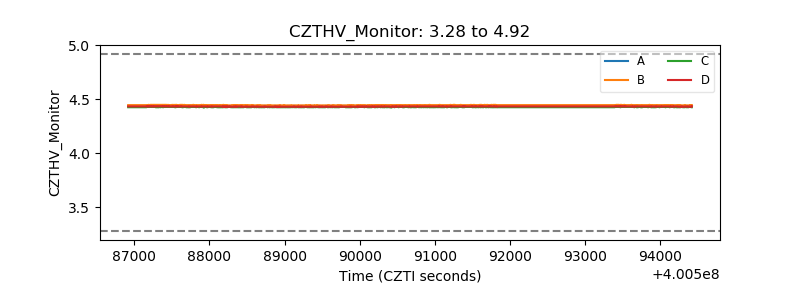 |
| D_VDD | 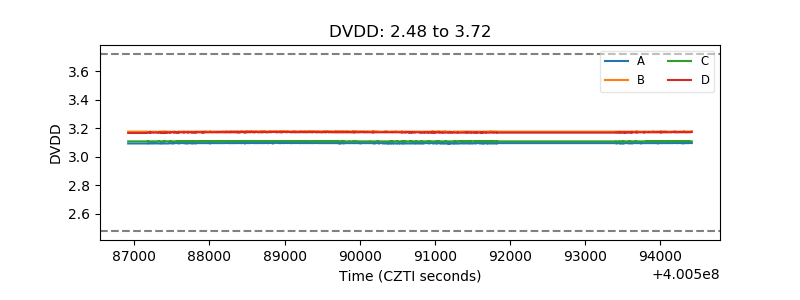 |
| Temperature 1 | 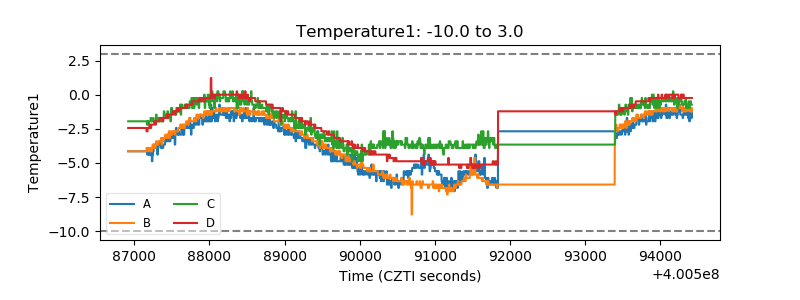 |
| Veto HV Monitor | 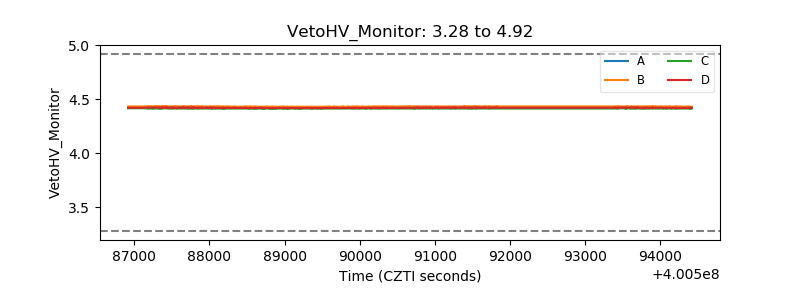 |
| Veto LLD | 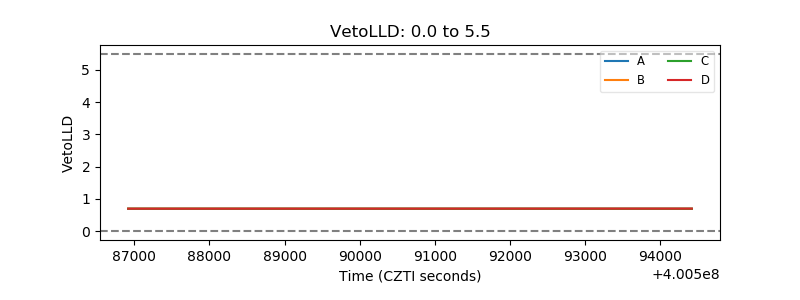 |
| Alpha Counter | 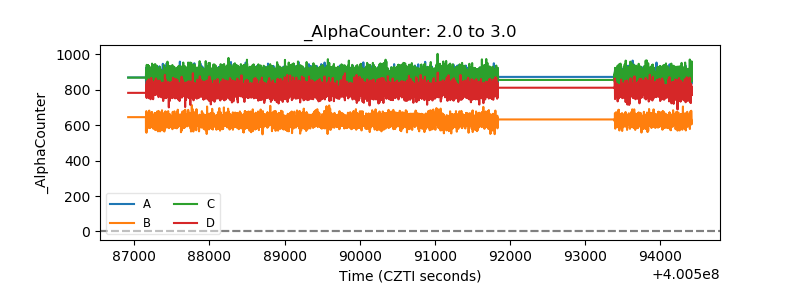 |
| _CPM_Rate | 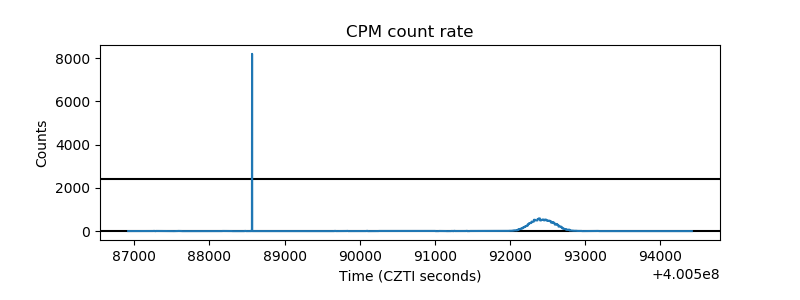 |
| CZT Counter | 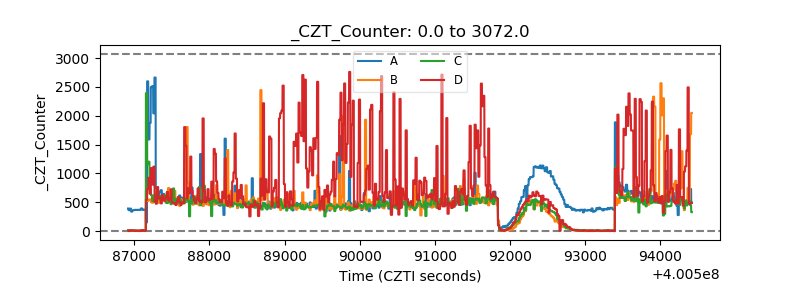 |
| +2.5 Volts monitor | 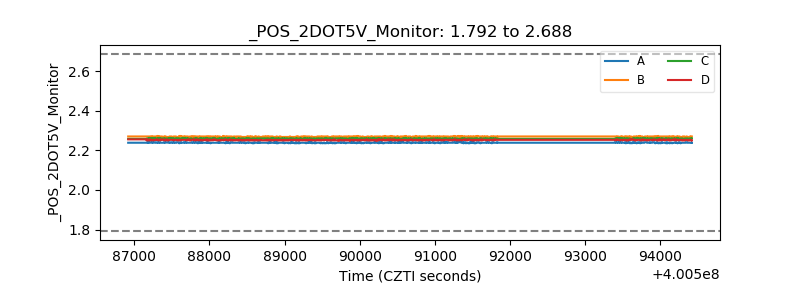 |
| +5 Volts monitor | 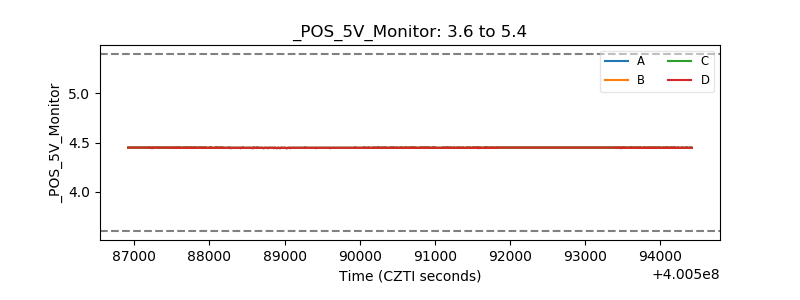 |
| _ROLL_ROT | 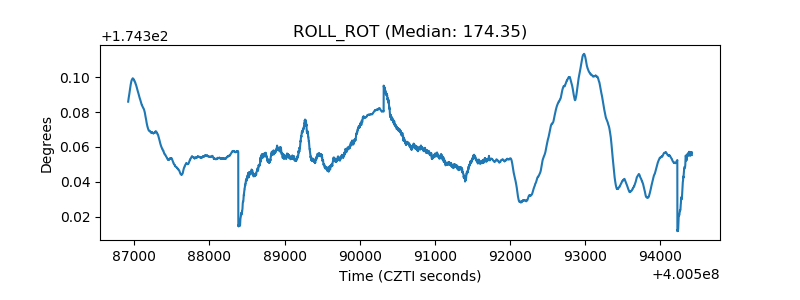 |
| _Roll_DEC | 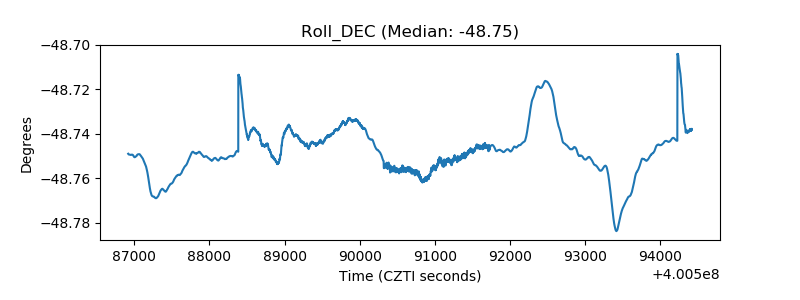 |
| _Roll_RA | 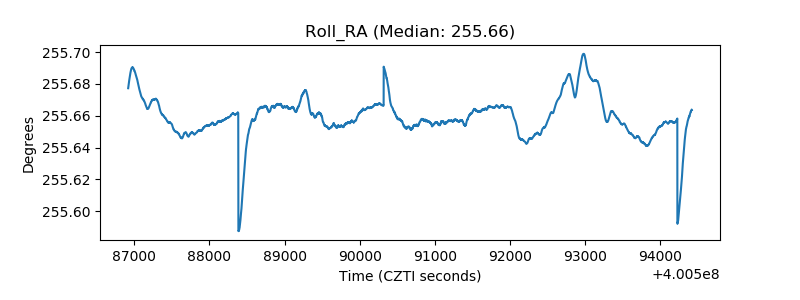 |
| Veto Counter | 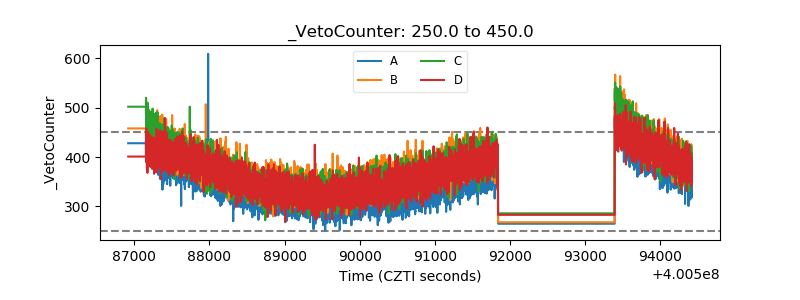 |