| Param | Original file | Final file |
|---|---|---|
| Filename | modeM0/AS1T05_053T01_9000005338_37603cztM0_level2.evt | modeM0/AS1T05_053T01_9000005338_37603cztM0_level2_quad_clean.evt |
| Size (bytes) | 496,434,240 | 79,652,160 |
| Size | 473.4 MB | 76.0 MB |
| Events in quadrant A | 3,224,496 | 520,178 |
| Events in quadrant B | 3,320,419 | 512,760 |
| Events in quadrant C | 2,806,525 | 520,280 |
| Events in quadrant D | 5,302,346 | 465,944 |
| Mode SS | |||
|---|---|---|---|
| Quadrant | BADHDUFLAG | Total packets | Discarded packets |
| A | 0 | 114 | 0 |
| B | 0 | 114 | 0 |
| C | 0 | 114 | 0 |
| D | 0 | 114 | 0 |
| Mode M0 | |||
|---|---|---|---|
| Quadrant | BADHDUFLAG | Total packets | Discarded packets |
| A | 0 | 13232 | 3 |
| B | 0 | 13689 | 2 |
| C | 0 | 11900 | 2 |
| D | 0 | 19665 | 2 |
| Mode M9 | |||
|---|---|---|---|
| Quadrant | BADHDUFLAG | Total packets | Discarded packets |
| A | 0 | 22 | 0 |
| B | 0 | 22 | 0 |
| C | 0 | 22 | 0 |
| D | 0 | 23 | 0 |
| Quadrant | Total seconds | Saturated seconds | Saturation percentage |
|---|---|---|---|
| A | 5614 | 29 | 0.516566% |
| B | 5614 | 143 | 2.547203% |
| C | 5614 | 20 | 0.356252% |
| D | 5614 | 625 | 11.132882% |
Noise dominated data is calculated using 1-second bins in cleaned event files. If a bin has >2000 counts, and if more than 50% of those come from <1% of pixels, then it is considered to be noise-dominated and hence unusable.
| Quadrant | # 1 sec bins | Bins with >0 counts | Bins with >2000 counts | High rate bins dominated by noise | Noise dominated (total time) | Noise dominated (detector-on time) | Marked lightcurve |
|---|---|---|---|---|---|---|---|
| A | 7318 | 5615 | 9 | 9 | 0.12% | 0.16% | 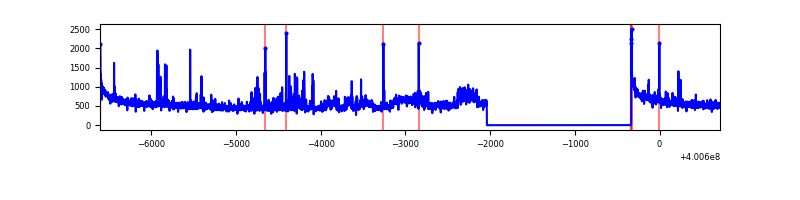 |
| B | 7317 | 5613 | 109 | 109 | 1.49% | 1.94% | 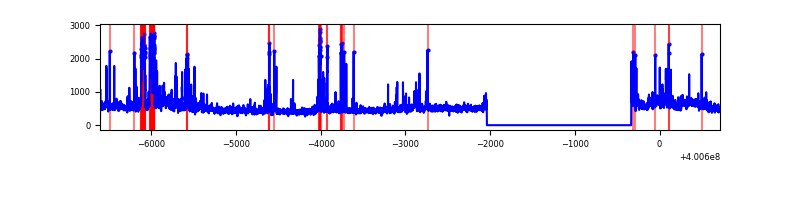 |
| C | 7317 | 5613 | 14 | 14 | 0.19% | 0.25% | 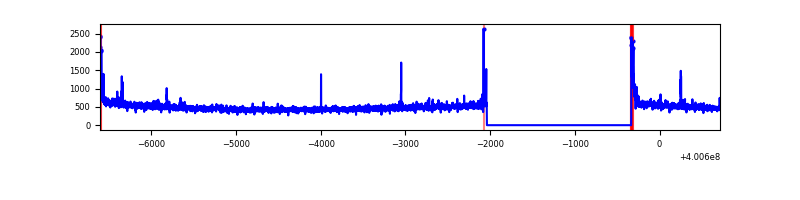 |
| D | 7317 | 5613 | 646 | 646 | 8.83% | 11.51% | 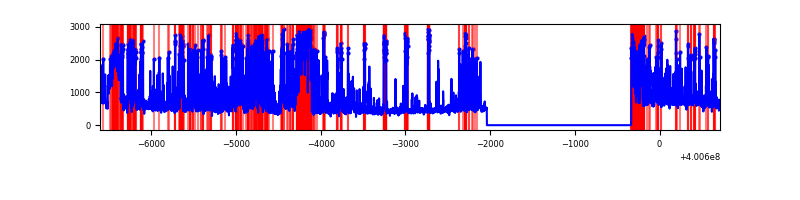 |
Top three noisy pixels from each quadrant. If the there are fewer than three noisy pixels in the level2.evt file, extra rows are filled as -1
| Pixel properties | Quadrant properties | ||||||
|---|---|---|---|---|---|---|---|
| Quadrant | DetID | PixID | Counts | Sigma | Mean | Median | Sigma |
| A | 10 | 83 | 349239 | 2650.04 | 649 | 636 | 131.5 |
| A | 6 | 10 | 269951 | 2047.3 | 649 | 636 | 131.5 |
| A | 9 | 143 | 49829 | 373.96 | 649 | 636 | 131.5 |
| B | 5 | 172 | 411210 | 3354.76 | 635 | 619 | 122.4 |
| B | 0 | 189 | 79036 | 640.71 | 635 | 619 | 122.4 |
| B | 4 | 80 | 60816 | 491.84 | 635 | 619 | 122.4 |
| C | 15 | 214 | 245336 | 1669.3 | 623 | 625 | 146.6 |
| C | 0 | 10 | 74423 | 503.42 | 623 | 625 | 146.6 |
| C | 15 | 208 | 21863 | 144.88 | 623 | 625 | 146.6 |
| D | 2 | 249 | 1072186 | 7211.9 | 601 | 582 | 148.6 |
| D | 12 | 233 | 571166 | 3840.04 | 601 | 582 | 148.6 |
| D | 10 | 204 | 395442 | 2657.41 | 601 | 582 | 148.6 |
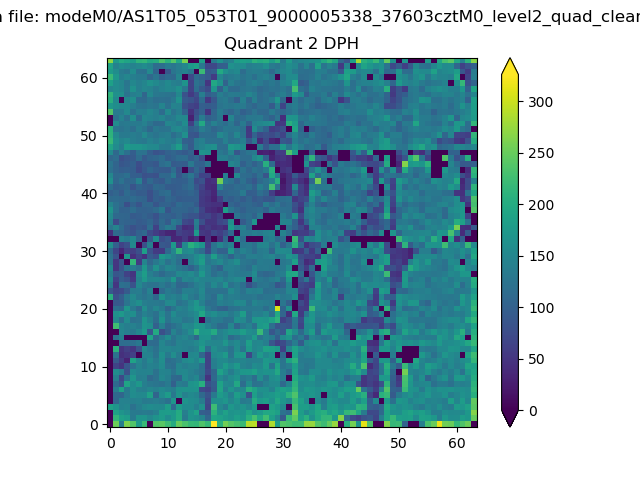
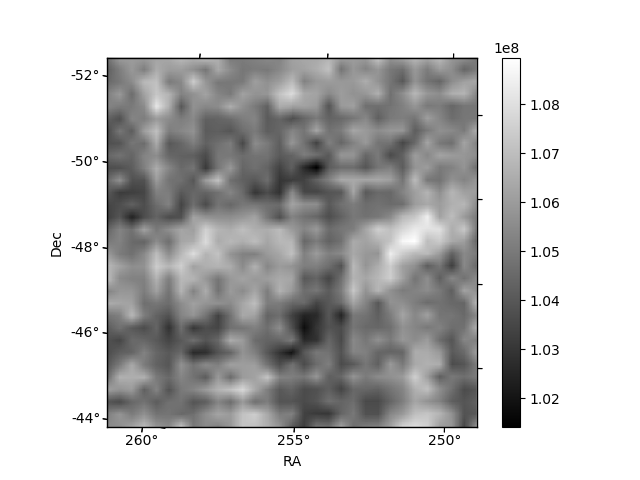
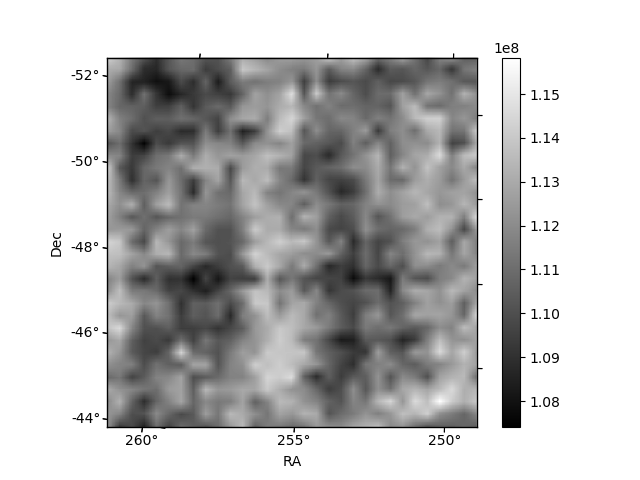
Histogram calculated using DETX and DETY for each event in the final _common_clean file
| Quadrant A | 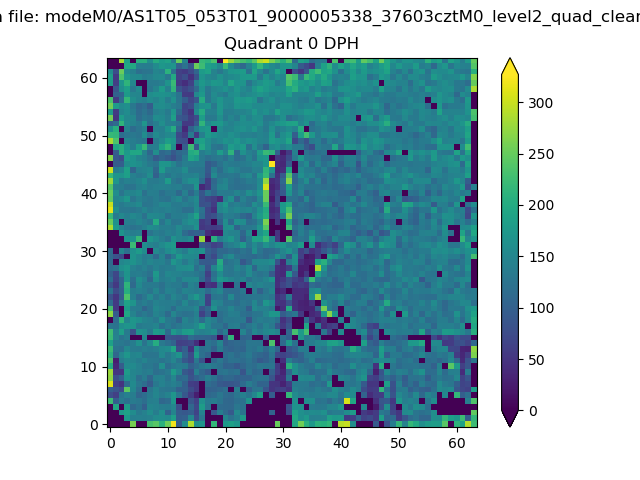 |
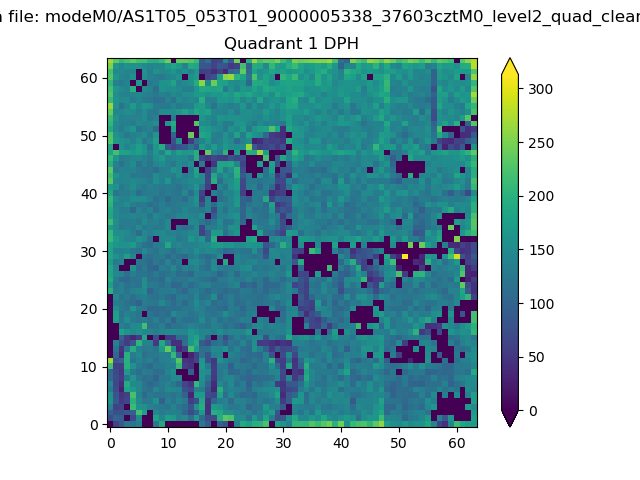 |
Quadrant B |
|---|---|---|---|
| Quadrant D | 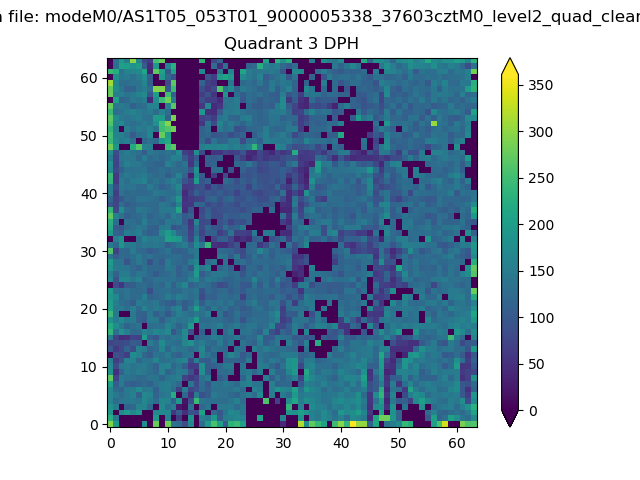 |
 |
Quadrant C |
| Plot type | Count rate plots | Images |
|---|---|---|
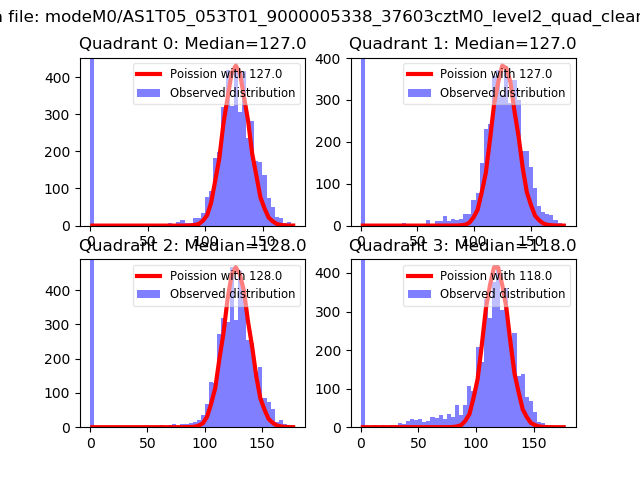
| Comparison with Poisson distribution Blue bars denote a histogram of data divided into 1 sec bins. Red curve is a Poisson curve with rate = median count rate of data. |
 |
 |
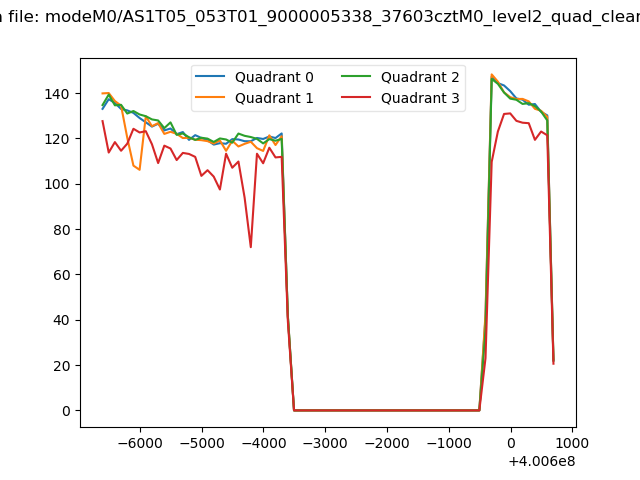
| Quadrant-wise count rates Data is divided into 100 sec bins |
 |
|
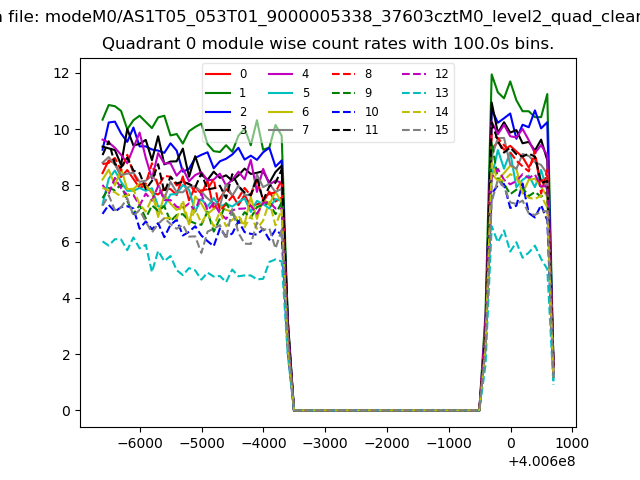
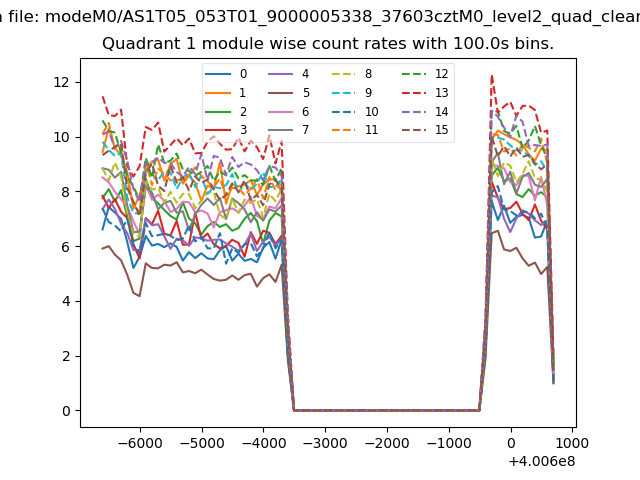
| Module-wise count rates for Quadrant A Data is divided into 100 sec bins |
 |
 |
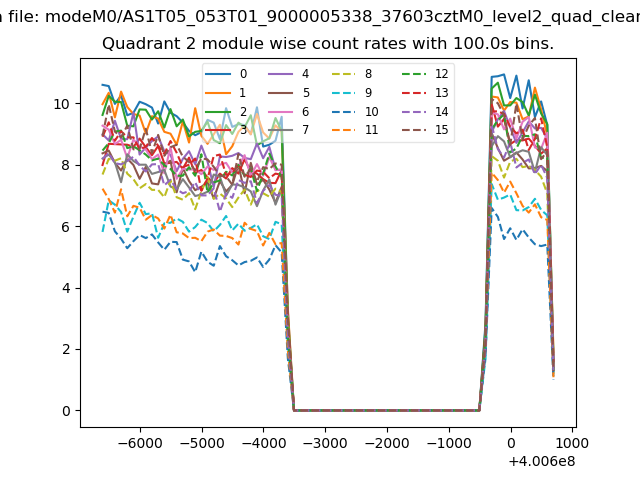
| Module-wise count rates for Quadrant B Data is divided into 100 sec bins |
 |
 |
| Module-wise count rates for Quadrant C Data is divided into 100 sec bins |
 |
 |
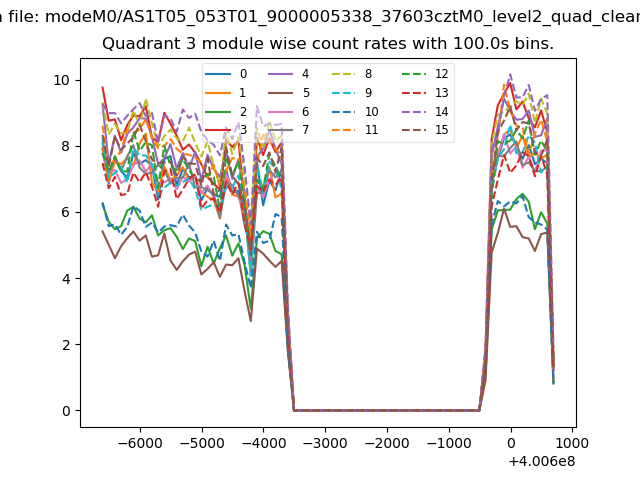
| Module-wise count rates for Quadrant D Data is divided into 100 sec bins |
 |
 |
| Parameter | Plot |
|---|---|
| CZT HV Monitor |  |
| D_VDD | 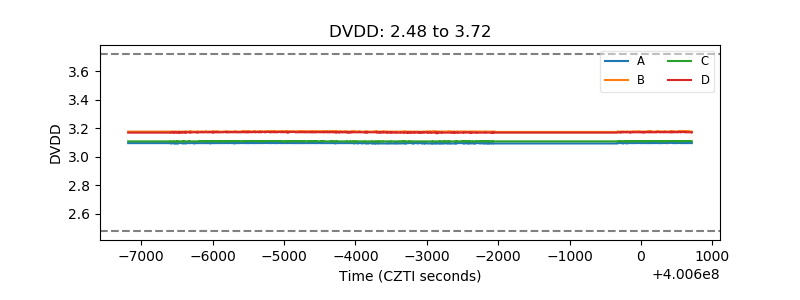 |
| Temperature 1 | 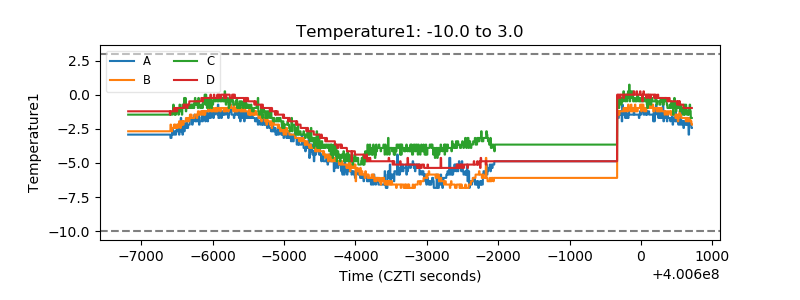 |
| Veto HV Monitor | 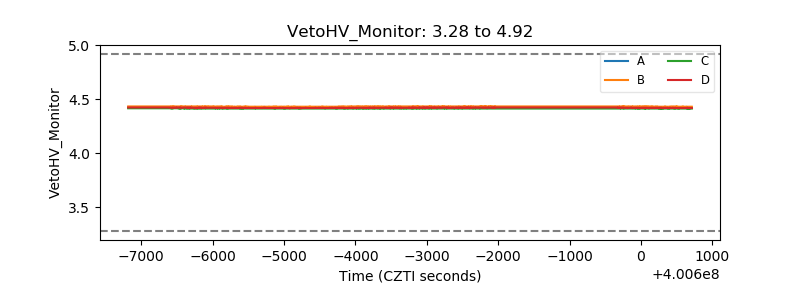 |
| Veto LLD | 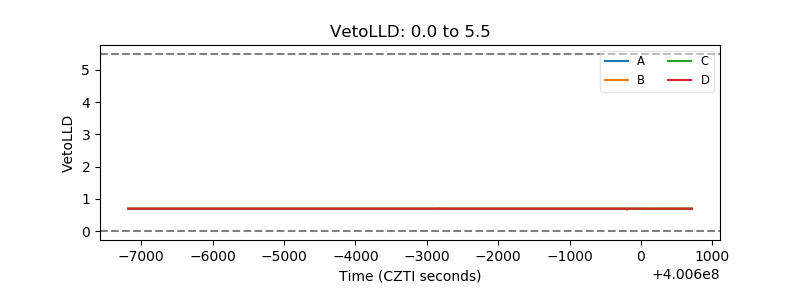 |
| Alpha Counter | 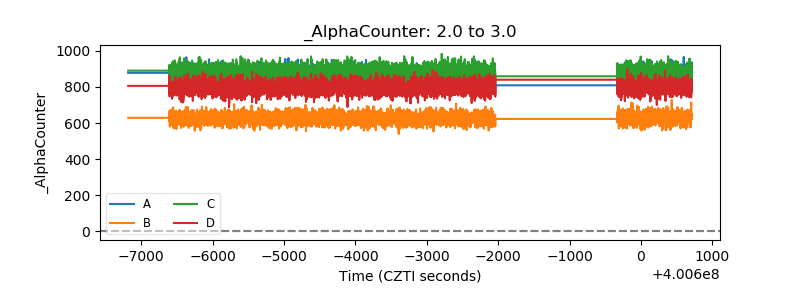 |
| _CPM_Rate | 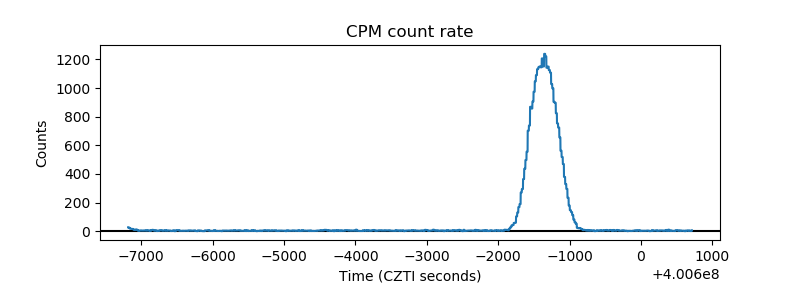 |
| CZT Counter | 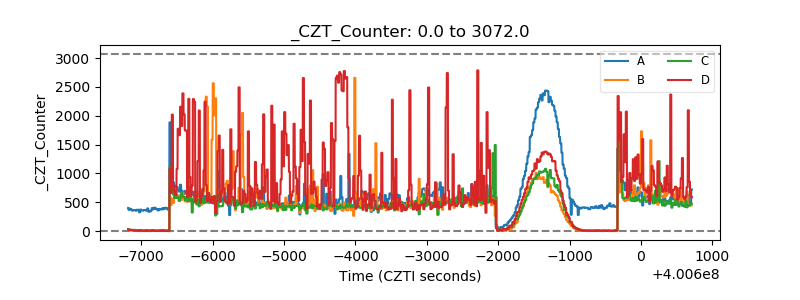 |
| +2.5 Volts monitor |  |
| +5 Volts monitor | 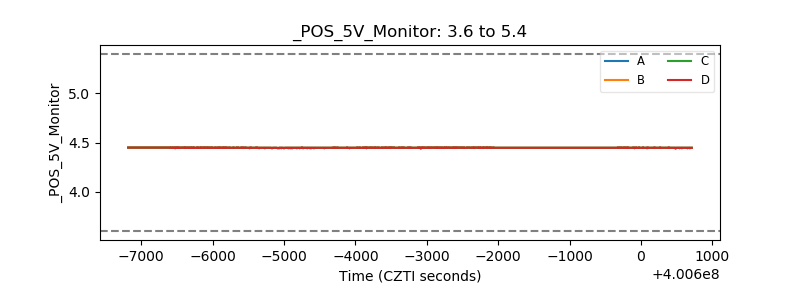 |
| _ROLL_ROT | 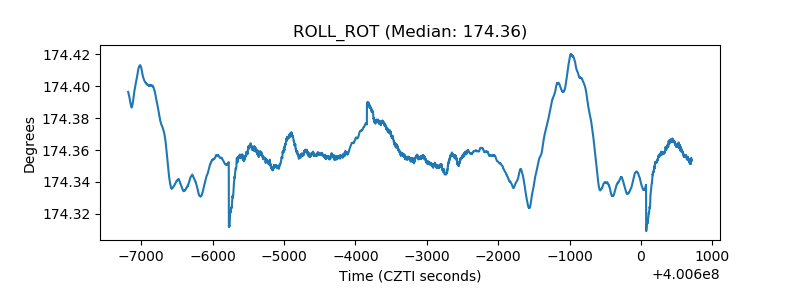 |
| _Roll_DEC | 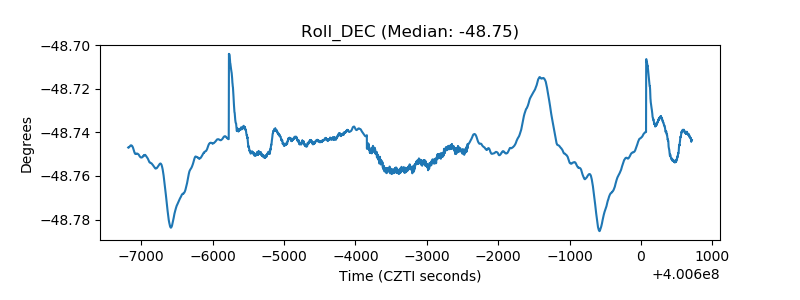 |
| _Roll_RA | 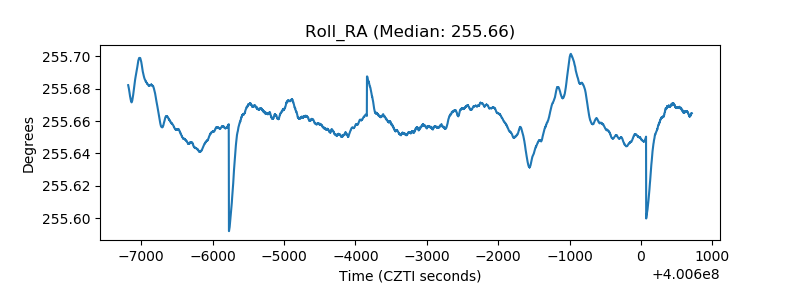 |
| Veto Counter | 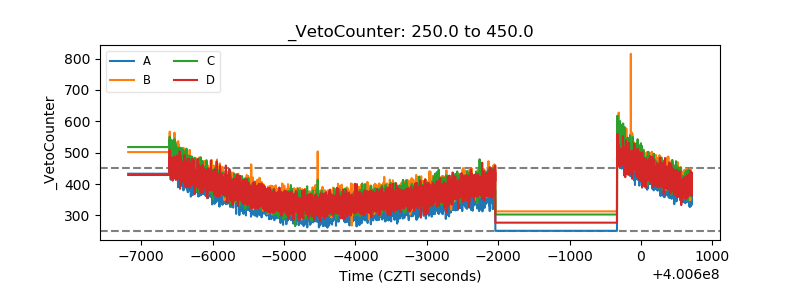 |