| Param | Original file | Final file |
|---|---|---|
| Filename | modeM0/AS1T05_053T01_9000005338_37605cztM0_level2.evt | modeM0/AS1T05_053T01_9000005338_37605cztM0_level2_quad_clean.evt |
| Size (bytes) | 436,409,280 | 72,478,080 |
| Size | 416.2 MB | 69.1 MB |
| Events in quadrant A | 2,868,962 | 467,149 |
| Events in quadrant B | 3,225,517 | 466,802 |
| Events in quadrant C | 2,766,991 | 461,718 |
| Events in quadrant D | 3,992,676 | 425,107 |
| Mode SS | |||
|---|---|---|---|
| Quadrant | BADHDUFLAG | Total packets | Discarded packets |
| A | 0 | 108 | 0 |
| B | 0 | 108 | 0 |
| C | 0 | 108 | 0 |
| D | 0 | 108 | 0 |
| Mode M0 | |||
|---|---|---|---|
| Quadrant | BADHDUFLAG | Total packets | Discarded packets |
| A | 0 | 11878 | 3 |
| B | 0 | 13185 | 2 |
| C | 0 | 11530 | 2 |
| D | 0 | 15439 | 2 |
| Mode M9 | |||
|---|---|---|---|
| Quadrant | BADHDUFLAG | Total packets | Discarded packets |
| A | 0 | 28 | 0 |
| B | 0 | 28 | 0 |
| C | 0 | 28 | 0 |
| D | 0 | 29 | 0 |
| Quadrant | Total seconds | Saturated seconds | Saturation percentage |
|---|---|---|---|
| A | 5341 | 21 | 0.393185% |
| B | 5341 | 110 | 2.059539% |
| C | 5341 | 50 | 0.936154% |
| D | 5341 | 279 | 5.223741% |
Noise dominated data is calculated using 1-second bins in cleaned event files. If a bin has >2000 counts, and if more than 50% of those come from <1% of pixels, then it is considered to be noise-dominated and hence unusable.
| Quadrant | # 1 sec bins | Bins with >0 counts | Bins with >2000 counts | High rate bins dominated by noise | Noise dominated (total time) | Noise dominated (detector-on time) | Marked lightcurve |
|---|---|---|---|---|---|---|---|
| A | 7162 | 5342 | 12 | 12 | 0.17% | 0.22% | 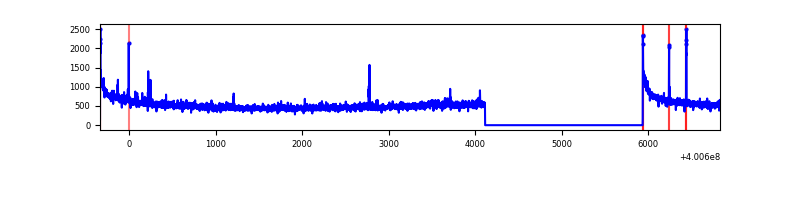 |
| B | 7161 | 5340 | 89 | 89 | 1.24% | 1.67% | 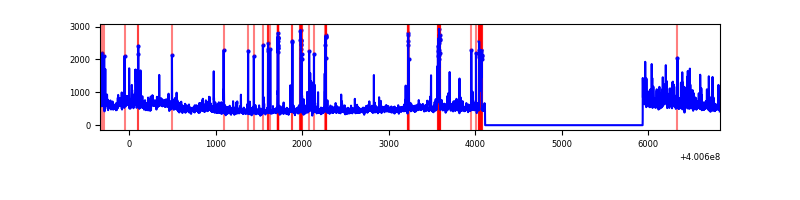 |
| C | 7161 | 5341 | 52 | 52 | 0.73% | 0.97% | 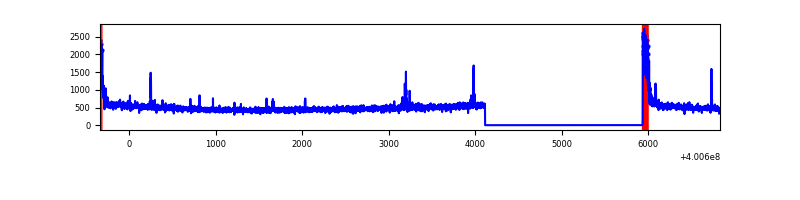 |
| D | 7161 | 5341 | 280 | 280 | 3.91% | 5.24% | 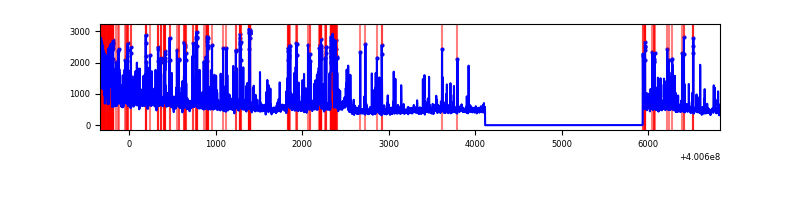 |
Top three noisy pixels from each quadrant. If the there are fewer than three noisy pixels in the level2.evt file, extra rows are filled as -1
| Pixel properties | Quadrant properties | ||||||
|---|---|---|---|---|---|---|---|
| Quadrant | DetID | PixID | Counts | Sigma | Mean | Median | Sigma |
| A | 10 | 83 | 346570 | 2722.5 | 624 | 611 | 127.1 |
| A | 12 | 189 | 31465 | 242.8 | 624 | 611 | 127.1 |
| A | 9 | 143 | 25005 | 191.97 | 624 | 611 | 127.1 |
| B | 5 | 172 | 210063 | 1799.83 | 616 | 604 | 116.4 |
| B | 4 | 171 | 139193 | 1190.86 | 616 | 604 | 116.4 |
| B | 5 | 200 | 113867 | 973.24 | 616 | 604 | 116.4 |
| C | 15 | 214 | 232792 | 1673.81 | 595 | 598 | 138.7 |
| C | 0 | 10 | 165523 | 1188.89 | 595 | 598 | 138.7 |
| C | 14 | 254 | 28513 | 201.23 | 595 | 598 | 138.7 |
| D | 10 | 204 | 371004 | 2571.67 | 584 | 565 | 144.0 |
| D | 12 | 233 | 315478 | 2186.19 | 584 | 565 | 144.0 |
| D | 2 | 249 | 288466 | 1998.67 | 584 | 565 | 144.0 |
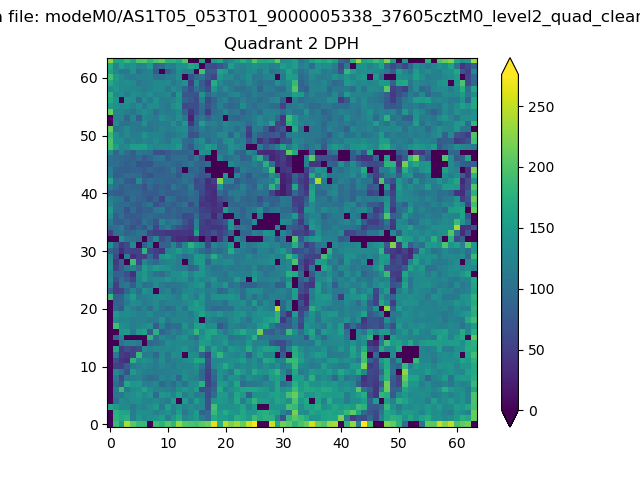
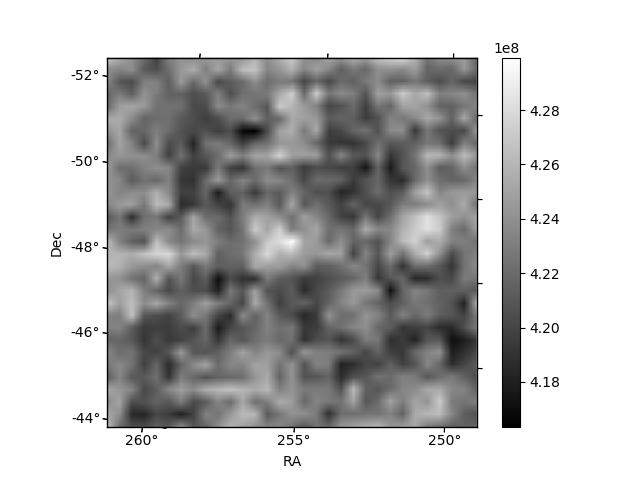
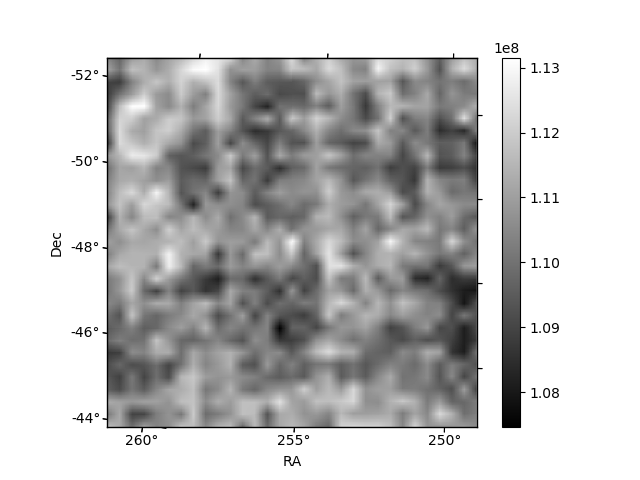
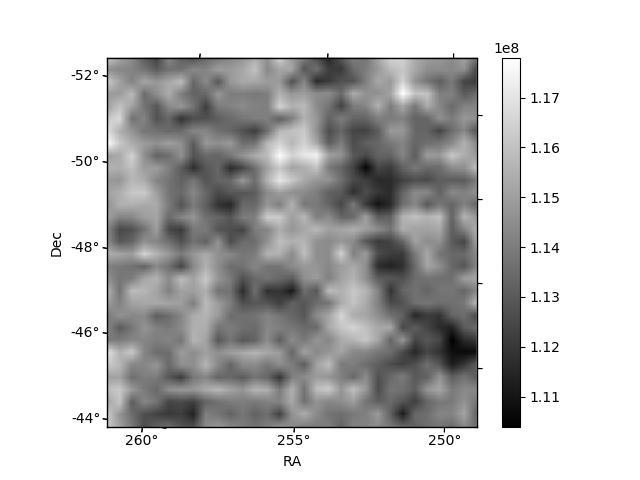
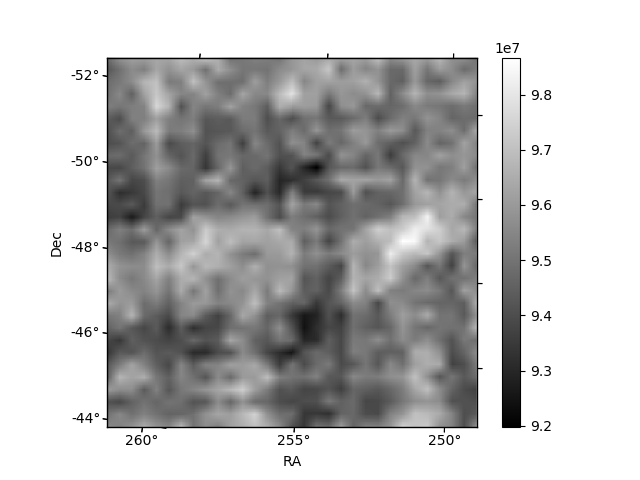
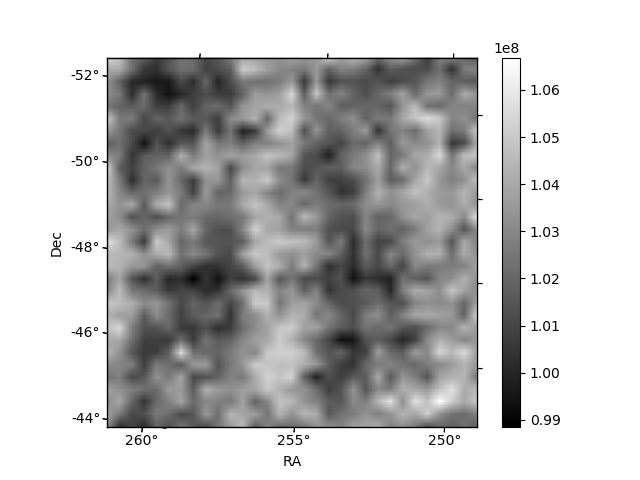
Histogram calculated using DETX and DETY for each event in the final _common_clean file
| Quadrant A | 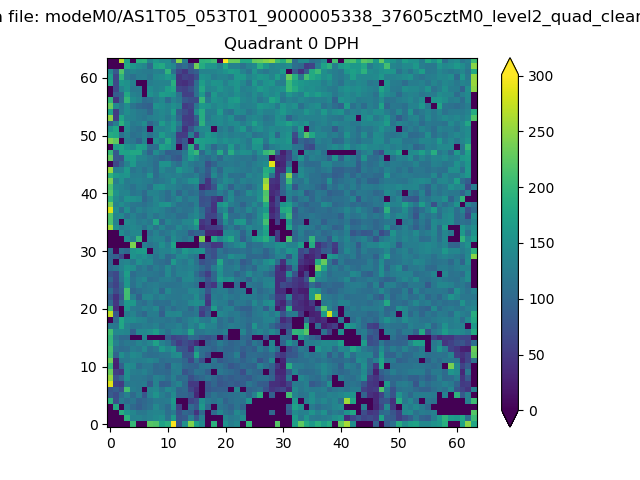 |
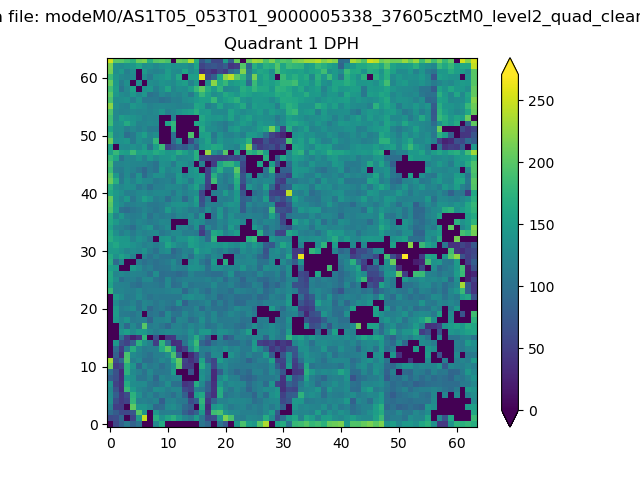 |
Quadrant B |
|---|---|---|---|
| Quadrant D | 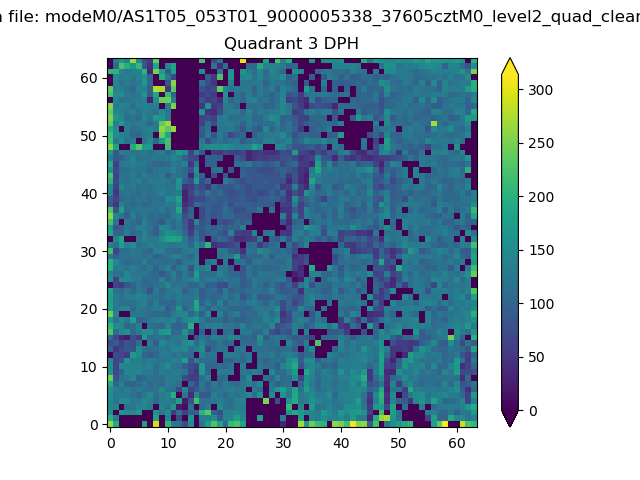 |
 |
Quadrant C |
| Plot type | Count rate plots | Images |
|---|---|---|
| Comparison with Poisson distribution Blue bars denote a histogram of data divided into 1 sec bins. Red curve is a Poisson curve with rate = median count rate of data. |
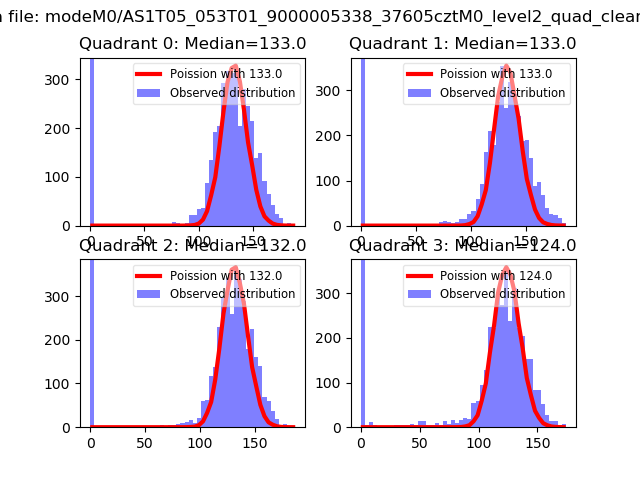 |
 |
| Quadrant-wise count rates Data is divided into 100 sec bins |
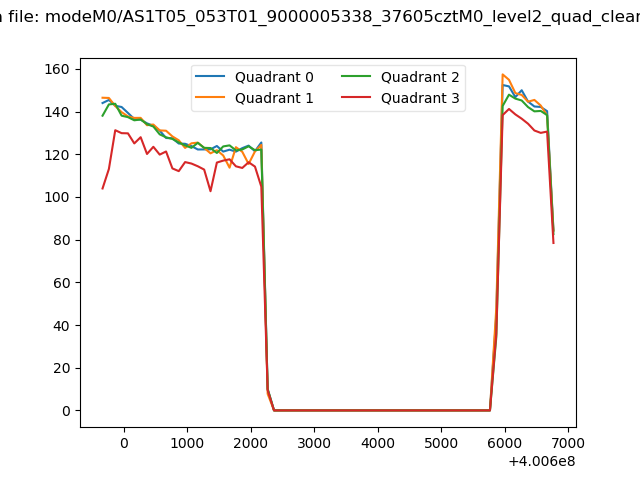 |
|
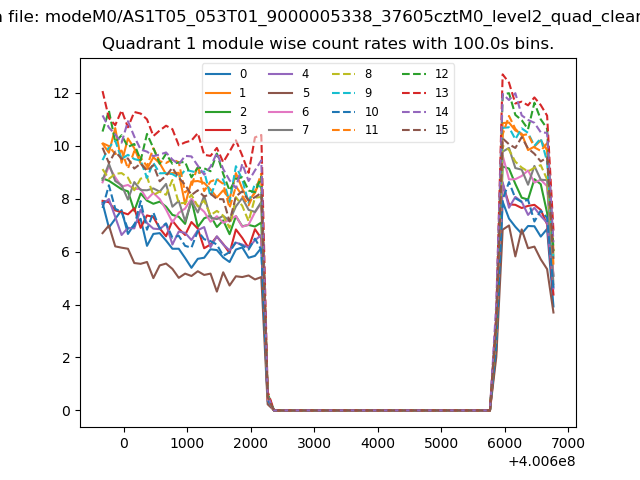
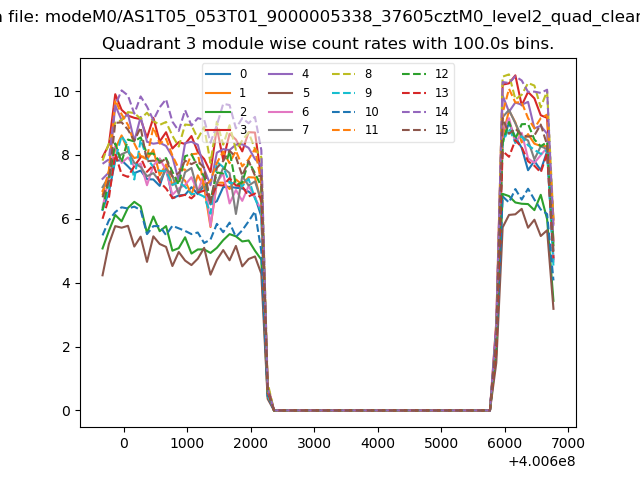
| Module-wise count rates for Quadrant A Data is divided into 100 sec bins |
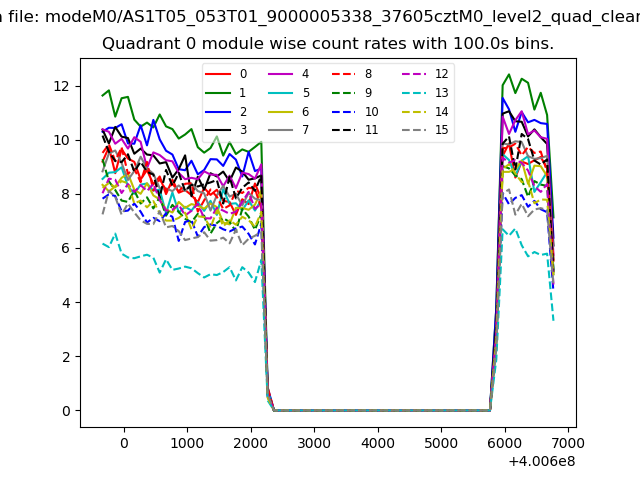 |
 |
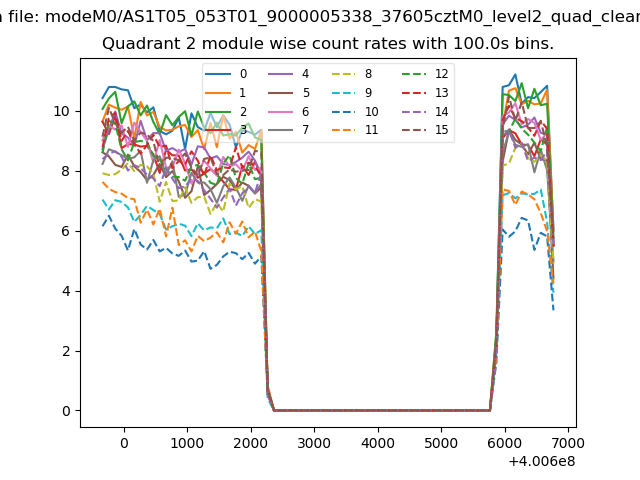
| Module-wise count rates for Quadrant B Data is divided into 100 sec bins |
 |
 |
| Module-wise count rates for Quadrant C Data is divided into 100 sec bins |
 |
 |
| Module-wise count rates for Quadrant D Data is divided into 100 sec bins |
 |
 |
| Parameter | Plot |
|---|---|
| CZT HV Monitor | 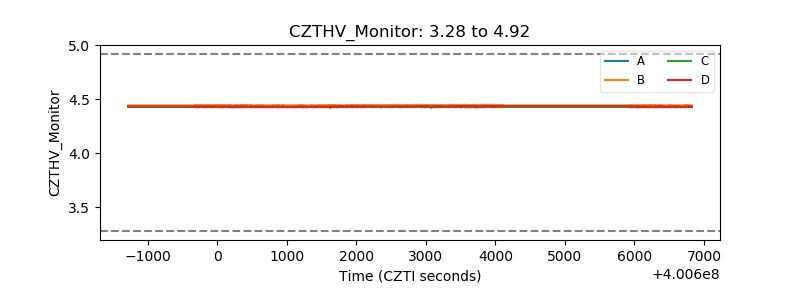 |
| D_VDD | 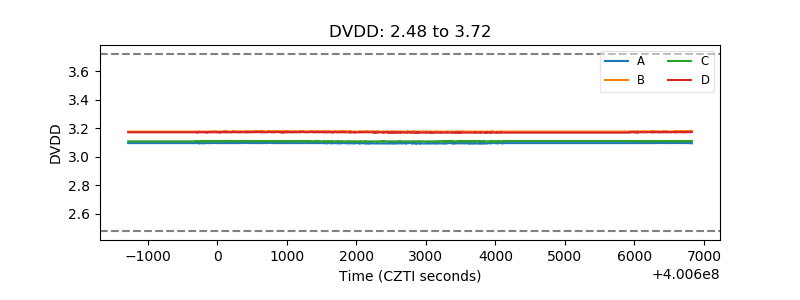 |
| Temperature 1 | 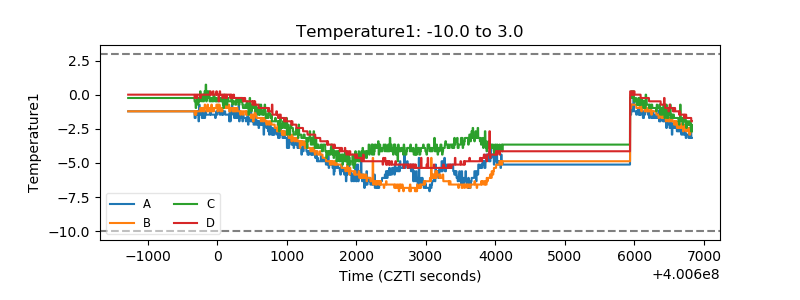 |
| Veto HV Monitor | 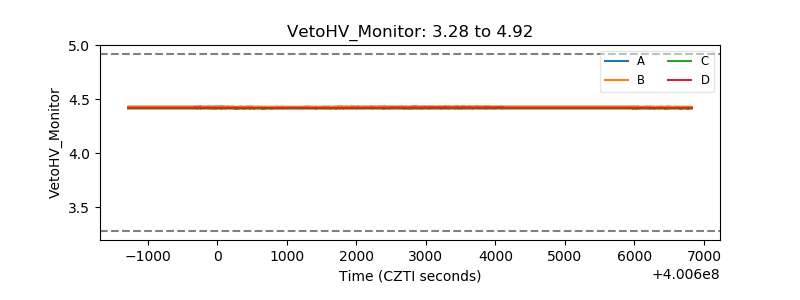 |
| Veto LLD | 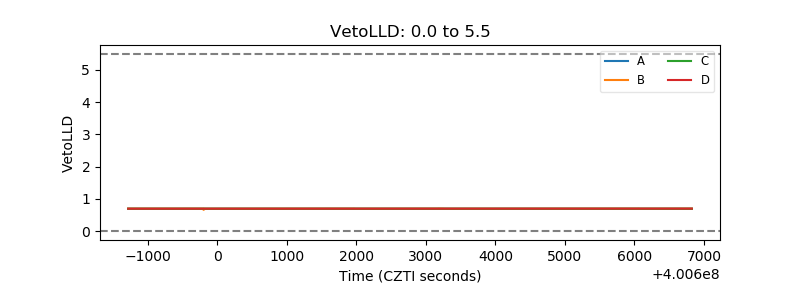 |
| Alpha Counter | 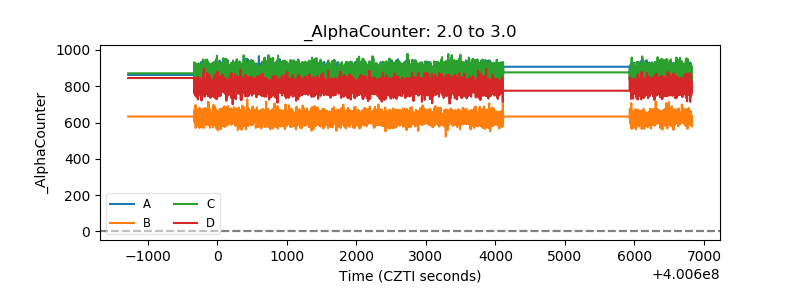 |
| _CPM_Rate | 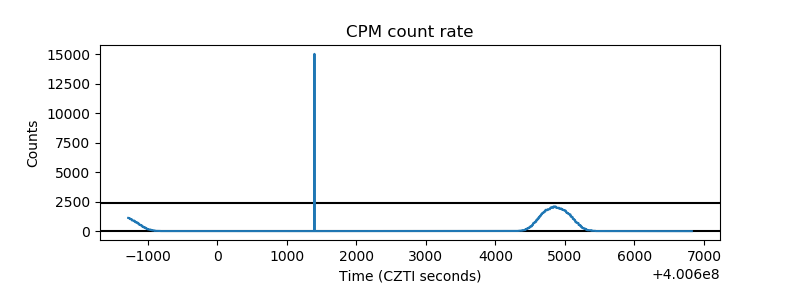 |
| CZT Counter | 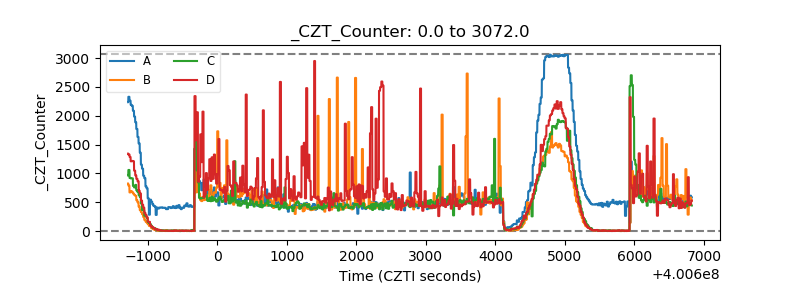 |
| +2.5 Volts monitor | 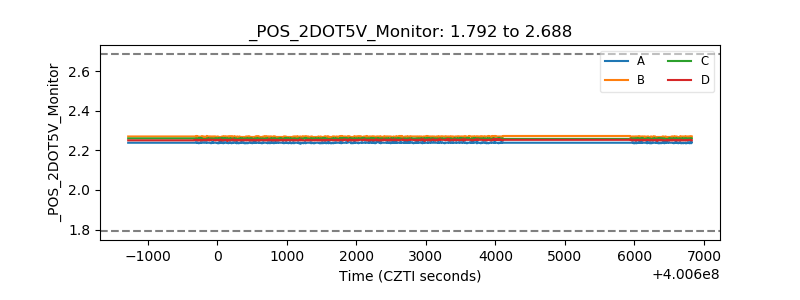 |
| +5 Volts monitor | 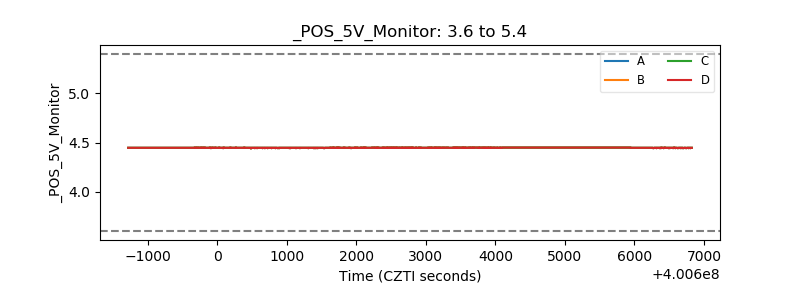 |
| _ROLL_ROT | 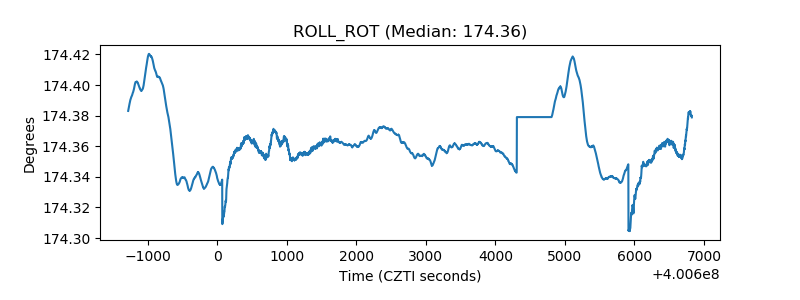 |
| _Roll_DEC | 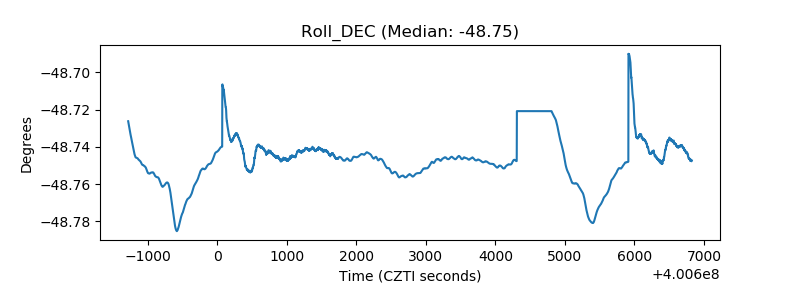 |
| _Roll_RA | 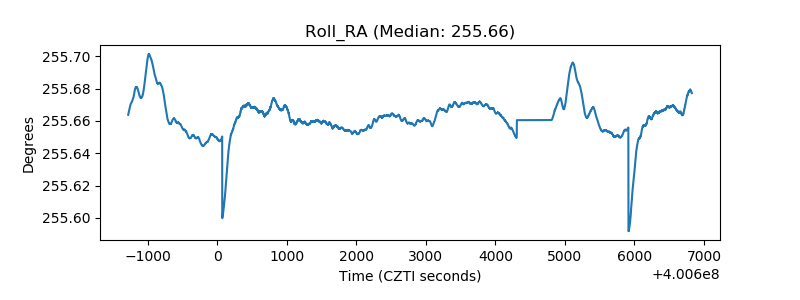 |
| Veto Counter | 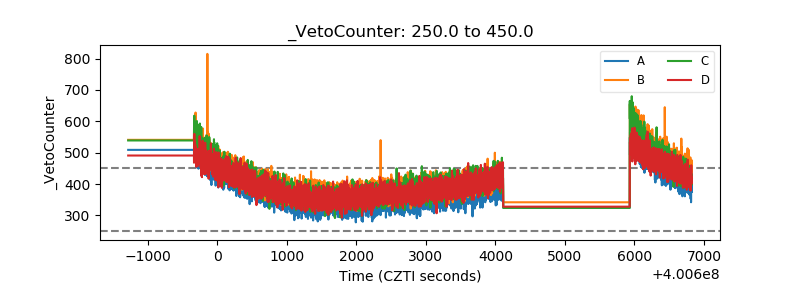 |