| Param | Original file | Final file |
|---|---|---|
| Filename | modeM0/AS1T05_053T01_9000005338_37606cztM0_level2.evt | modeM0/AS1T05_053T01_9000005338_37606cztM0_level2_quad_clean.evt |
| Size (bytes) | 103,219,200 | 24,482,880 |
| Size | 98.4 MB | 23.3 MB |
| Events in quadrant A | 724,701 | 167,402 |
| Events in quadrant B | 851,447 | 167,335 |
| Events in quadrant C | 706,301 | 162,984 |
| Events in quadrant D | 761,536 | 154,871 |
| Mode SS | |||
|---|---|---|---|
| Quadrant | BADHDUFLAG | Total packets | Discarded packets |
| A | 0 | 22 | 0 |
| B | 0 | 22 | 0 |
| C | 0 | 22 | 0 |
| D | 0 | 22 | 0 |
| Mode M0 | |||
|---|---|---|---|
| Quadrant | BADHDUFLAG | Total packets | Discarded packets |
| A | 0 | 2876 | 1 |
| B | 0 | 3368 | 1 |
| C | 0 | 2791 | 1 |
| D | 0 | 3032 | 1 |
| Mode M9 | |||
|---|---|---|---|
| Quadrant | BADHDUFLAG | Total packets | Discarded packets |
| A | 0 | 11 | 0 |
| B | 0 | 11 | 0 |
| C | 0 | 11 | 0 |
| D | 0 | 12 | 0 |
| Quadrant | Total seconds | Saturated seconds | Saturation percentage |
|---|---|---|---|
| A | 1170 | 11 | 0.940171% |
| B | 1170 | 16 | 1.367521% |
| C | 1170 | 38 | 3.247863% |
| D | 1170 | 27 | 2.307692% |
Noise dominated data is calculated using 1-second bins in cleaned event files. If a bin has >2000 counts, and if more than 50% of those come from <1% of pixels, then it is considered to be noise-dominated and hence unusable.
| Quadrant | # 1 sec bins | Bins with >0 counts | Bins with >2000 counts | High rate bins dominated by noise | Noise dominated (total time) | Noise dominated (detector-on time) | Marked lightcurve |
|---|---|---|---|---|---|---|---|
| A | 1170 | 1170 | 8 | 8 | 0.68% | 0.68% |  |
| B | 1169 | 1169 | 15 | 15 | 1.28% | 1.28% |  |
| C | 1170 | 1170 | 44 | 44 | 3.76% | 3.76% |  |
| D | 1170 | 1170 | 28 | 28 | 2.39% | 2.39% |  |
Top three noisy pixels from each quadrant. If the there are fewer than three noisy pixels in the level2.evt file, extra rows are filled as -1
| Pixel properties | Quadrant properties | ||||||
|---|---|---|---|---|---|---|---|
| Quadrant | DetID | PixID | Counts | Sigma | Mean | Median | Sigma |
| A | 10 | 83 | 123906 | 3949.02 | 146 | 143 | 31.3 |
| A | 13 | 6 | 10446 | 328.75 | 146 | 143 | 31.3 |
| A | 6 | 10 | 10127 | 318.57 | 146 | 143 | 31.3 |
| B | 4 | 171 | 87170 | 2996.86 | 143 | 141 | 29.0 |
| B | 5 | 172 | 61096 | 2099.0 | 143 | 141 | 29.0 |
| B | 0 | 230 | 39757 | 1364.18 | 143 | 141 | 29.0 |
| C | 0 | 10 | 118761 | 3573.16 | 134 | 135 | 33.2 |
| C | 15 | 214 | 53679 | 1612.81 | 134 | 135 | 33.2 |
| C | 14 | 254 | 7301 | 215.85 | 134 | 135 | 33.2 |
| D | 12 | 233 | 67254 | 1922.84 | 137 | 133 | 34.9 |
| D | 10 | 199 | 40124 | 1145.64 | 137 | 133 | 34.9 |
| D | 2 | 249 | 36468 | 1040.9 | 137 | 133 | 34.9 |
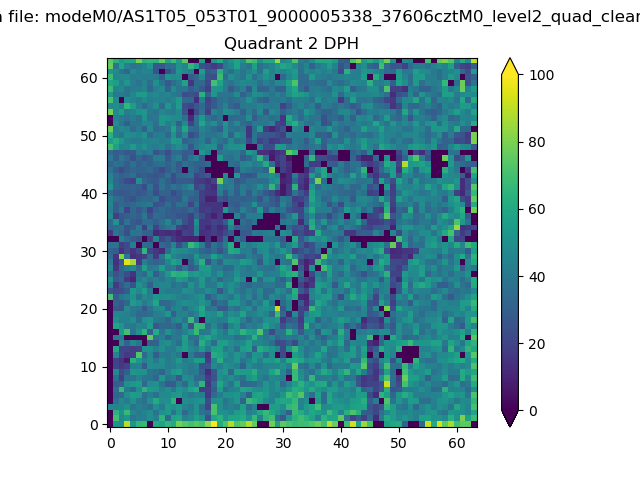
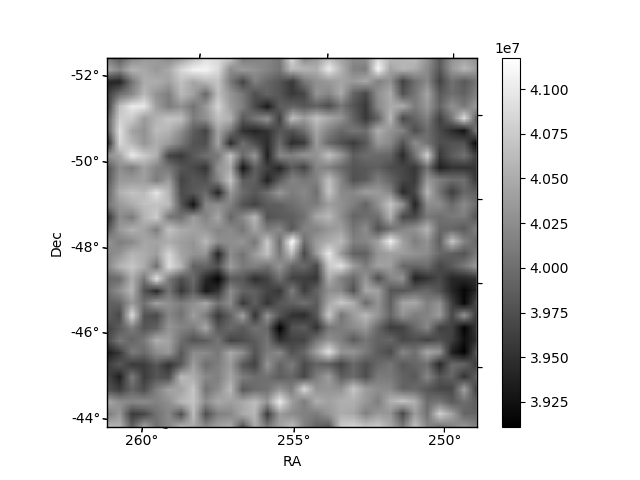
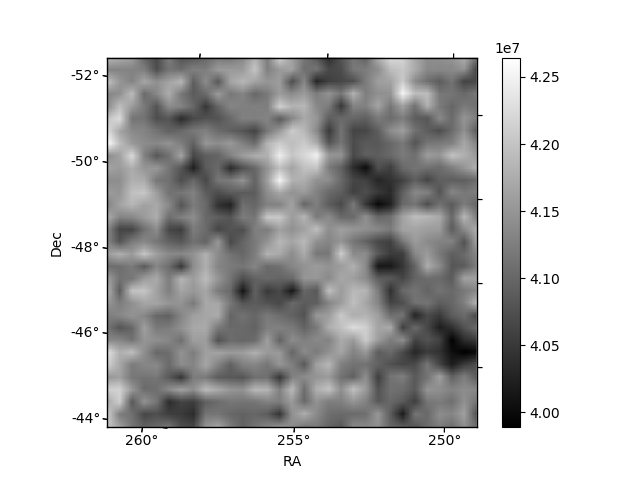
Histogram calculated using DETX and DETY for each event in the final _common_clean file
| Quadrant A | 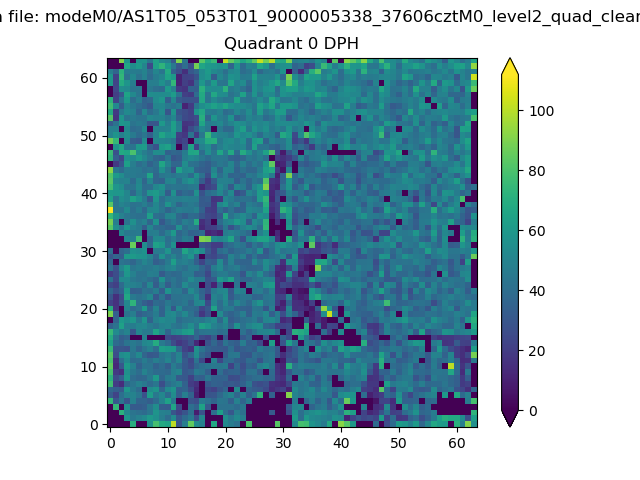 |
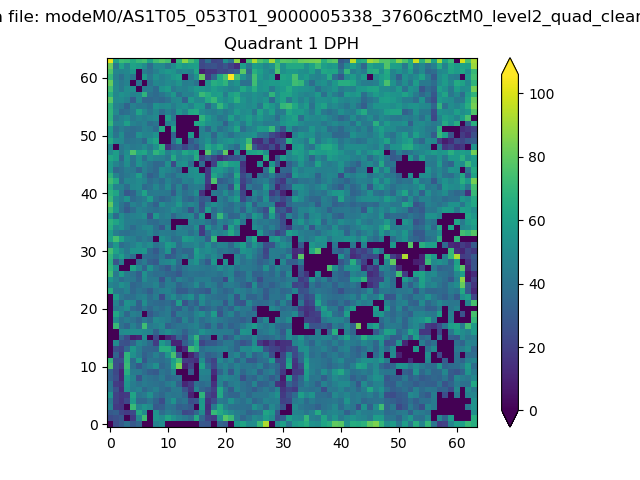 |
Quadrant B |
|---|---|---|---|
| Quadrant D | 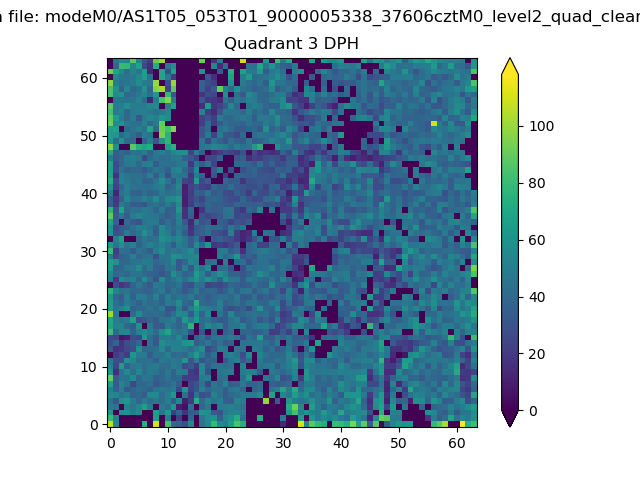 |
 |
Quadrant C |
| Plot type | Count rate plots | Images |
|---|---|---|
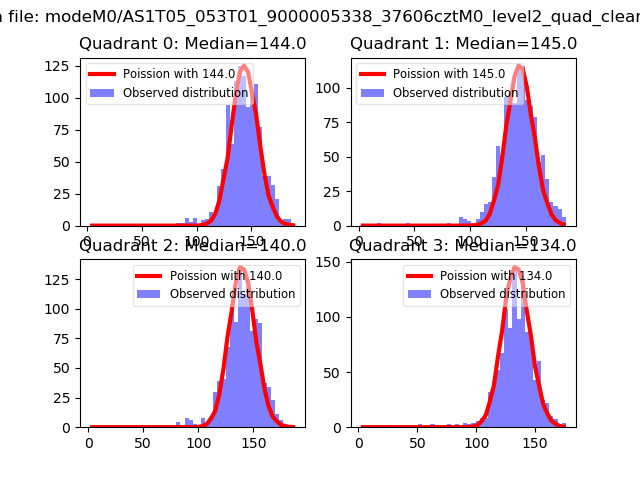
| Comparison with Poisson distribution Blue bars denote a histogram of data divided into 1 sec bins. Red curve is a Poisson curve with rate = median count rate of data. |
 |
 |
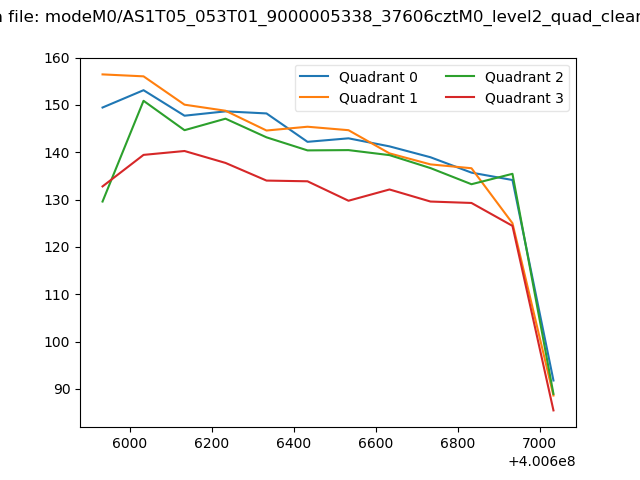
| Quadrant-wise count rates Data is divided into 100 sec bins |
 |
|
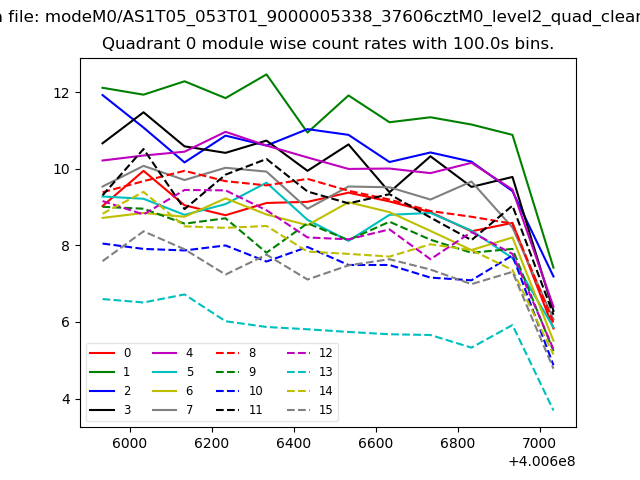
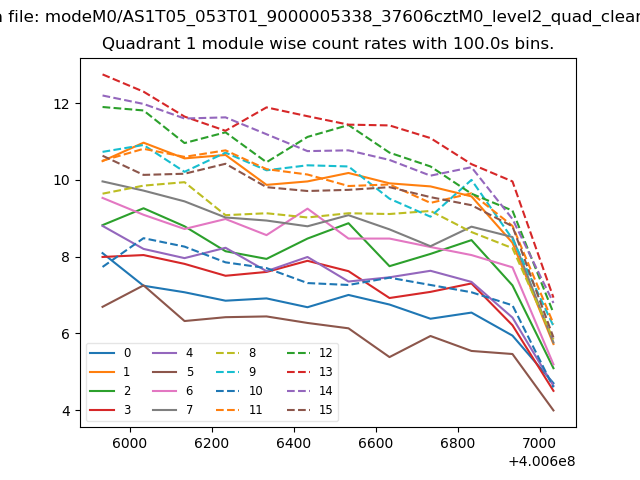
| Module-wise count rates for Quadrant A Data is divided into 100 sec bins |
 |
 |
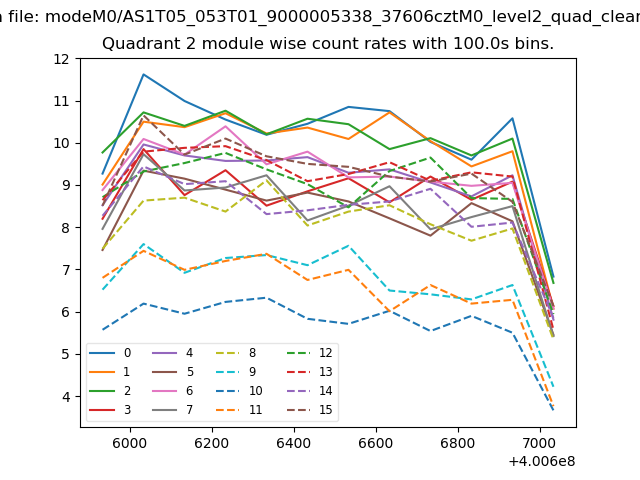
| Module-wise count rates for Quadrant B Data is divided into 100 sec bins |
 |
 |
| Module-wise count rates for Quadrant C Data is divided into 100 sec bins |
 |
 |
| Module-wise count rates for Quadrant D Data is divided into 100 sec bins |
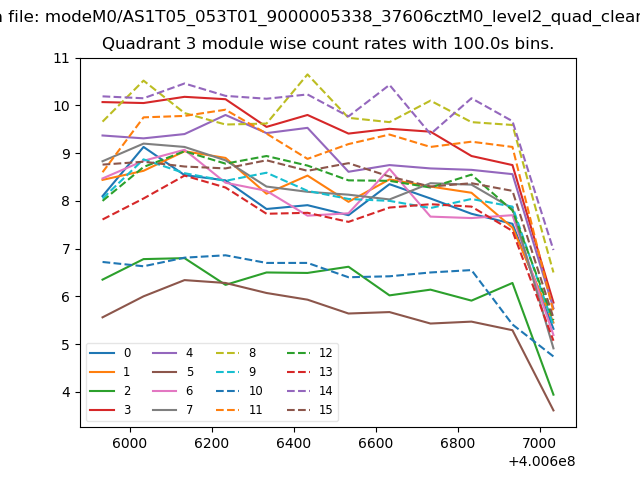 |
 |
| Parameter | Plot |
|---|---|
| CZT HV Monitor | 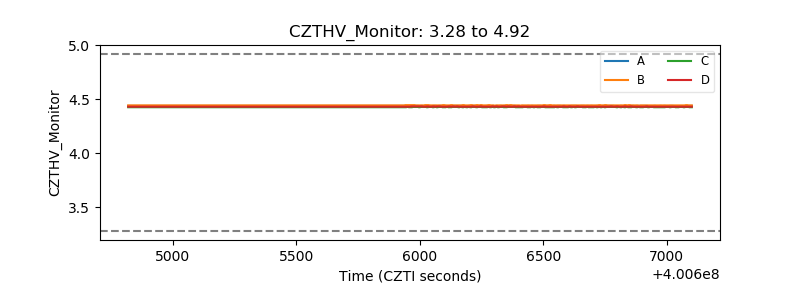 |
| D_VDD | 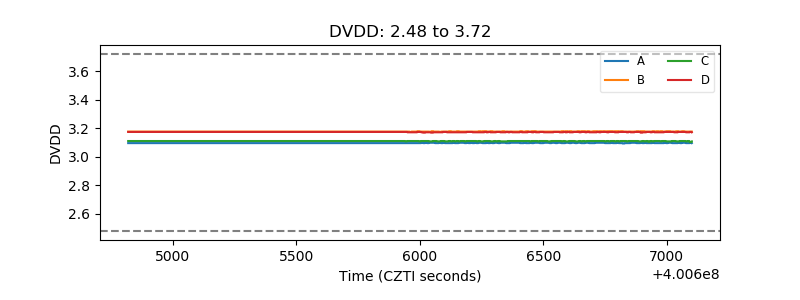 |
| Temperature 1 | 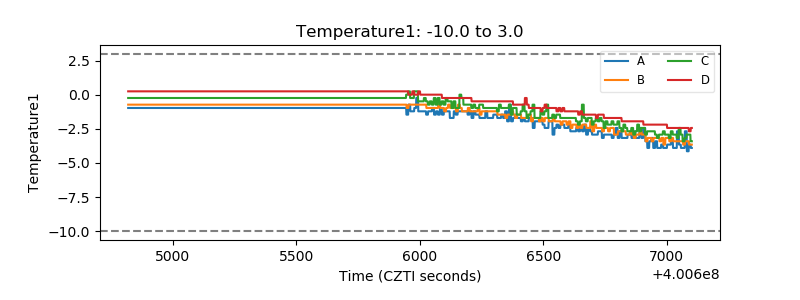 |
| Veto HV Monitor | 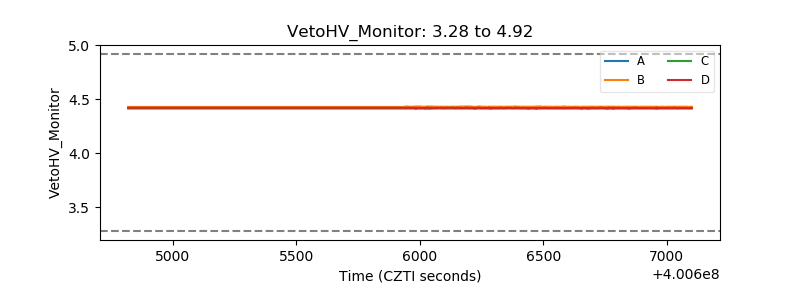 |
| Veto LLD | 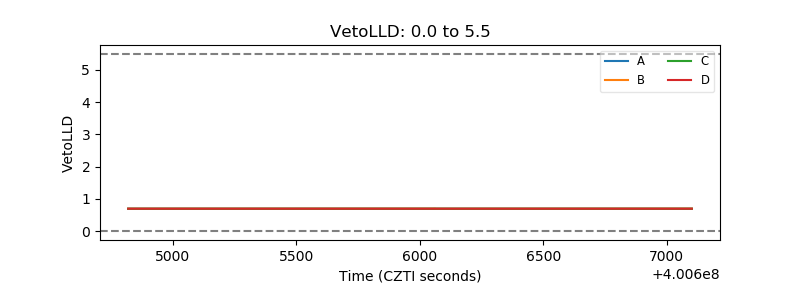 |
| Alpha Counter | 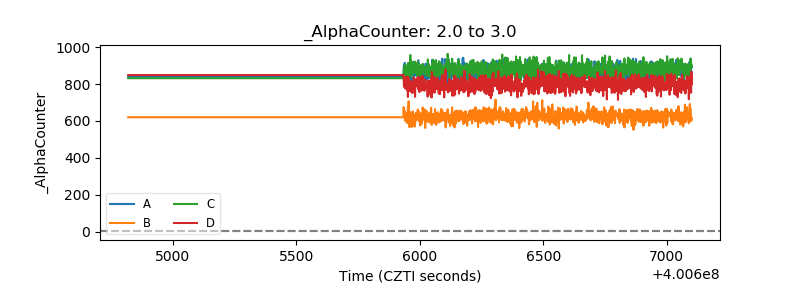 |
| _CPM_Rate | 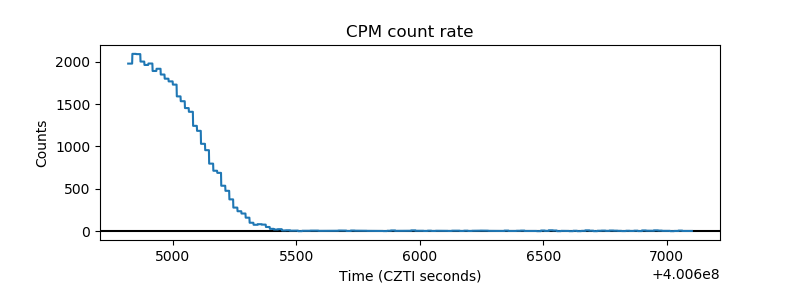 |
| CZT Counter | 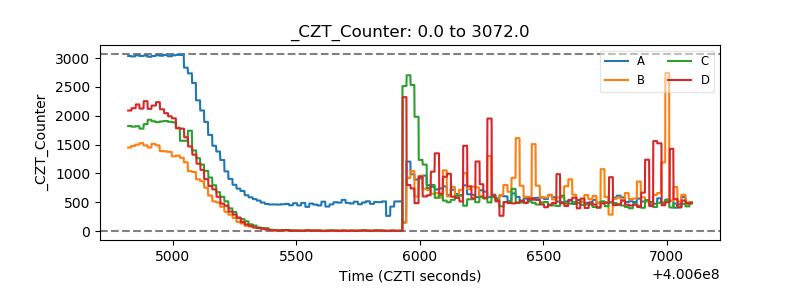 |
| +2.5 Volts monitor | 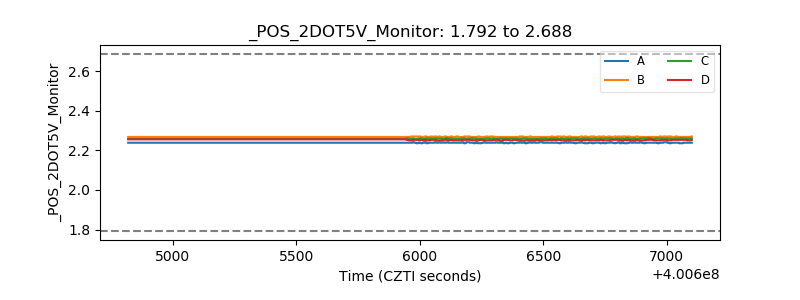 |
| +5 Volts monitor | 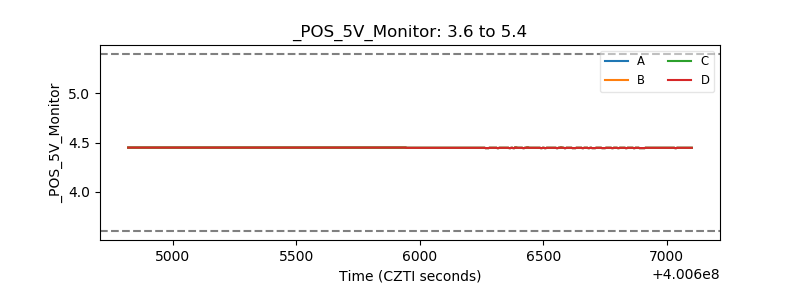 |
| _ROLL_ROT | 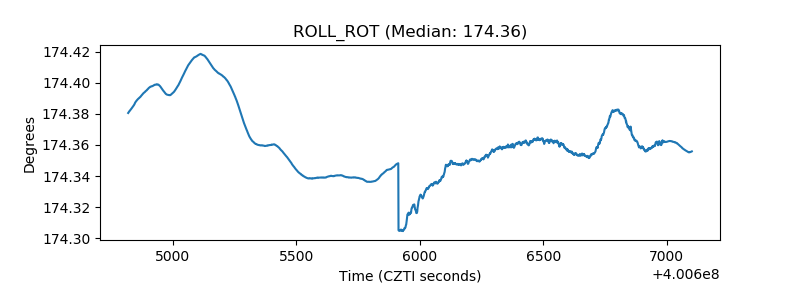 |
| _Roll_DEC | 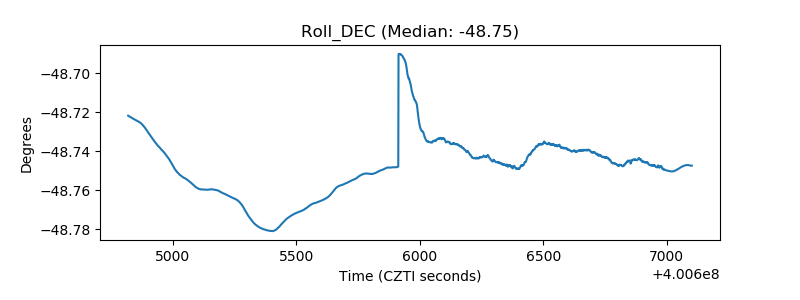 |
| _Roll_RA | 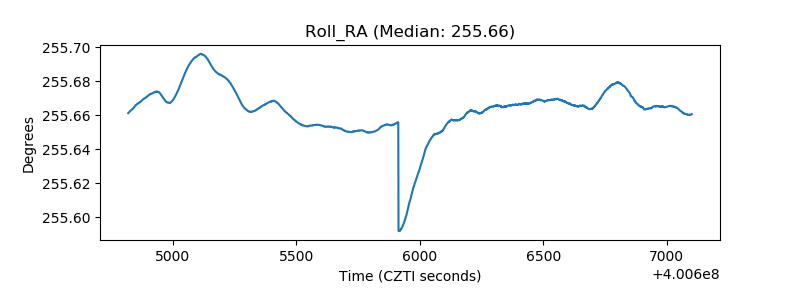 |
| Veto Counter | 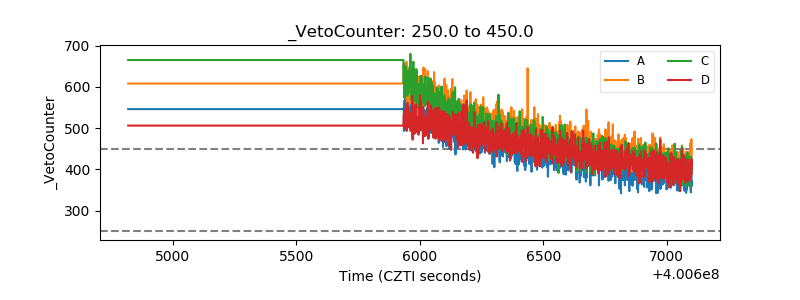 |