| Param | Original file | Final file |
|---|---|---|
| Filename | modeM0/AS1A07_093T23_9000005340cztM0_level2.fits | modeM0/AS1A07_093T23_9000005340cztM0_level2_quad_clean.evt |
| Size (bytes) | 69,891,840 | 60,413,760 |
| Size | 66.7 MB | 57.6 MB |
| Events in quadrant A | 436,284 | 355,068 |
| Events in quadrant B | 413,686 | 356,851 |
| Events in quadrant C | 419,264 | 332,847 |
| Events in quadrant D | 350,278 | 286,876 |
| Mode SS | |||
|---|---|---|---|
| Quadrant | BADHDUFLAG | Total packets | Discarded packets |
| A | 0 | 146 | 0 |
| B | 0 | 146 | 0 |
| C | 0 | 146 | 0 |
| D | 0 | 146 | 0 |
| Mode M0 | |||
|---|---|---|---|
| Quadrant | BADHDUFLAG | Total packets | Discarded packets |
| A | 0 | 15327 | 0 |
| B | 0 | 15946 | 0 |
| C | 0 | 14924 | 0 |
| D | 0 | 19713 | 0 |
| Mode M9 | |||
|---|---|---|---|
| Quadrant | BADHDUFLAG | Total packets | Discarded packets |
| A | 0 | 40 | 0 |
| B | 0 | 40 | 0 |
| C | 0 | 40 | 0 |
| D | 0 | 40 | 0 |
| Quadrant | Total seconds | Saturated seconds | Saturation percentage |
|---|---|---|---|
| A | 7142 | 13 | 0.182022% |
| B | 7142 | 168 | 2.352282% |
| C | 7142 | 23 | 0.322039% |
| D | 7142 | 489 | 6.846822% |
Noise dominated data is calculated using 1-second bins in cleaned event files. If a bin has >2000 counts, and if more than 50% of those come from <1% of pixels, then it is considered to be noise-dominated and hence unusable.
| Quadrant | # 1 sec bins | Bins with >0 counts | Bins with >2000 counts | High rate bins dominated by noise | Noise dominated (total time) | Noise dominated (detector-on time) | Marked lightcurve |
|---|---|---|---|---|---|---|---|
| A | 11146 | 7139 | 0 | 0 | 0.00% | 0.00% |  |
| B | 11147 | 7118 | 0 | 0 | 0.00% | 0.00% |  |
| C | 11147 | 7140 | 0 | 0 | 0.00% | 0.00% |  |
| D | 11146 | 7065 | 0 | 0 | 0.00% | 0.00% |  |
Top three noisy pixels from each quadrant. If the there are fewer than three noisy pixels in the level2.evt file, extra rows are filled as -1
| Pixel properties | Quadrant properties | ||||||
|---|---|---|---|---|---|---|---|
| Quadrant | DetID | PixID | Counts | Sigma | Mean | Median | Sigma |
| A | 0 | 29 | 376 | 8.81 | 114 | 107 | 30.5 |
| A | 9 | 19 | 365 | 8.45 | 114 | 107 | 30.5 |
| A | 0 | 30 | 357 | 8.18 | 114 | 107 | 30.5 |
| B | 2 | 9 | 346 | 10.2 | 109 | 105 | 23.6 |
| B | 14 | 254 | 314 | 8.85 | 109 | 105 | 23.6 |
| B | 2 | 8 | 300 | 8.26 | 109 | 105 | 23.6 |
| C | 1 | 81 | 354 | 8.36 | 110 | 104 | 29.9 |
| C | 1 | 80 | 322 | 7.29 | 110 | 104 | 29.9 |
| C | 3 | 234 | 310 | 6.89 | 110 | 104 | 29.9 |
| D | 6 | 62 | 289 | 7.0 | 100 | 92 | 28.2 |
| D | 4 | 160 | 264 | 6.11 | 100 | 92 | 28.2 |
| D | 10 | 189 | 263 | 6.07 | 100 | 92 | 28.2 |
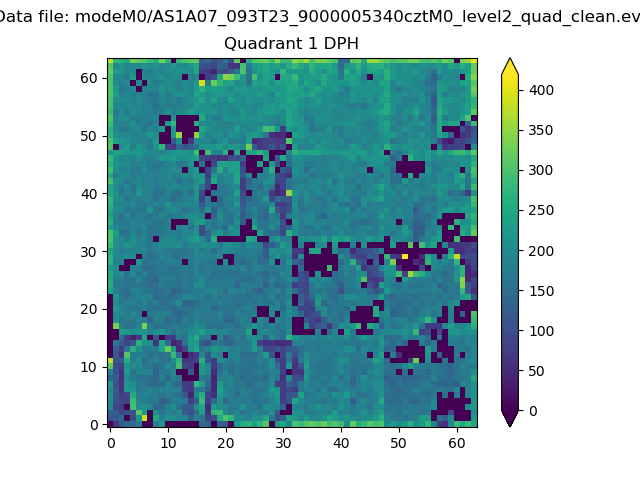
Histogram calculated using DETX and DETY for each event in the final _common_clean file
| Quadrant A |  |
 |
Quadrant B |
|---|---|---|---|
| Quadrant D |  |
 |
Quadrant C |
| Plot type | Count rate plots | Images |
|---|---|---|
| Comparison with Poisson distribution Blue bars denote a histogram of data divided into 1 sec bins. Red curve is a Poisson curve with rate = median count rate of data. |
 |
 |
| Quadrant-wise count rates Data is divided into 100 sec bins |
 |
|
| Module-wise count rates for Quadrant A Data is divided into 100 sec bins |
 |
 |
| Module-wise count rates for Quadrant B Data is divided into 100 sec bins |
 |
 |
| Module-wise count rates for Quadrant C Data is divided into 100 sec bins |
 |
 |
| Module-wise count rates for Quadrant D Data is divided into 100 sec bins |
 |
 |
| Parameter | Plot |
|---|---|
| CZT HV Monitor |  |
| D_VDD |  |
| Temperature 1 |  |
| Veto HV Monitor |  |
| Veto LLD |  |
| Alpha Counter |  |
| _CPM_Rate |  |
| CZT Counter |  |
| +2.5 Volts monitor |  |
| +5 Volts monitor |  |
| _ROLL_ROT |  |
| _Roll_DEC |  |
| _Roll_RA |  |
| Veto Counter |  |