| Param | Original file | Final file |
|---|---|---|
| Filename | modeM0/AS1A07_093T23_9000005340_37606cztM0_level2.evt | modeM0/AS1A07_093T23_9000005340_37606cztM0_level2_quad_clean.evt |
| Size (bytes) | 290,571,840 | 56,096,640 |
| Size | 277.1 MB | 53.5 MB |
| Events in quadrant A | 1,892,250 | 374,711 |
| Events in quadrant B | 2,139,538 | 368,324 |
| Events in quadrant C | 1,805,334 | 367,891 |
| Events in quadrant D | 2,715,809 | 331,572 |
| Mode SS | |||
|---|---|---|---|
| Quadrant | BADHDUFLAG | Total packets | Discarded packets |
| A | 0 | 74 | 0 |
| B | 0 | 74 | 0 |
| C | 0 | 74 | 0 |
| D | 0 | 74 | 0 |
| Mode M0 | |||
|---|---|---|---|
| Quadrant | BADHDUFLAG | Total packets | Discarded packets |
| A | 0 | 7796 | 2 |
| B | 0 | 8570 | 1 |
| C | 0 | 7502 | 1 |
| D | 0 | 10447 | 1 |
| Mode M9 | |||
|---|---|---|---|
| Quadrant | BADHDUFLAG | Total packets | Discarded packets |
| A | 0 | 19 | 0 |
| B | 0 | 19 | 0 |
| C | 0 | 19 | 0 |
| D | 0 | 19 | 0 |
| Quadrant | Total seconds | Saturated seconds | Saturation percentage |
|---|---|---|---|
| A | 3615 | 8 | 0.221300% |
| B | 3615 | 153 | 4.232365% |
| C | 3615 | 8 | 0.221300% |
| D | 3615 | 276 | 7.634855% |
Noise dominated data is calculated using 1-second bins in cleaned event files. If a bin has >2000 counts, and if more than 50% of those come from <1% of pixels, then it is considered to be noise-dominated and hence unusable.
| Quadrant | # 1 sec bins | Bins with >0 counts | Bins with >2000 counts | High rate bins dominated by noise | Noise dominated (total time) | Noise dominated (detector-on time) | Marked lightcurve |
|---|---|---|---|---|---|---|---|
| A | 5557 | 3616 | 3 | 3 | 0.05% | 0.08% | 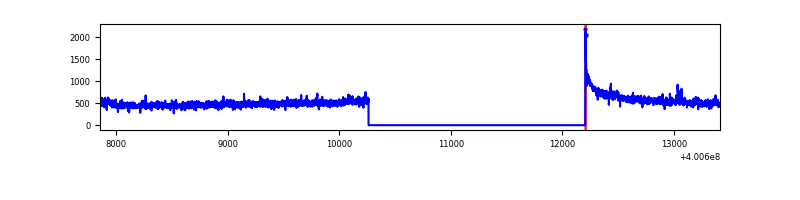 |
| B | 5557 | 3615 | 107 | 107 | 1.93% | 2.96% | 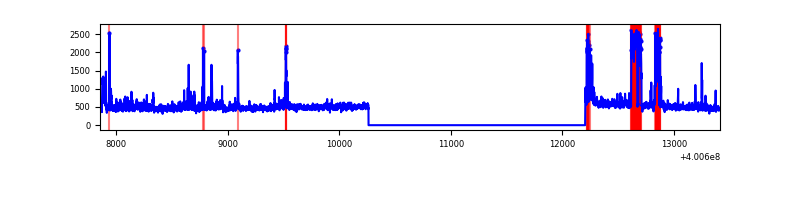 |
| C | 5557 | 3615 | 7 | 7 | 0.13% | 0.19% | 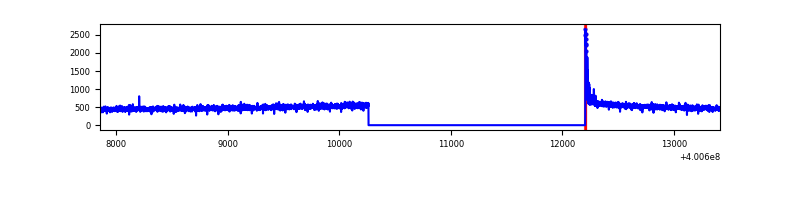 |
| D | 5557 | 3615 | 288 | 288 | 5.18% | 7.97% | 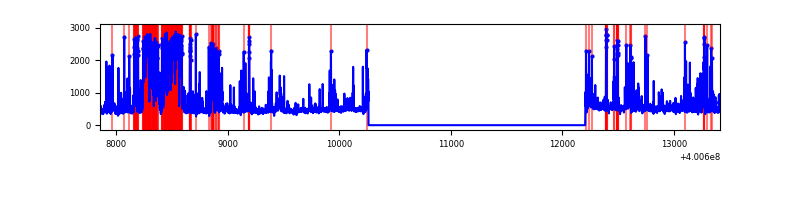 |
Top three noisy pixels from each quadrant. If the there are fewer than three noisy pixels in the level2.evt file, extra rows are filled as -1
| Pixel properties | Quadrant properties | ||||||
|---|---|---|---|---|---|---|---|
| Quadrant | DetID | PixID | Counts | Sigma | Mean | Median | Sigma |
| A | 10 | 83 | 192758 | 2199.31 | 428 | 421 | 87.5 |
| A | 13 | 248 | 15198 | 168.97 | 428 | 421 | 87.5 |
| A | 13 | 6 | 12404 | 137.02 | 428 | 421 | 87.5 |
| B | 5 | 172 | 307612 | 3798.55 | 418 | 408 | 80.9 |
| B | 5 | 200 | 37010 | 452.58 | 418 | 408 | 80.9 |
| B | 0 | 230 | 30891 | 376.92 | 418 | 408 | 80.9 |
| C | 15 | 214 | 151898 | 1554.97 | 414 | 416 | 97.4 |
| C | 0 | 10 | 36032 | 365.6 | 414 | 416 | 97.4 |
| C | 13 | 61 | 2848 | 24.96 | 414 | 416 | 97.4 |
| D | 2 | 249 | 848707 | 8783.63 | 398 | 386 | 96.6 |
| D | 2 | 250 | 169508 | 1751.11 | 398 | 386 | 96.6 |
| D | 12 | 227 | 36811 | 377.15 | 398 | 386 | 96.6 |
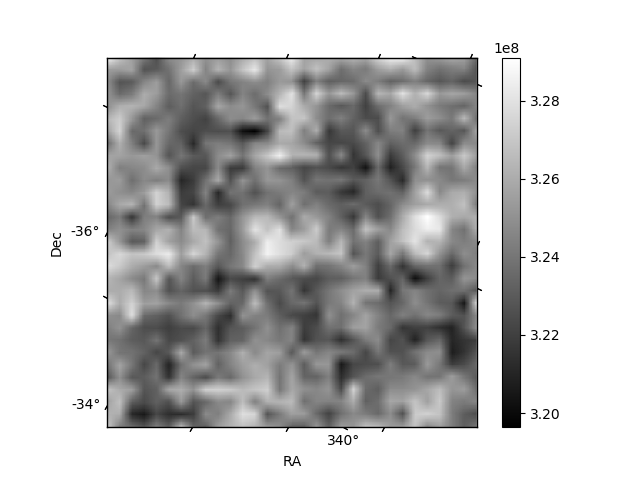
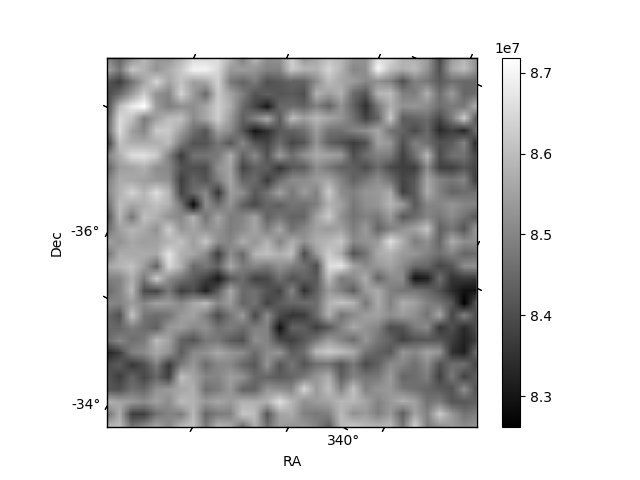
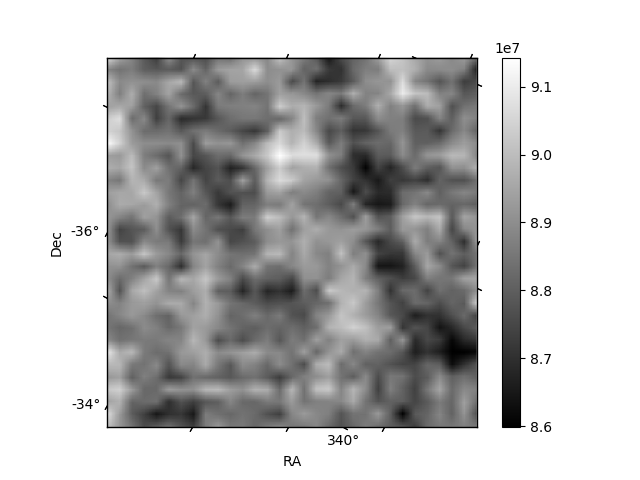
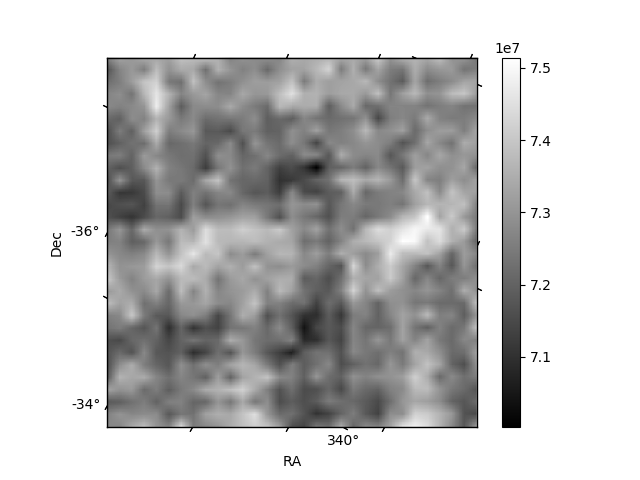
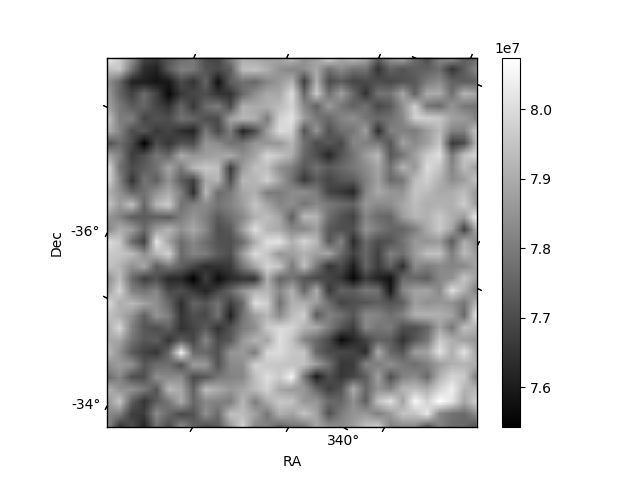
Histogram calculated using DETX and DETY for each event in the final _common_clean file
| Quadrant A | 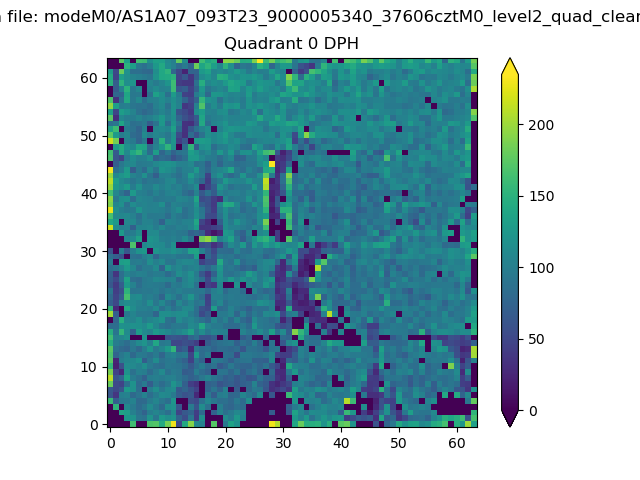 |
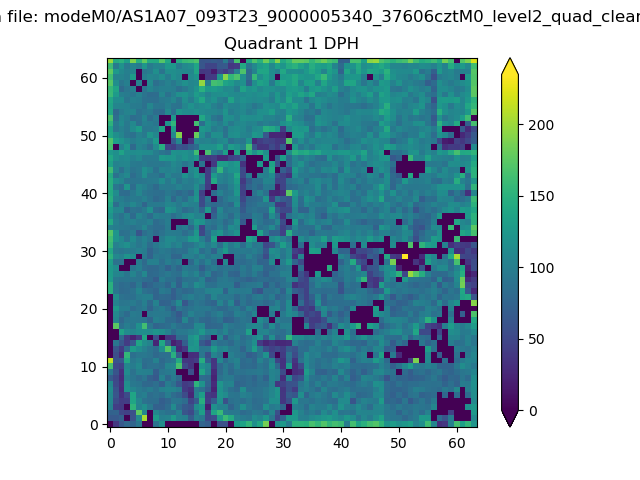 |
Quadrant B |
|---|---|---|---|
| Quadrant D | 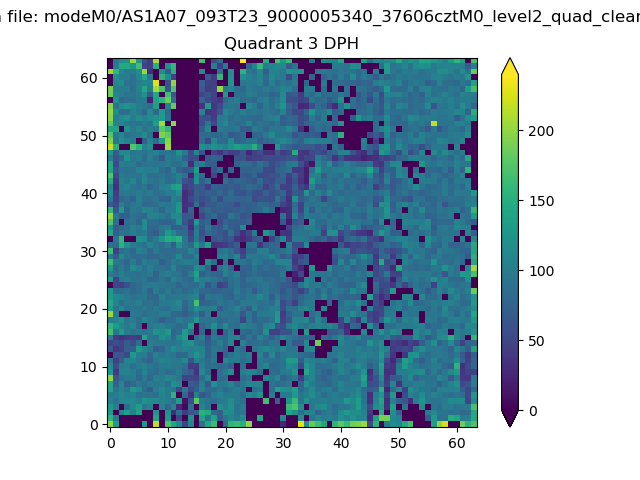 |
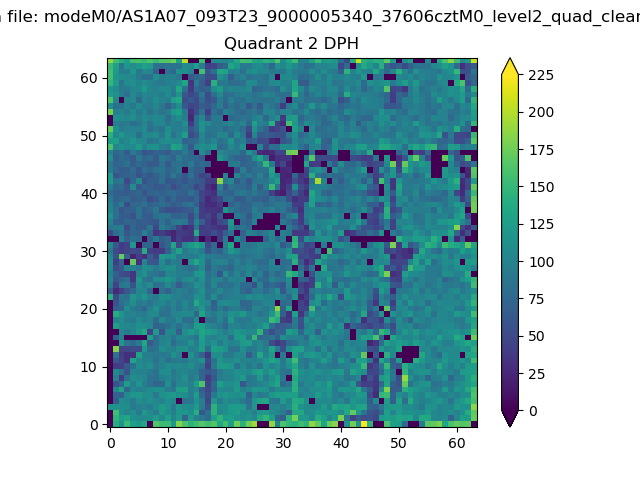 |
Quadrant C |
| Plot type | Count rate plots | Images |
|---|---|---|
| Comparison with Poisson distribution Blue bars denote a histogram of data divided into 1 sec bins. Red curve is a Poisson curve with rate = median count rate of data. |
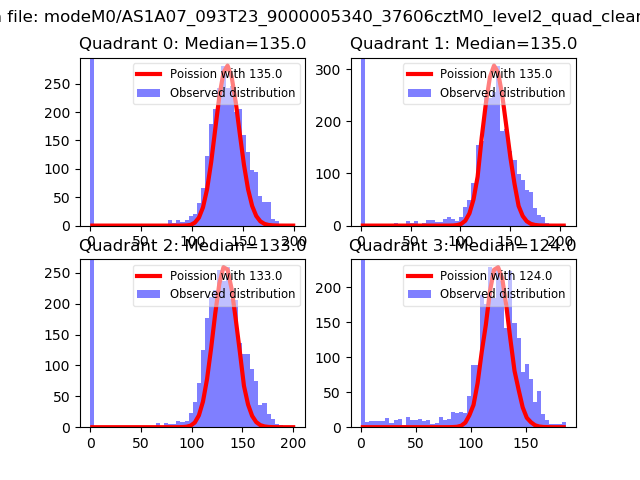 |
 |
| Quadrant-wise count rates Data is divided into 100 sec bins |
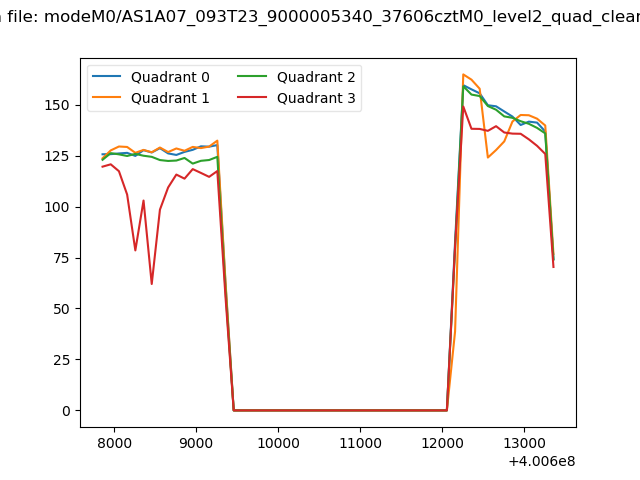 |
|
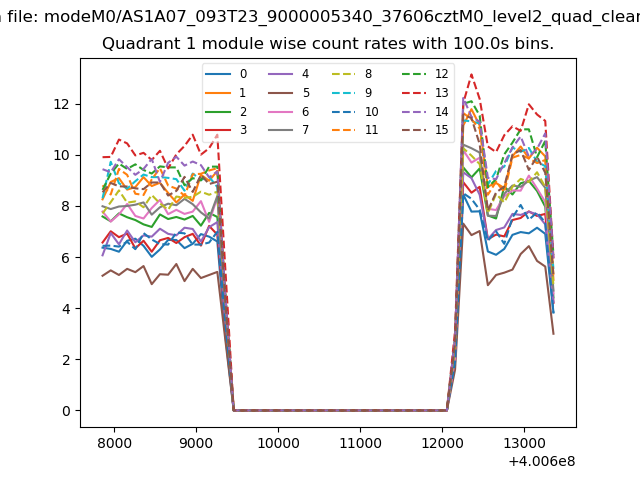
| Module-wise count rates for Quadrant A Data is divided into 100 sec bins |
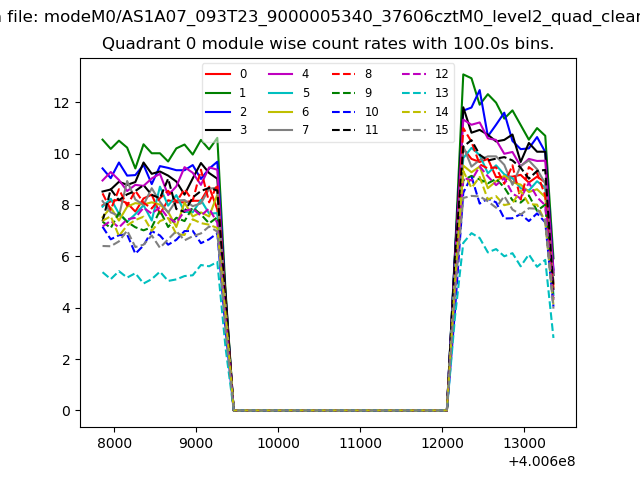 |
 |
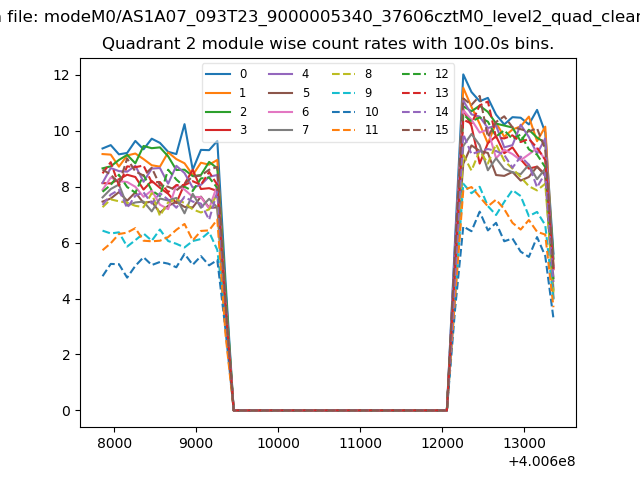
| Module-wise count rates for Quadrant B Data is divided into 100 sec bins |
 |
 |
| Module-wise count rates for Quadrant C Data is divided into 100 sec bins |
 |
 |
| Module-wise count rates for Quadrant D Data is divided into 100 sec bins |
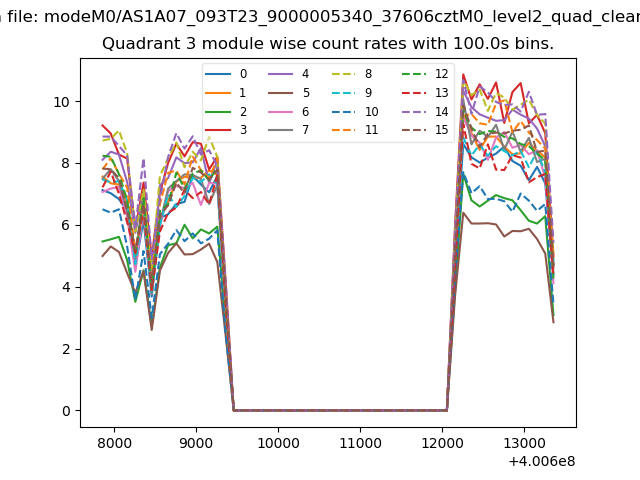 |
 |
| Parameter | Plot |
|---|---|
| CZT HV Monitor | 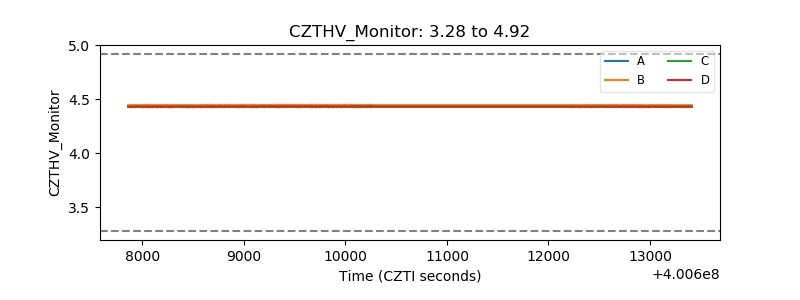 |
| D_VDD | 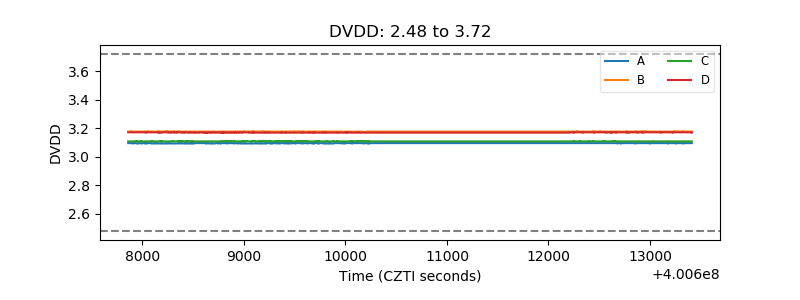 |
| Temperature 1 | 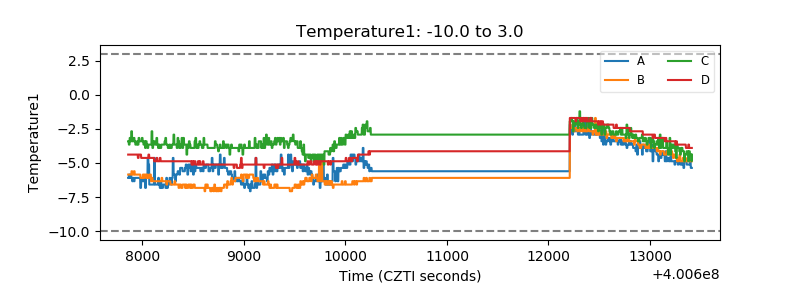 |
| Veto HV Monitor | 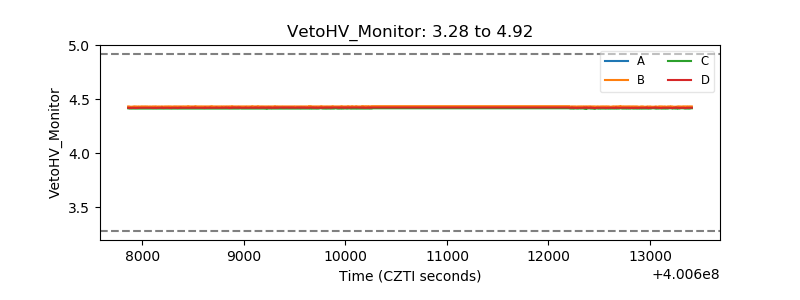 |
| Veto LLD | 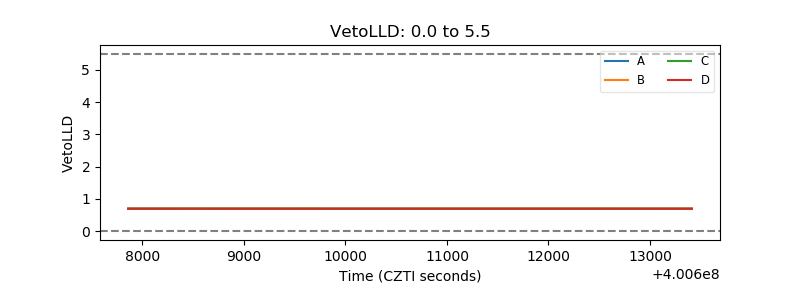 |
| Alpha Counter | 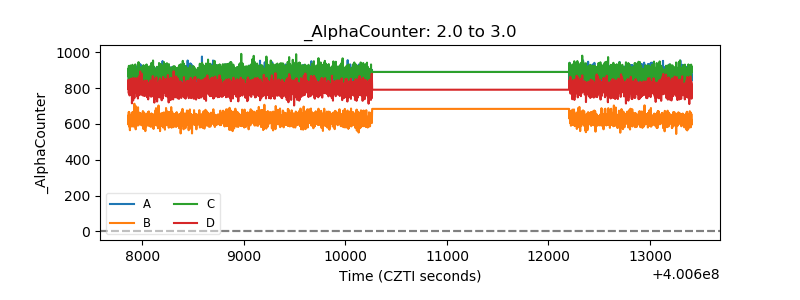 |
| _CPM_Rate | 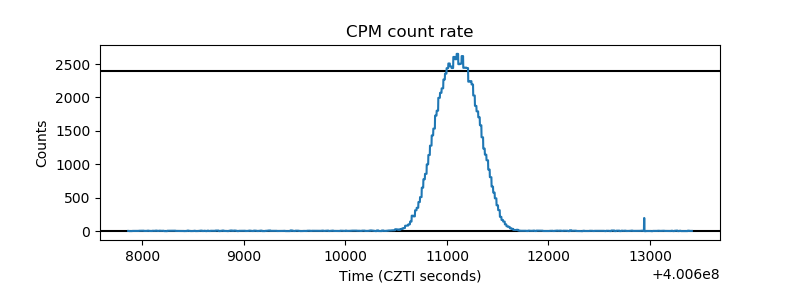 |
| CZT Counter | 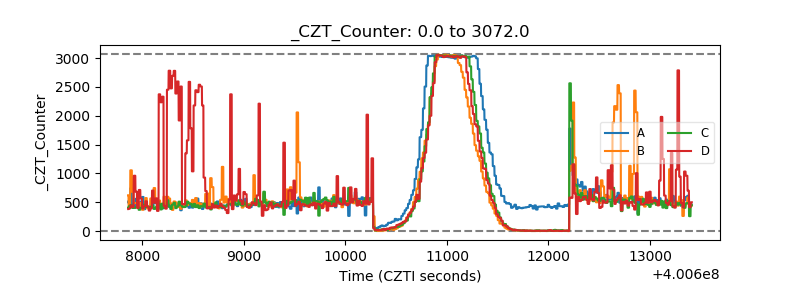 |
| +2.5 Volts monitor | 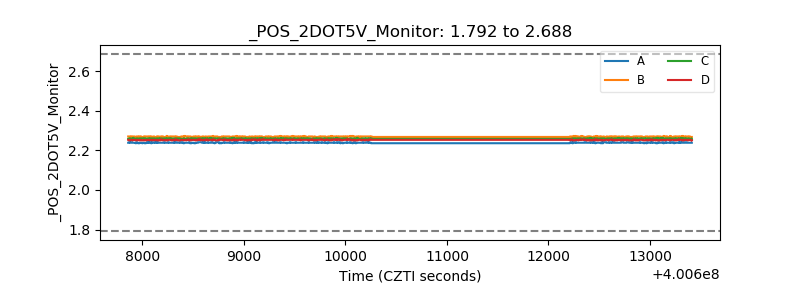 |
| +5 Volts monitor | 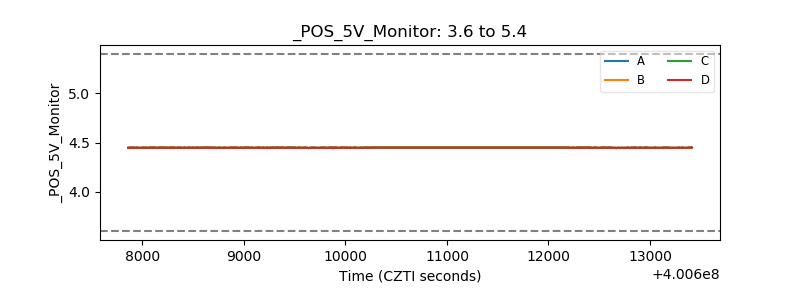 |
| _ROLL_ROT | 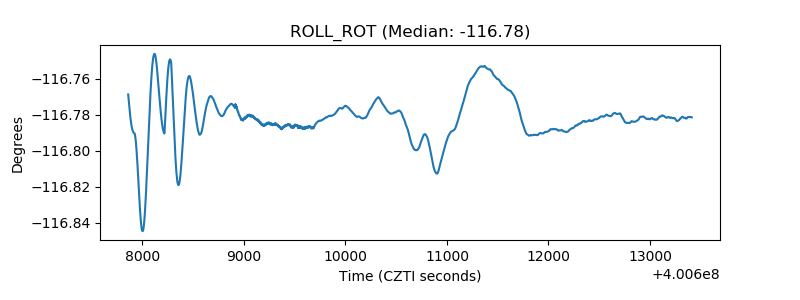 |
| _Roll_DEC | 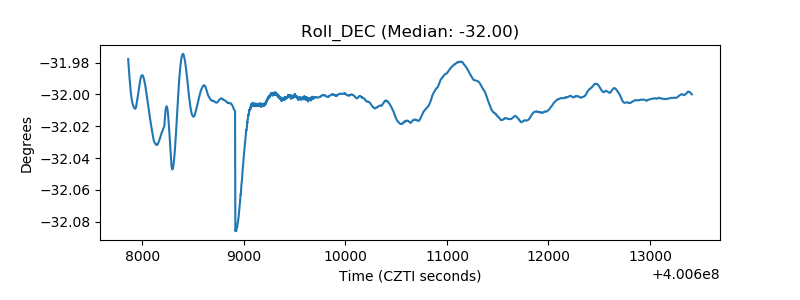 |
| _Roll_RA | 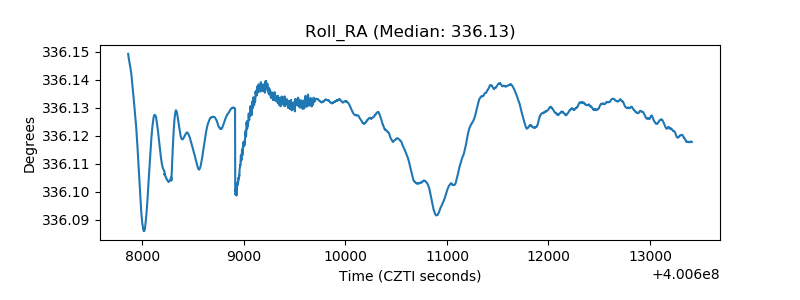 |
| Veto Counter | 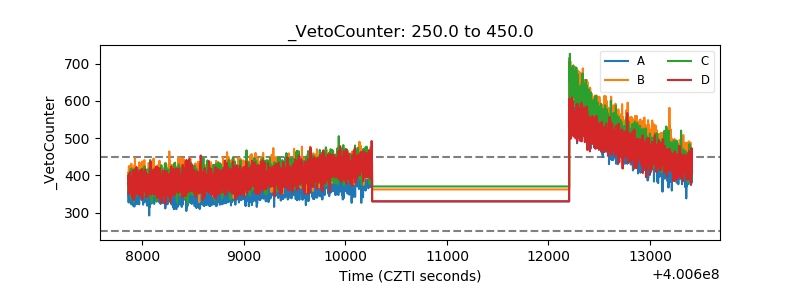 |