| Param | Original file | Final file |
|---|---|---|
| Filename | modeM0/AS1A07_093T23_9000005340_37608cztM0_level2.fits | modeM0/AS1A07_093T23_9000005340_37608cztM0_level2_quad_clean.evt |
| Size (bytes) | 300,718,080 | 74,594,880 |
| Size | 286.8 MB | 71.1 MB |
| Events in quadrant A | 2,547,170 | 497,113 |
| Events in quadrant B | 2,662,037 | 496,341 |
| Events in quadrant C | 2,454,159 | 489,666 |
| Events in quadrant D | 3,098,968 | 443,187 |
| Mode SS | |||
|---|---|---|---|
| Quadrant | BADHDUFLAG | Total packets | Discarded packets |
| A | 0 | 96 | 0 |
| B | 0 | 96 | 0 |
| C | 0 | 96 | 0 |
| D | 0 | 96 | 0 |
| Mode M0 | |||
|---|---|---|---|
| Quadrant | BADHDUFLAG | Total packets | Discarded packets |
| A | 0 | 10465 | 2 |
| B | 0 | 10806 | 2 |
| C | 0 | 10062 | 2 |
| D | 0 | 12403 | 2 |
| Mode M9 | |||
|---|---|---|---|
| Quadrant | BADHDUFLAG | Total packets | Discarded packets |
| A | 0 | 23 | 0 |
| B | 0 | 23 | 0 |
| C | 0 | 23 | 0 |
| D | 0 | 24 | 0 |
| Quadrant | Total seconds | Saturated seconds | Saturation percentage |
|---|---|---|---|
| A | 4735 | 11 | 0.232313% |
| B | 4735 | 153 | 3.231257% |
| C | 4735 | 23 | 0.485744% |
| D | 4735 | 249 | 5.258712% |
Noise dominated data is calculated using 1-second bins in cleaned event files. If a bin has >2000 counts, and if more than 50% of those come from <1% of pixels, then it is considered to be noise-dominated and hence unusable.
| Quadrant | # 1 sec bins | Bins with >0 counts | Bins with >2000 counts | High rate bins dominated by noise | Noise dominated (total time) | Noise dominated (detector-on time) | Marked lightcurve |
|---|---|---|---|---|---|---|---|
| A | 6798 | 4736 | 7 | 7 | 0.10% | 0.15% | 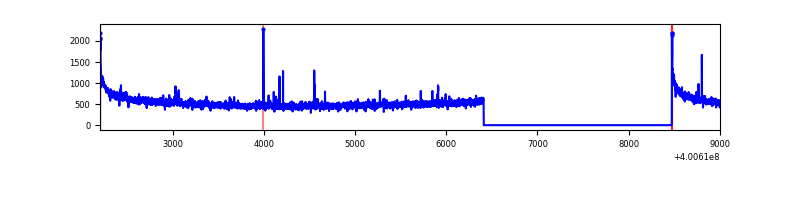 |
| B | 6797 | 4734 | 111 | 111 | 1.63% | 2.34% | 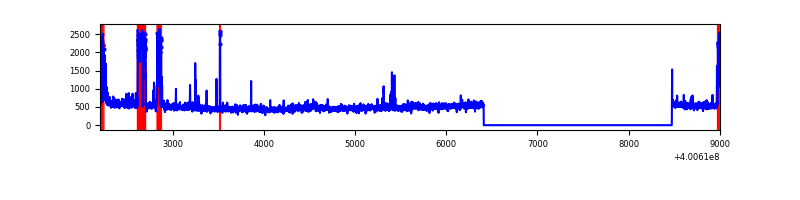 |
| C | 6797 | 4734 | 23 | 23 | 0.34% | 0.49% | 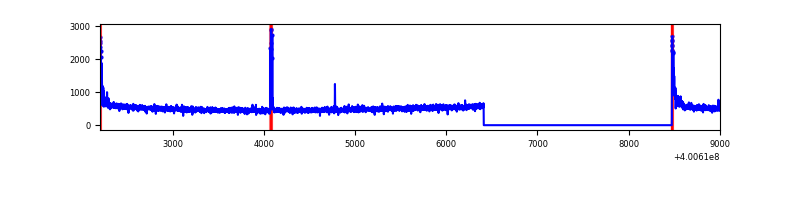 |
| D | 6797 | 4734 | 237 | 237 | 3.49% | 5.01% | 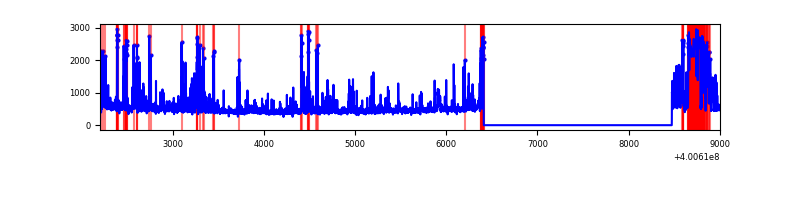 |
Top three noisy pixels from each quadrant. If the there are fewer than three noisy pixels in the level2.evt file, extra rows are filled as -1
| Pixel properties | Quadrant properties | ||||||
|---|---|---|---|---|---|---|---|
| Quadrant | DetID | PixID | Counts | Sigma | Mean | Median | Sigma |
| A | 10 | 83 | 291147 | 2544.28 | 569 | 559 | 114.2 |
| A | 13 | 248 | 18975 | 161.24 | 569 | 559 | 114.2 |
| A | 9 | 143 | 14852 | 125.14 | 569 | 559 | 114.2 |
| B | 5 | 172 | 344103 | 3245.92 | 560 | 546 | 105.8 |
| B | 0 | 230 | 42432 | 395.74 | 560 | 546 | 105.8 |
| B | 5 | 200 | 17662 | 161.71 | 560 | 546 | 105.8 |
| C | 15 | 214 | 204112 | 1595.58 | 547 | 551 | 127.6 |
| C | 0 | 10 | 85544 | 666.2 | 547 | 551 | 127.6 |
| C | 14 | 254 | 27161 | 208.58 | 547 | 551 | 127.6 |
| D | 13 | 249 | 475381 | 3686.92 | 525 | 509 | 128.8 |
| D | 2 | 250 | 201047 | 1556.98 | 525 | 509 | 128.8 |
| D | 2 | 249 | 148991 | 1152.82 | 525 | 509 | 128.8 |
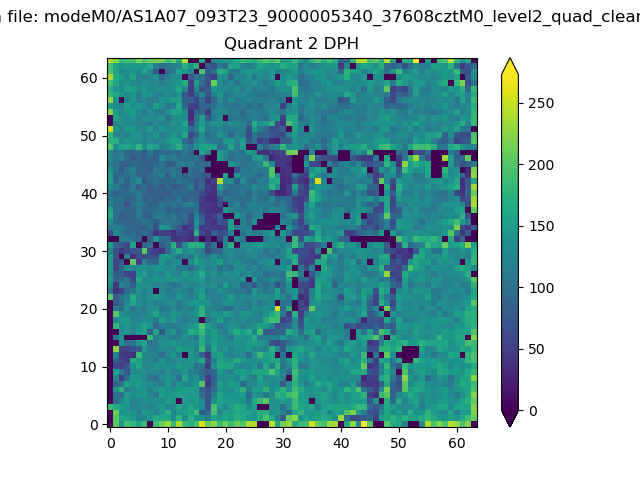
Histogram calculated using DETX and DETY for each event in the final _common_clean file
| Quadrant A | 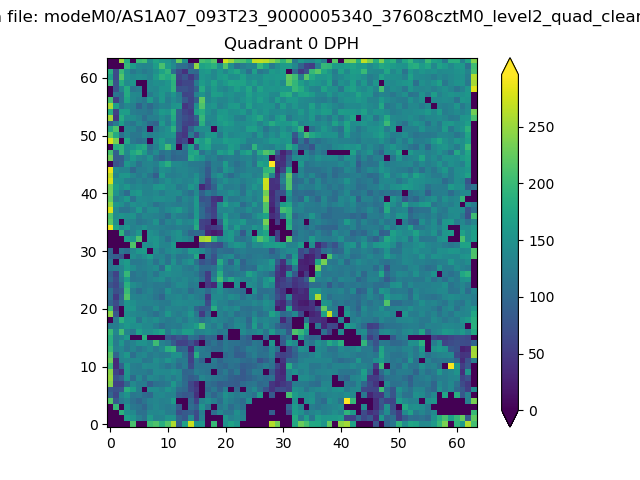 |
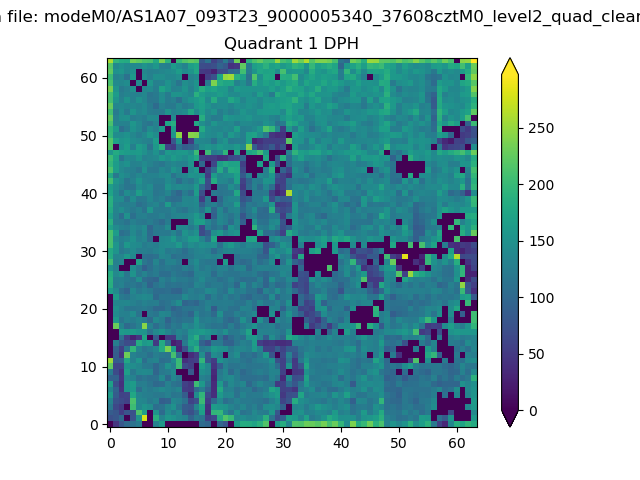 |
Quadrant B |
|---|---|---|---|
| Quadrant D | 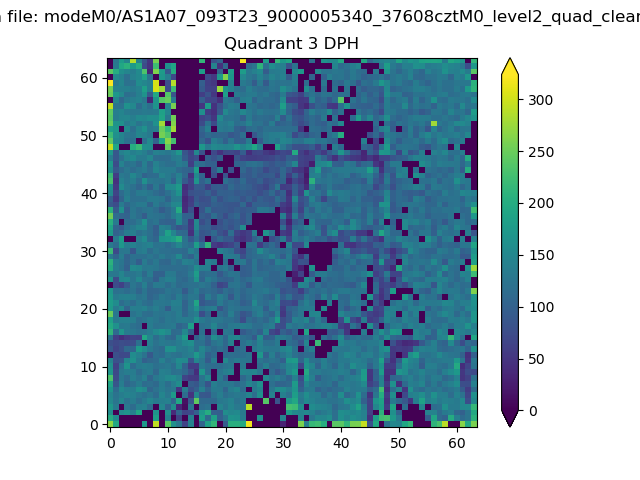 |
 |
Quadrant C |
| Plot type | Count rate plots | Images |
|---|---|---|
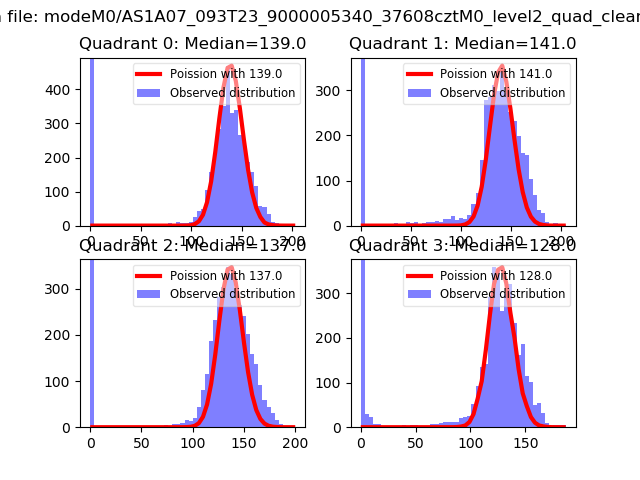
| Comparison with Poisson distribution Blue bars denote a histogram of data divided into 1 sec bins. Red curve is a Poisson curve with rate = median count rate of data. |
 |
 |
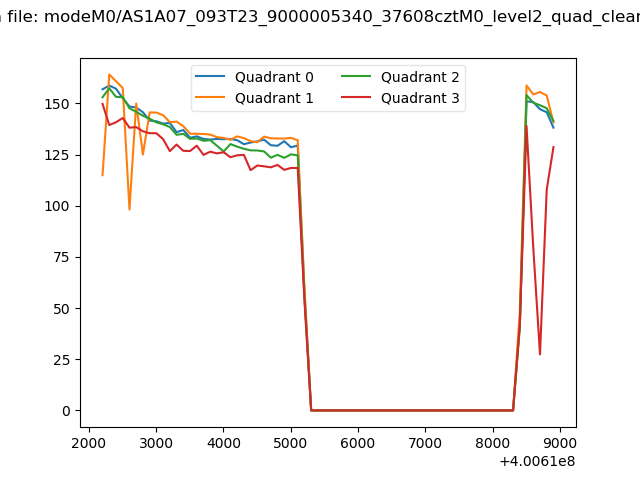
| Quadrant-wise count rates Data is divided into 100 sec bins |
 |
|
| Module-wise count rates for Quadrant A Data is divided into 100 sec bins |
 |
 |
| Module-wise count rates for Quadrant B Data is divided into 100 sec bins |
 |
 |
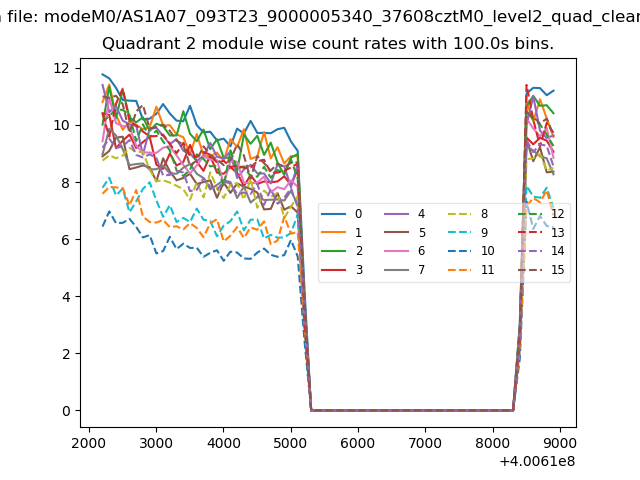
| Module-wise count rates for Quadrant C Data is divided into 100 sec bins |
 |
 |
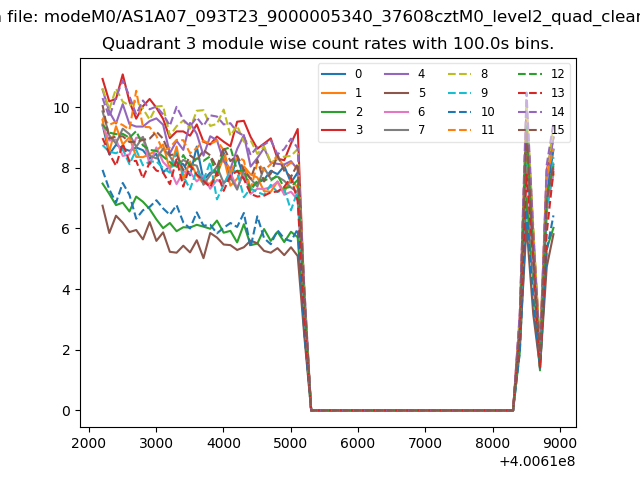
| Module-wise count rates for Quadrant D Data is divided into 100 sec bins |
 |
 |
| Parameter | Plot |
|---|---|
| CZT HV Monitor | 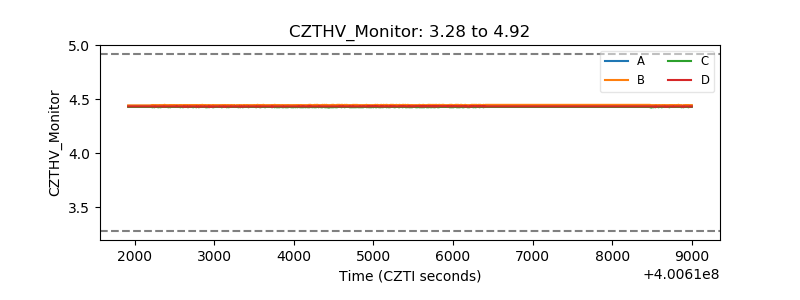 |
| D_VDD | 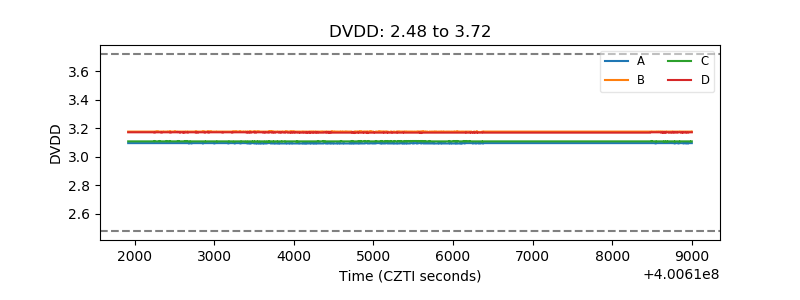 |
| Temperature 1 | 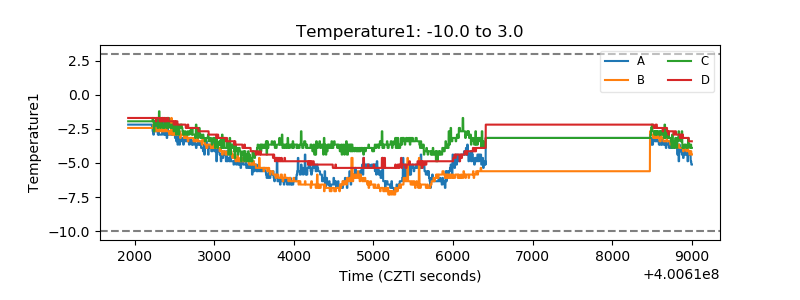 |
| Veto HV Monitor | 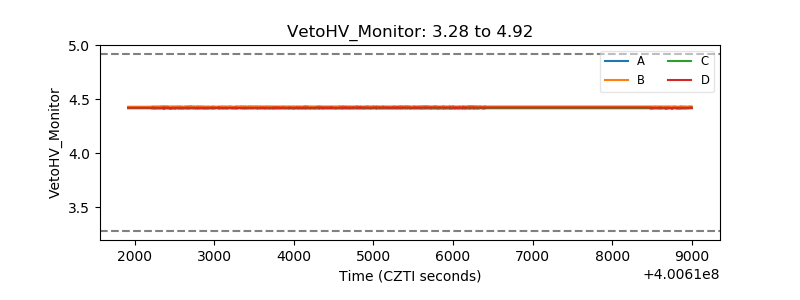 |
| Veto LLD | 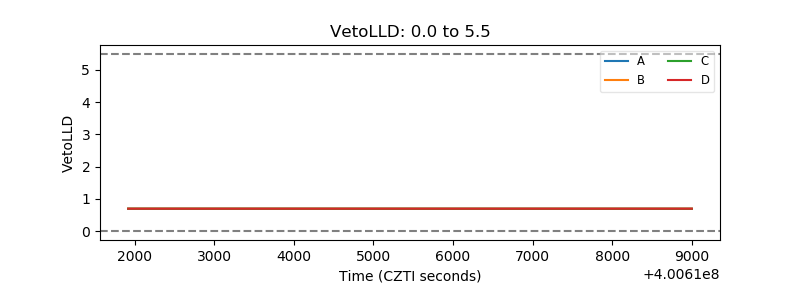 |
| Alpha Counter | 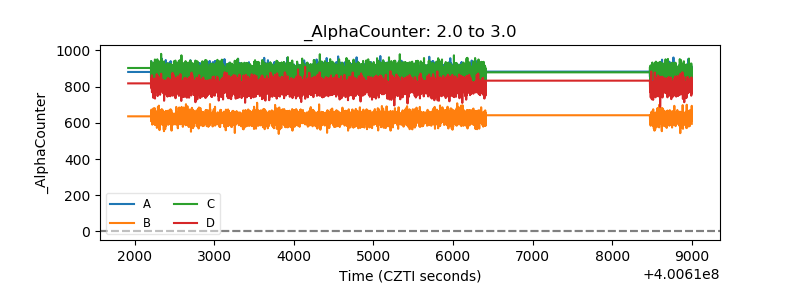 |
| _CPM_Rate | 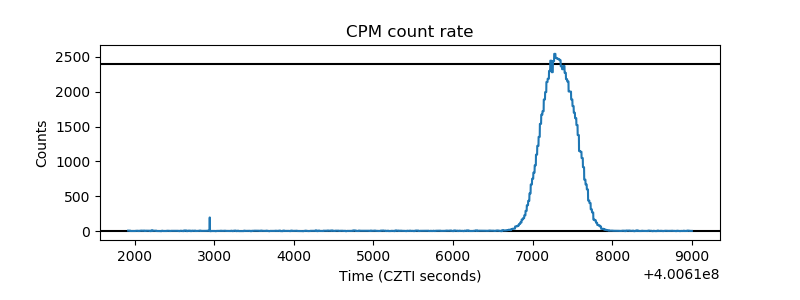 |
| CZT Counter | 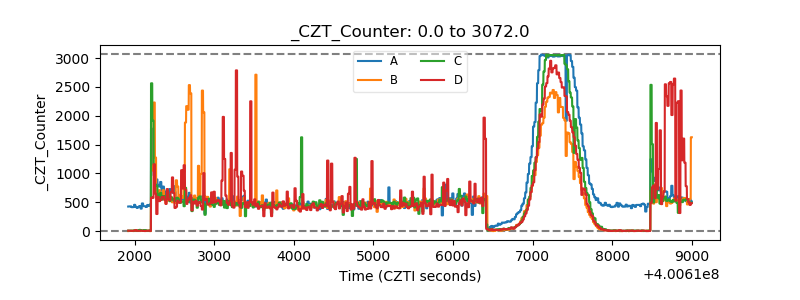 |
| +2.5 Volts monitor | 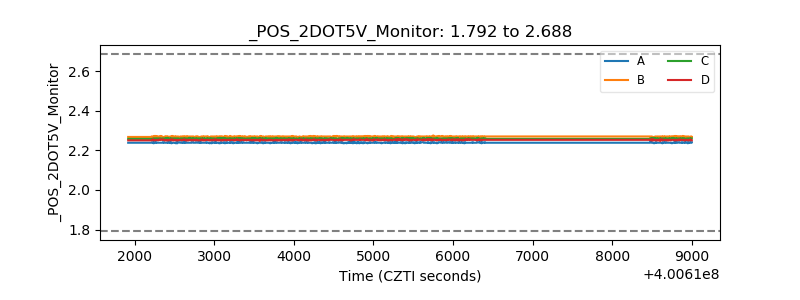 |
| +5 Volts monitor | 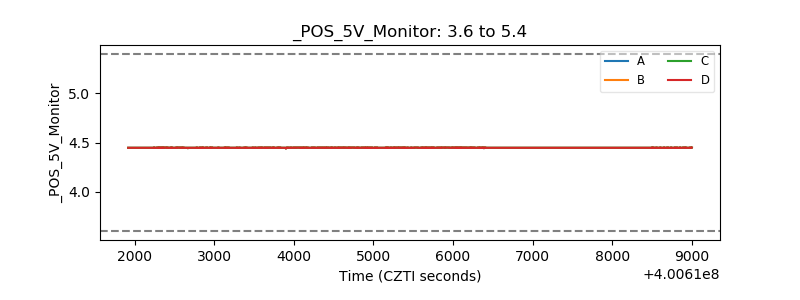 |
| _ROLL_ROT | 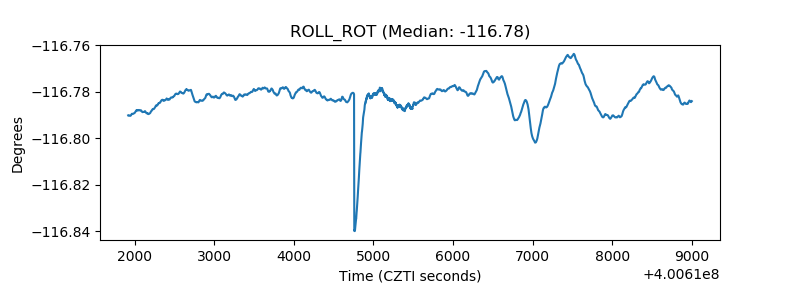 |
| _Roll_DEC | 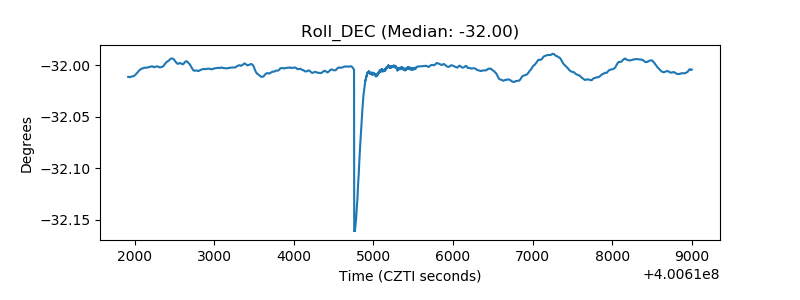 |
| _Roll_RA | 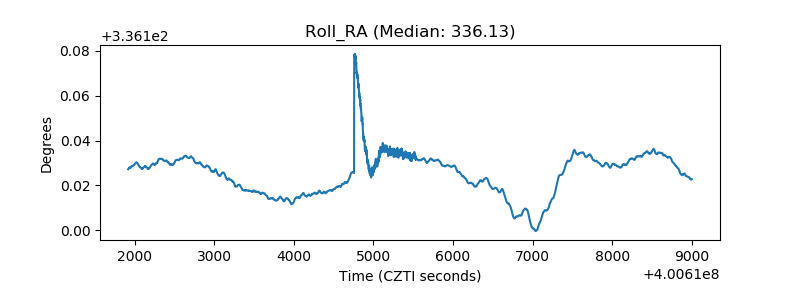 |
| Veto Counter | 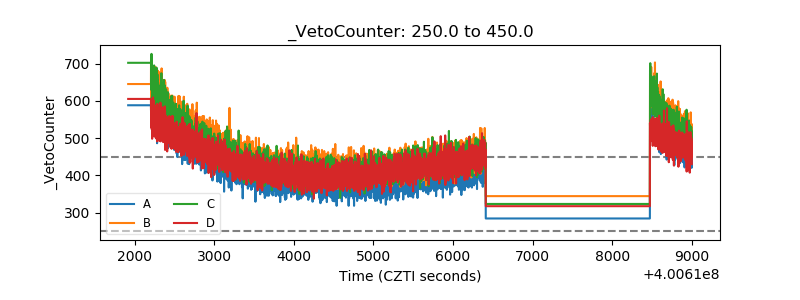 |