| Param | Original file | Final file |
|---|---|---|
| Filename | modeM0/AS1A11_075T01_9000005342cztM0_level2.fits | modeM0/AS1A11_075T01_9000005342cztM0_level2_quad_clean.evt |
| Size (bytes) | 4,191,422,400 | 4,503,663,360 |
| Size | 3.9 GB | 4.2 GB |
| Events in quadrant A | 24,480,360 | 26,121,539 |
| Events in quadrant B | 24,558,256 | 28,000,097 |
| Events in quadrant C | 25,666,282 | 27,559,842 |
| Events in quadrant D | 21,552,138 | 24,065,672 |
| Mode SS | |||
|---|---|---|---|
| Quadrant | BADHDUFLAG | Total packets | Discarded packets |
| A | 0 | 9160 | 0 |
| B | 0 | 9160 | 0 |
| C | 0 | 9160 | 0 |
| D | 0 | 9160 | 0 |
| Mode M0 | |||
|---|---|---|---|
| Quadrant | BADHDUFLAG | Total packets | Discarded packets |
| A | 0 | 1349246 | 0 |
| B | 0 | 1009188 | 0 |
| C | 0 | 945525 | 0 |
| D | 0 | 1273378 | 0 |
| Mode M9 | |||
|---|---|---|---|
| Quadrant | BADHDUFLAG | Total packets | Discarded packets |
| A | 0 | 1703 | 0 |
| B | 0 | 1703 | 0 |
| C | 0 | 1703 | 0 |
| D | 0 | 1703 | 0 |
| Quadrant | Total seconds | Saturated seconds | Saturation percentage |
|---|---|---|---|
| A | 447668 | 36065 | 8.056193% |
| B | 447668 | 7894 | 1.763360% |
| C | 447668 | 2050 | 0.457929% |
| D | 447668 | 24491 | 5.470795% |
Noise dominated data is calculated using 1-second bins in cleaned event files. If a bin has >2000 counts, and if more than 50% of those come from <1% of pixels, then it is considered to be noise-dominated and hence unusable.
| Quadrant | # 1 sec bins | Bins with >0 counts | Bins with >2000 counts | High rate bins dominated by noise | Noise dominated (total time) | Noise dominated (detector-on time) | Marked lightcurve |
|---|---|---|---|---|---|---|---|
| A | 616975 | 446944 | 0 | 0 | 0.00% | 0.00% |  |
| B | 616975 | 447302 | 0 | 0 | 0.00% | 0.00% |  |
| C | 616976 | 447475 | 0 | 0 | 0.00% | 0.00% |  |
| D | 616975 | 447389 | 0 | 0 | 0.00% | 0.00% | 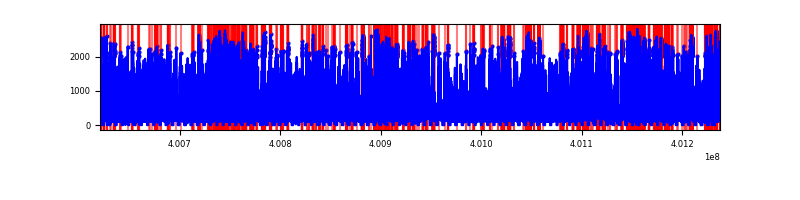 |
Top three noisy pixels from each quadrant. If the there are fewer than three noisy pixels in the level2.evt file, extra rows are filled as -1
| Pixel properties | Quadrant properties | ||||||
|---|---|---|---|---|---|---|---|
| Quadrant | DetID | PixID | Counts | Sigma | Mean | Median | Sigma |
| A | 7 | 110 | 20193 | 9.1 | 6403 | 6016 | 1557.8 |
| A | 9 | 19 | 20085 | 9.03 | 6403 | 6016 | 1557.8 |
| A | 0 | 29 | 19542 | 8.68 | 6403 | 6016 | 1557.8 |
| B | 2 | 9 | 21224 | 12.09 | 6520 | 6245 | 1239.1 |
| B | 3 | 80 | 18943 | 10.25 | 6520 | 6245 | 1239.1 |
| B | 5 | 128 | 17257 | 8.89 | 6520 | 6245 | 1239.1 |
| C | 1 | 81 | 21260 | 8.68 | 6788 | 6402 | 1711.2 |
| C | 1 | 80 | 20530 | 8.26 | 6788 | 6402 | 1711.2 |
| C | 3 | 202 | 20246 | 8.09 | 6788 | 6402 | 1711.2 |
| D | 10 | 189 | 15996 | 6.34 | 6182 | 5649 | 1632.7 |
| D | 7 | 3 | 15904 | 6.28 | 6182 | 5649 | 1632.7 |
| D | 10 | 113 | 15531 | 6.05 | 6182 | 5649 | 1632.7 |
Histogram calculated using DETX and DETY for each event in the final _common_clean file
| Quadrant A |  |
 |
Quadrant B |
|---|---|---|---|
| Quadrant D | 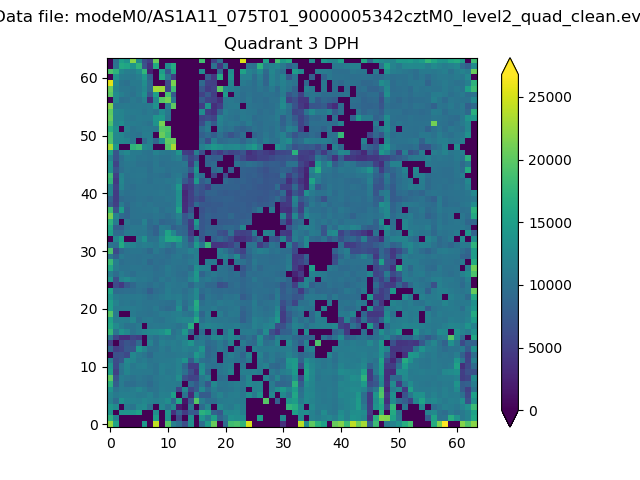 |
 |
Quadrant C |
| Plot type | Count rate plots | Images |
|---|---|---|
| Comparison with Poisson distribution Blue bars denote a histogram of data divided into 1 sec bins. Red curve is a Poisson curve with rate = median count rate of data. |
 |
 |
| Quadrant-wise count rates Data is divided into 100 sec bins |
 |
|
| Module-wise count rates for Quadrant A Data is divided into 100 sec bins |
 |
 |
| Module-wise count rates for Quadrant B Data is divided into 100 sec bins |
 |
 |
| Module-wise count rates for Quadrant C Data is divided into 100 sec bins |
 |
 |
| Module-wise count rates for Quadrant D Data is divided into 100 sec bins |
 |
 |
| Parameter | Plot |
|---|---|
| CZT HV Monitor |  |
| D_VDD |  |
| Temperature 1 |  |
| Veto HV Monitor |  |
| Veto LLD |  |
| Alpha Counter |  |
| _CPM_Rate |  |
| CZT Counter |  |
| +2.5 Volts monitor |  |
| +5 Volts monitor |  |
| _ROLL_ROT |  |
| _Roll_DEC |  |
| _Roll_RA | 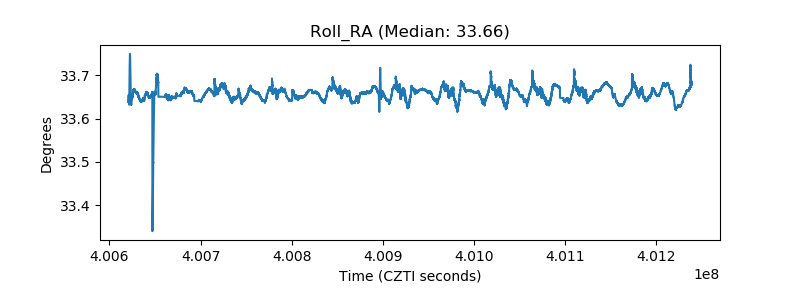 |
| Veto Counter |  |