| Param | Original file | Final file |
|---|---|---|
| Filename | modeM0/AS1A11_075T01_9000005342_37609cztM0_level2.evt | modeM0/AS1A11_075T01_9000005342_37609cztM0_level2_quad_clean.evt |
| Size (bytes) | 404,789,760 | 79,300,800 |
| Size | 386.0 MB | 75.6 MB |
| Events in quadrant A | 3,108,936 | 506,207 |
| Events in quadrant B | 2,642,282 | 531,877 |
| Events in quadrant C | 2,564,404 | 533,786 |
| Events in quadrant D | 3,606,521 | 481,755 |
| Mode SS | |||
|---|---|---|---|
| Quadrant | BADHDUFLAG | Total packets | Discarded packets |
| A | 0 | 102 | 0 |
| B | 0 | 102 | 0 |
| C | 0 | 102 | 0 |
| D | 0 | 102 | 0 |
| Mode M0 | |||
|---|---|---|---|
| Quadrant | BADHDUFLAG | Total packets | Discarded packets |
| A | 0 | 12404 | 3 |
| B | 0 | 11085 | 2 |
| C | 0 | 10575 | 2 |
| D | 0 | 14071 | 2 |
| Mode M9 | |||
|---|---|---|---|
| Quadrant | BADHDUFLAG | Total packets | Discarded packets |
| A | 0 | 33 | 0 |
| B | 0 | 33 | 0 |
| C | 0 | 33 | 0 |
| D | 0 | 34 | 0 |
| Quadrant | Total seconds | Saturated seconds | Saturation percentage |
|---|---|---|---|
| A | 4952 | 159 | 3.210824% |
| B | 4952 | 102 | 2.059774% |
| C | 4952 | 24 | 0.484653% |
| D | 4952 | 305 | 6.159128% |
Noise dominated data is calculated using 1-second bins in cleaned event files. If a bin has >2000 counts, and if more than 50% of those come from <1% of pixels, then it is considered to be noise-dominated and hence unusable.
| Quadrant | # 1 sec bins | Bins with >0 counts | Bins with >2000 counts | High rate bins dominated by noise | Noise dominated (total time) | Noise dominated (detector-on time) | Marked lightcurve |
|---|---|---|---|---|---|---|---|
| A | 7075 | 4953 | 150 | 150 | 2.12% | 3.03% |  |
| B | 7075 | 4952 | 72 | 72 | 1.02% | 1.45% | 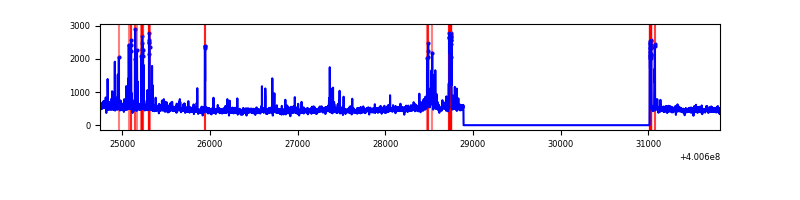 |
| C | 7074 | 4951 | 18 | 18 | 0.25% | 0.36% | 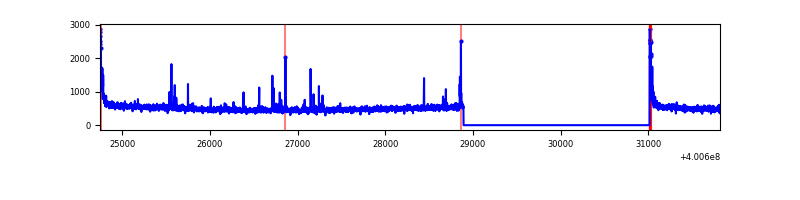 |
| D | 7074 | 4952 | 316 | 316 | 4.47% | 6.38% | 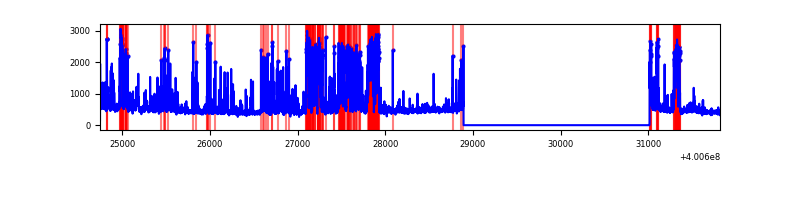 |
Top three noisy pixels from each quadrant. If the there are fewer than three noisy pixels in the level2.evt file, extra rows are filled as -1
| Pixel properties | Quadrant properties | ||||||
|---|---|---|---|---|---|---|---|
| Quadrant | DetID | PixID | Counts | Sigma | Mean | Median | Sigma |
| A | 15 | 222 | 624424 | 5579.31 | 556 | 546 | 111.8 |
| A | 10 | 83 | 289357 | 2582.82 | 556 | 546 | 111.8 |
| A | 13 | 248 | 18897 | 164.11 | 556 | 546 | 111.8 |
| B | 5 | 172 | 209557 | 1924.14 | 563 | 549 | 108.6 |
| B | 0 | 189 | 60904 | 555.63 | 563 | 549 | 108.6 |
| B | 5 | 200 | 52727 | 480.35 | 563 | 549 | 108.6 |
| C | 15 | 214 | 230462 | 1772.8 | 556 | 560 | 129.7 |
| C | 0 | 10 | 93682 | 718.08 | 556 | 560 | 129.7 |
| C | 14 | 254 | 64707 | 494.65 | 556 | 560 | 129.7 |
| D | 2 | 249 | 1072084 | 8195.73 | 537 | 524 | 130.7 |
| D | 12 | 227 | 113199 | 861.78 | 537 | 524 | 130.7 |
| D | 1 | 47 | 102078 | 776.73 | 537 | 524 | 130.7 |
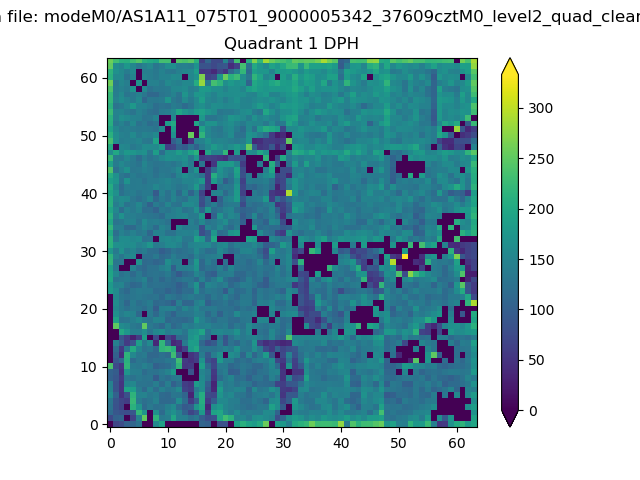
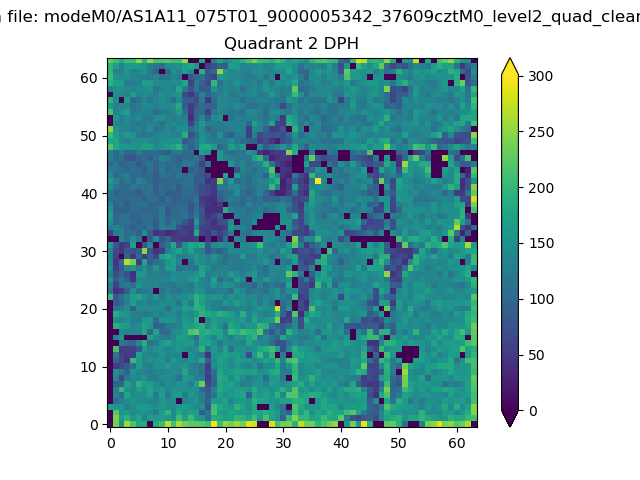
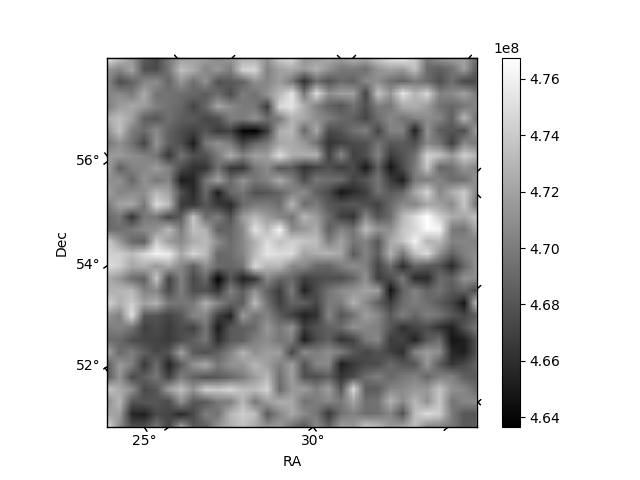
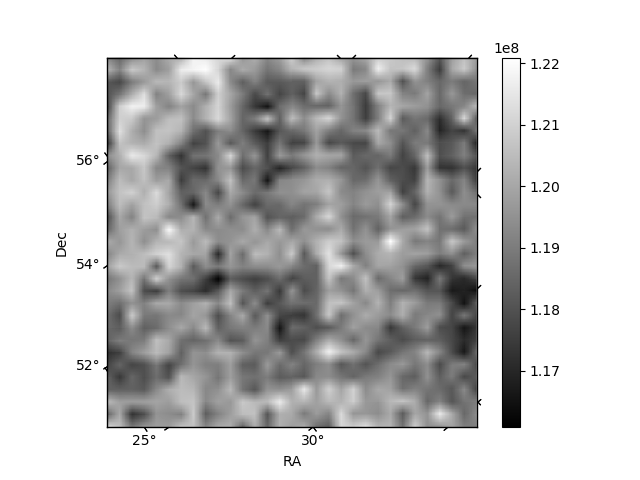
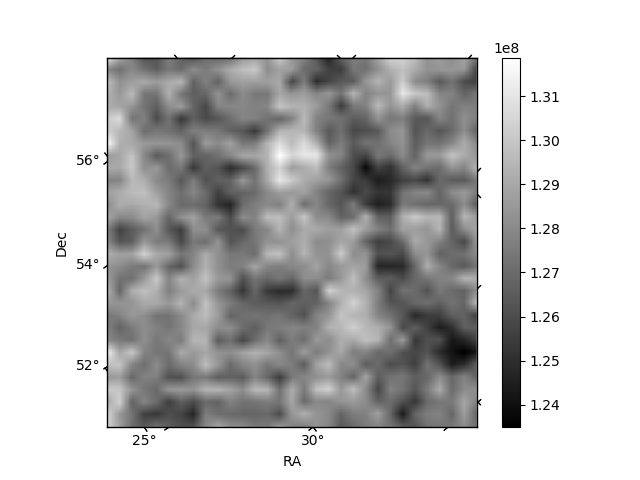
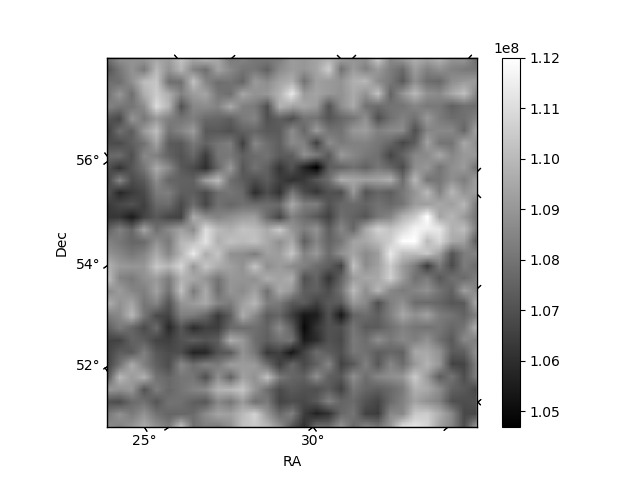
Histogram calculated using DETX and DETY for each event in the final _common_clean file
| Quadrant A | 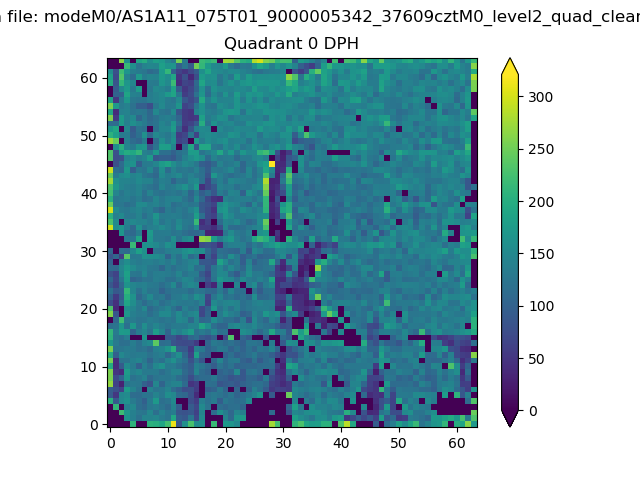 |
 |
Quadrant B |
|---|---|---|---|
| Quadrant D | 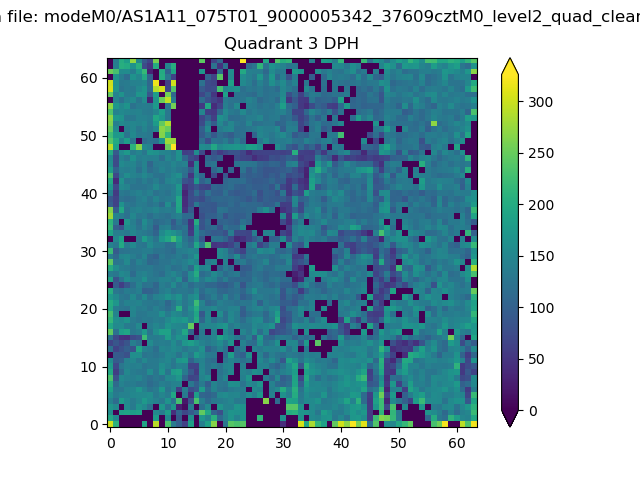 |
 |
Quadrant C |
| Plot type | Count rate plots | Images |
|---|---|---|
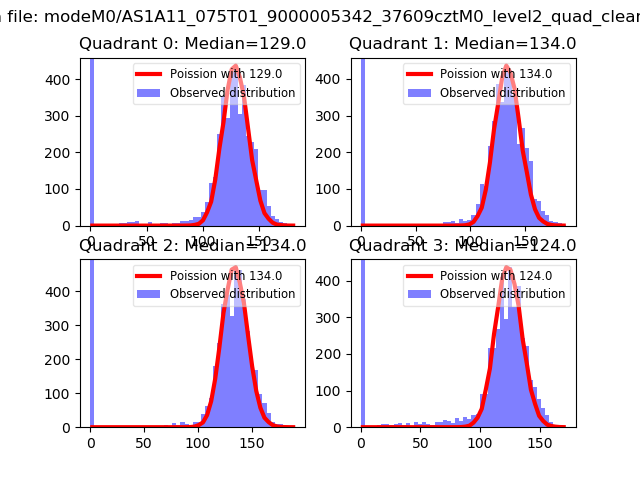
| Comparison with Poisson distribution Blue bars denote a histogram of data divided into 1 sec bins. Red curve is a Poisson curve with rate = median count rate of data. |
 |
 |
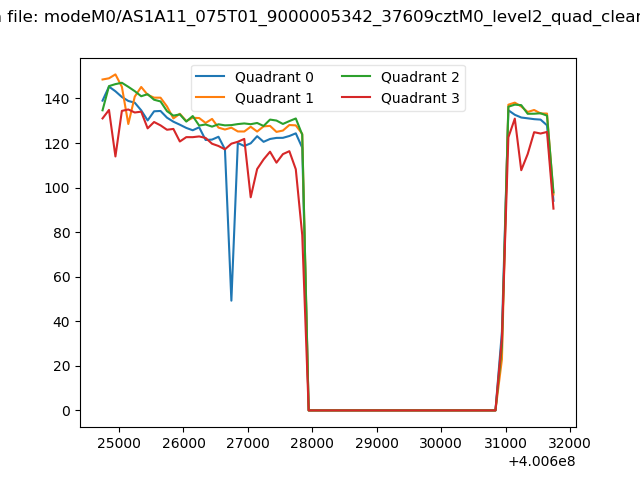
| Quadrant-wise count rates Data is divided into 100 sec bins |
 |
|
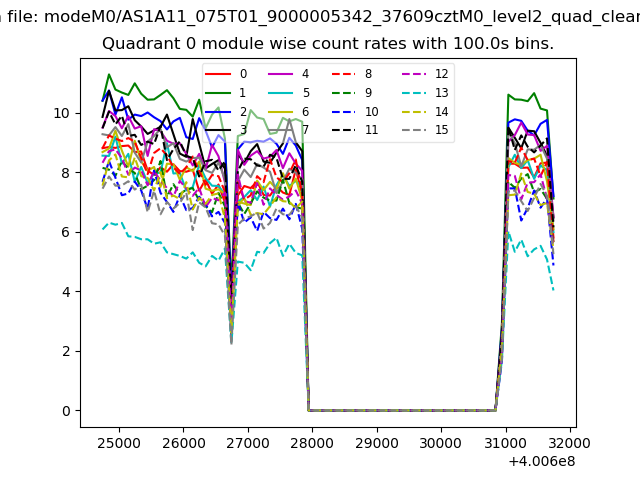
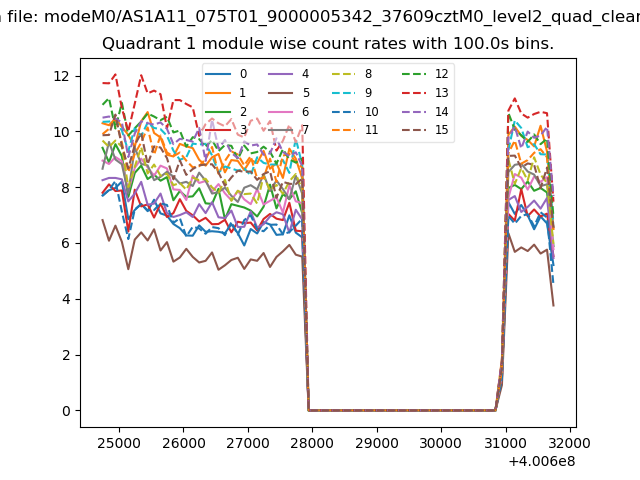
| Module-wise count rates for Quadrant A Data is divided into 100 sec bins |
 |
 |
| Module-wise count rates for Quadrant B Data is divided into 100 sec bins |
 |
 |
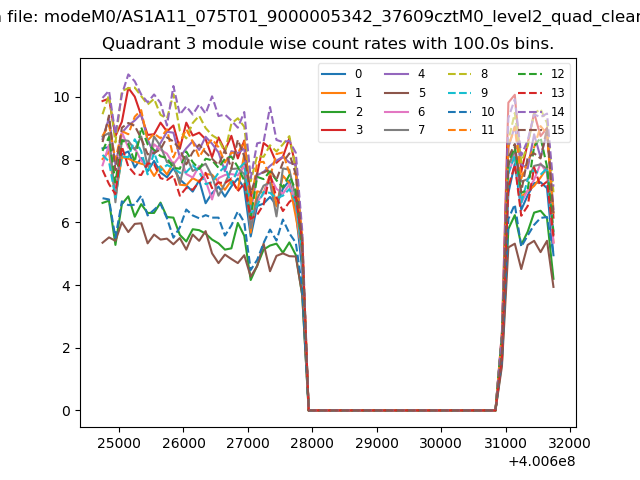
| Module-wise count rates for Quadrant C Data is divided into 100 sec bins |
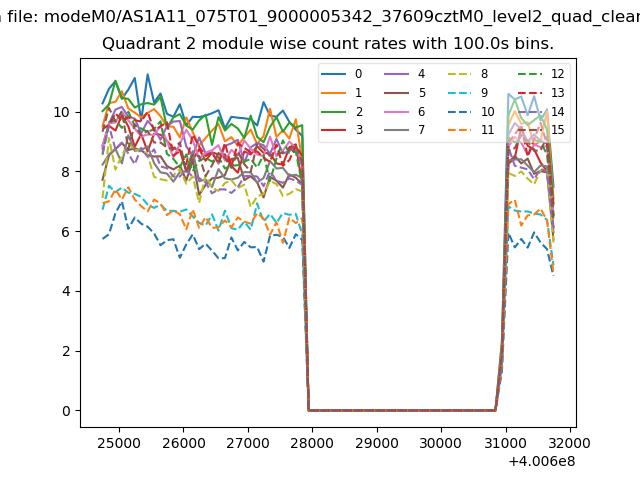 |
 |
| Module-wise count rates for Quadrant D Data is divided into 100 sec bins |
 |
 |
| Parameter | Plot |
|---|---|
| CZT HV Monitor |  |
| D_VDD | 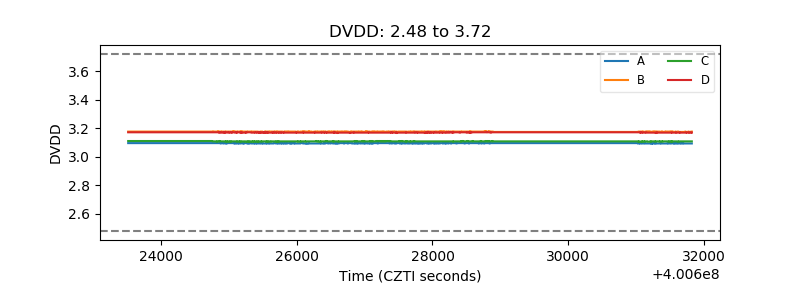 |
| Temperature 1 | 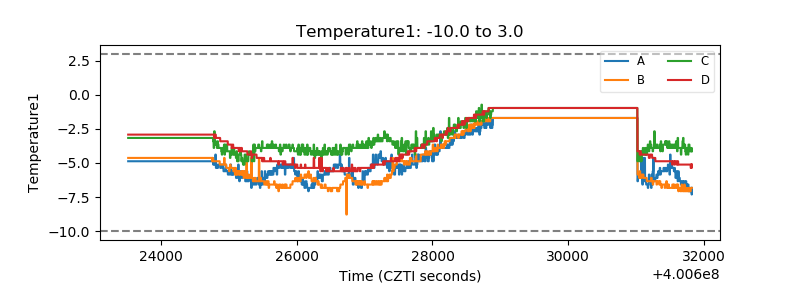 |
| Veto HV Monitor | 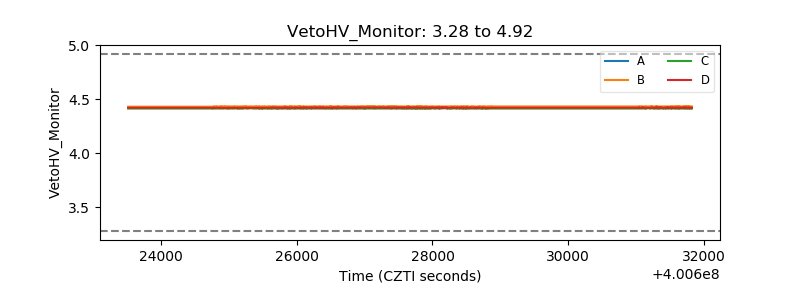 |
| Veto LLD | 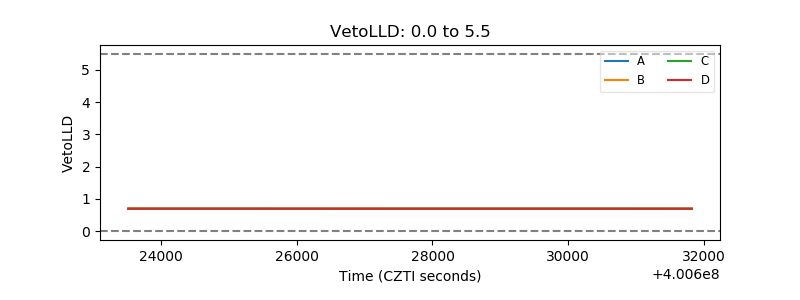 |
| Alpha Counter | 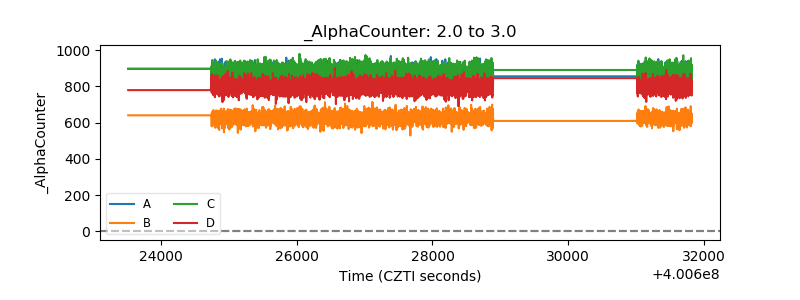 |
| _CPM_Rate | 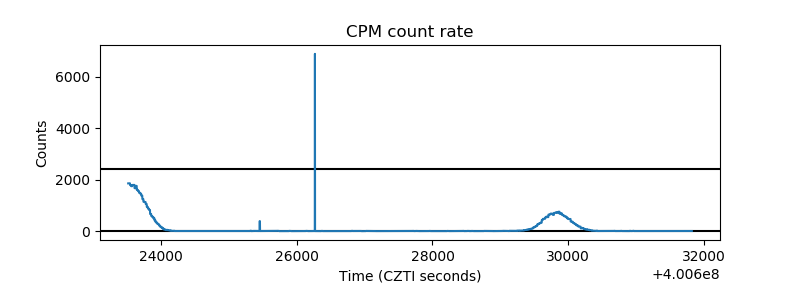 |
| CZT Counter | 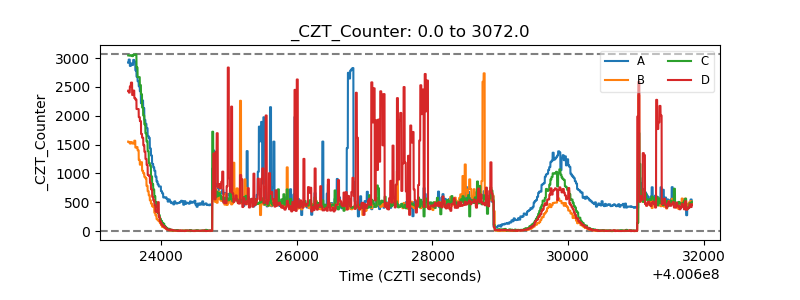 |
| +2.5 Volts monitor | 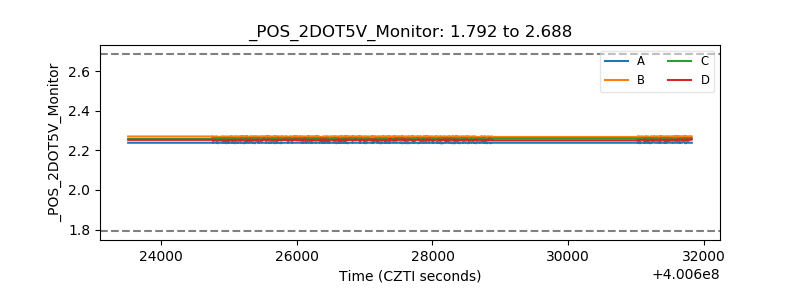 |
| +5 Volts monitor | 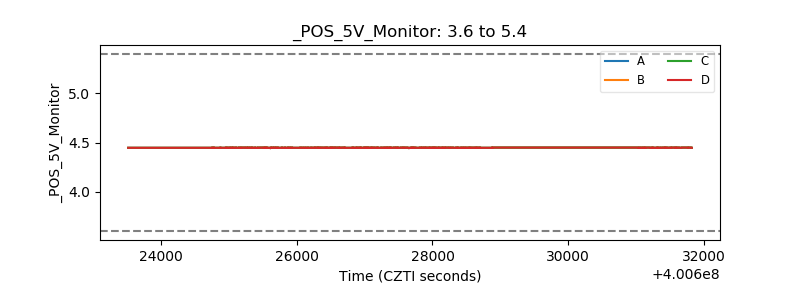 |
| _ROLL_ROT | 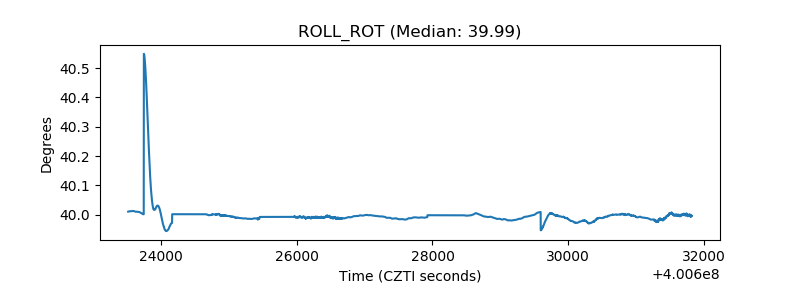 |
| _Roll_DEC | 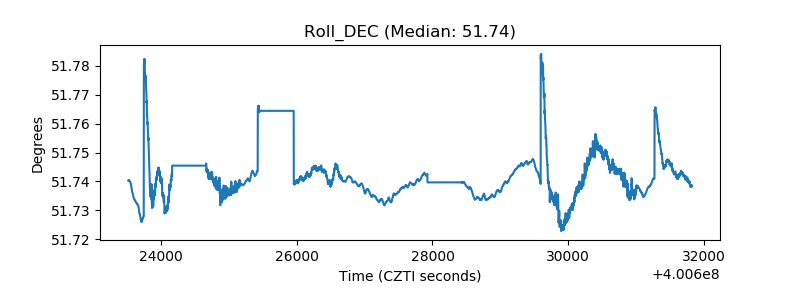 |
| _Roll_RA | 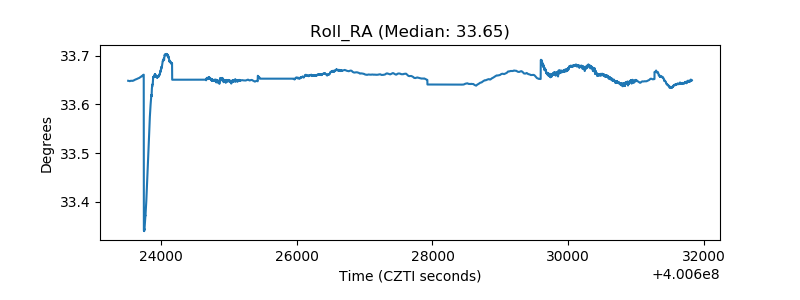 |
| Veto Counter | 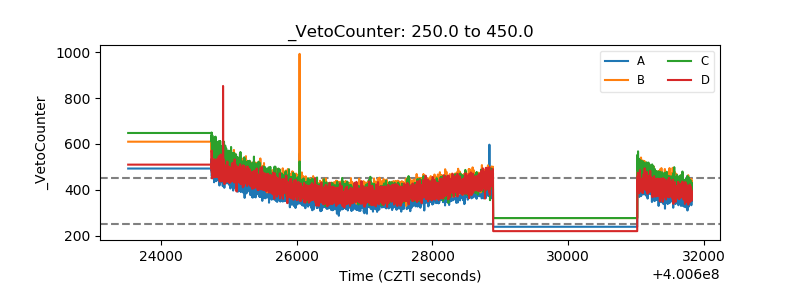 |