| Param | Original file | Final file |
|---|---|---|
| Filename | modeM0/AS1A11_075T01_9000005342_37610cztM0_level2.evt | modeM0/AS1A11_075T01_9000005342_37610cztM0_level2_quad_clean.evt |
| Size (bytes) | 409,043,520 | 71,087,040 |
| Size | 390.1 MB | 67.8 MB |
| Events in quadrant A | 2,942,445 | 436,522 |
| Events in quadrant B | 3,093,646 | 450,193 |
| Events in quadrant C | 2,793,389 | 453,570 |
| Events in quadrant D | 3,179,120 | 422,185 |
| Mode SS | |||
|---|---|---|---|
| Quadrant | BADHDUFLAG | Total packets | Discarded packets |
| A | 0 | 114 | 0 |
| B | 0 | 114 | 0 |
| C | 0 | 114 | 0 |
| D | 0 | 114 | 0 |
| Mode M0 | |||
|---|---|---|---|
| Quadrant | BADHDUFLAG | Total packets | Discarded packets |
| A | 0 | 12313 | 3 |
| B | 0 | 12942 | 2 |
| C | 0 | 11754 | 2 |
| D | 0 | 13513 | 2 |
| Mode M9 | |||
|---|---|---|---|
| Quadrant | BADHDUFLAG | Total packets | Discarded packets |
| A | 0 | 41 | 0 |
| B | 0 | 41 | 0 |
| C | 0 | 41 | 0 |
| D | 0 | 41 | 0 |
| Quadrant | Total seconds | Saturated seconds | Saturation percentage |
|---|---|---|---|
| A | 5579 | 19 | 0.340563% |
| B | 5579 | 155 | 2.778276% |
| C | 5579 | 28 | 0.501882% |
| D | 5579 | 180 | 3.226385% |
Noise dominated data is calculated using 1-second bins in cleaned event files. If a bin has >2000 counts, and if more than 50% of those come from <1% of pixels, then it is considered to be noise-dominated and hence unusable.
| Quadrant | # 1 sec bins | Bins with >0 counts | Bins with >2000 counts | High rate bins dominated by noise | Noise dominated (total time) | Noise dominated (detector-on time) | Marked lightcurve |
|---|---|---|---|---|---|---|---|
| A | 9676 | 5581 | 10 | 10 | 0.10% | 0.18% | 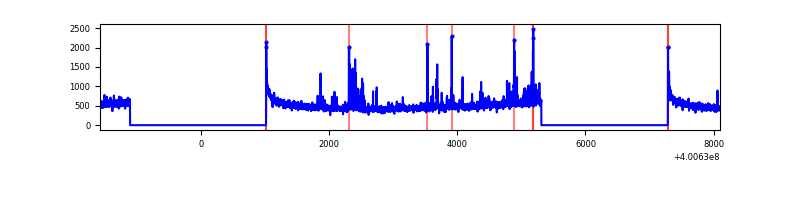 |
| B | 9676 | 5579 | 104 | 104 | 1.07% | 1.86% | 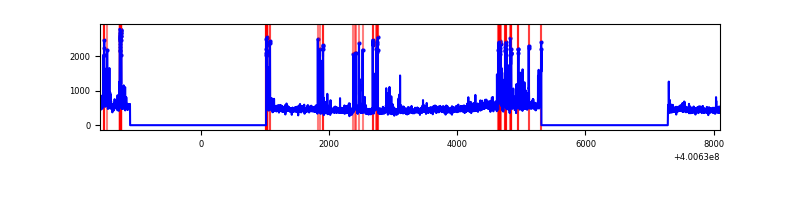 |
| C | 9676 | 5579 | 20 | 20 | 0.21% | 0.36% | 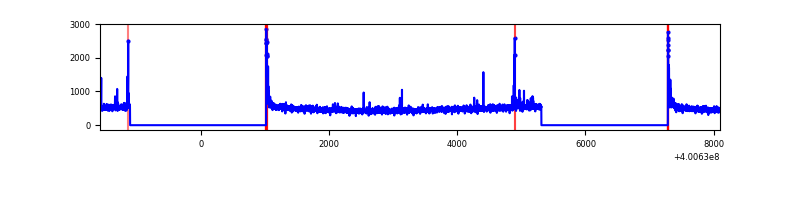 |
| D | 9676 | 5580 | 164 | 164 | 1.69% | 2.94% | 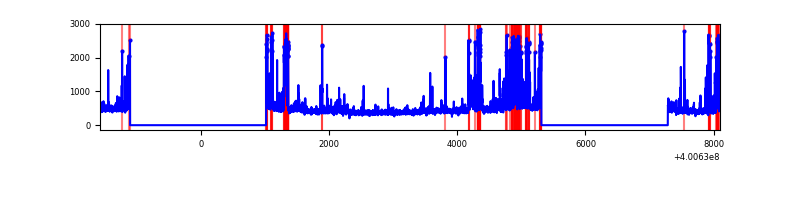 |
Top three noisy pixels from each quadrant. If the there are fewer than three noisy pixels in the level2.evt file, extra rows are filled as -1
| Pixel properties | Quadrant properties | ||||||
|---|---|---|---|---|---|---|---|
| Quadrant | DetID | PixID | Counts | Sigma | Mean | Median | Sigma |
| A | 10 | 83 | 311156 | 2452.67 | 628 | 616 | 126.6 |
| A | 9 | 143 | 117355 | 922.01 | 628 | 616 | 126.6 |
| A | 13 | 248 | 31625 | 244.91 | 628 | 616 | 126.6 |
| B | 5 | 172 | 342373 | 2838.58 | 624 | 607 | 120.4 |
| B | 5 | 200 | 141904 | 1173.56 | 624 | 607 | 120.4 |
| B | 0 | 230 | 45366 | 371.75 | 624 | 607 | 120.4 |
| C | 15 | 214 | 257150 | 1800.52 | 613 | 617 | 142.5 |
| C | 0 | 10 | 92487 | 644.8 | 613 | 617 | 142.5 |
| C | 14 | 254 | 48153 | 333.64 | 613 | 617 | 142.5 |
| D | 2 | 249 | 292063 | 2005.17 | 602 | 586 | 145.4 |
| D | 12 | 227 | 208219 | 1428.38 | 602 | 586 | 145.4 |
| D | 13 | 200 | 122991 | 842.07 | 602 | 586 | 145.4 |
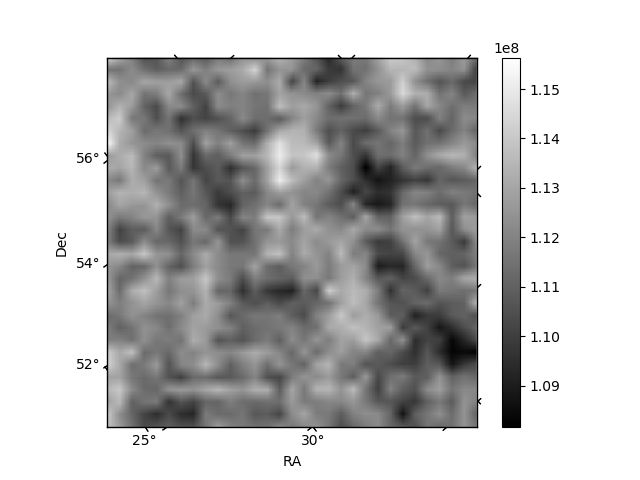
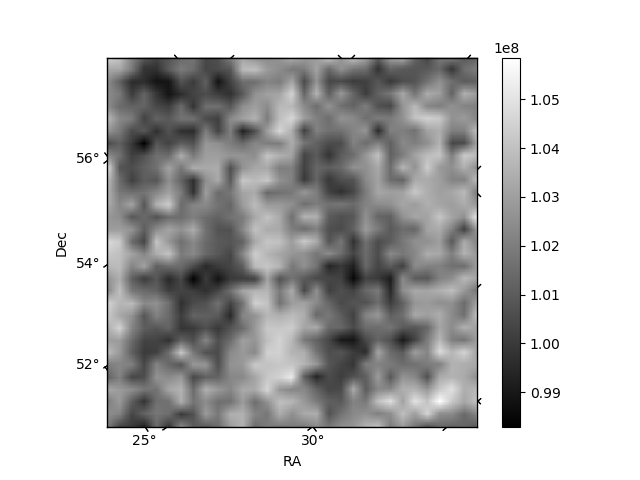
Histogram calculated using DETX and DETY for each event in the final _common_clean file
| Quadrant A | 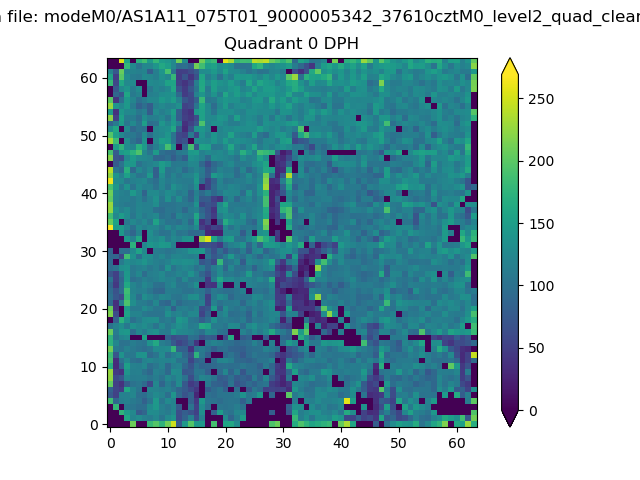 |
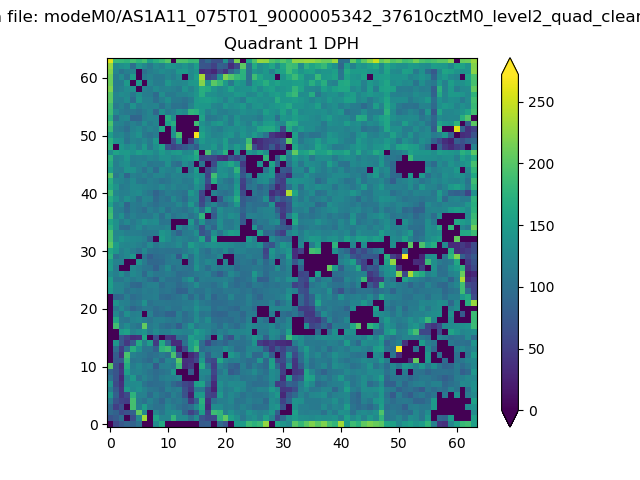 |
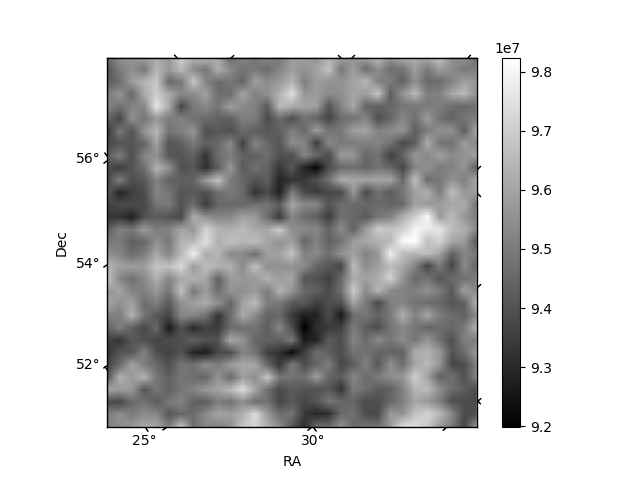
Quadrant B |
|---|---|---|---|
| Quadrant D | 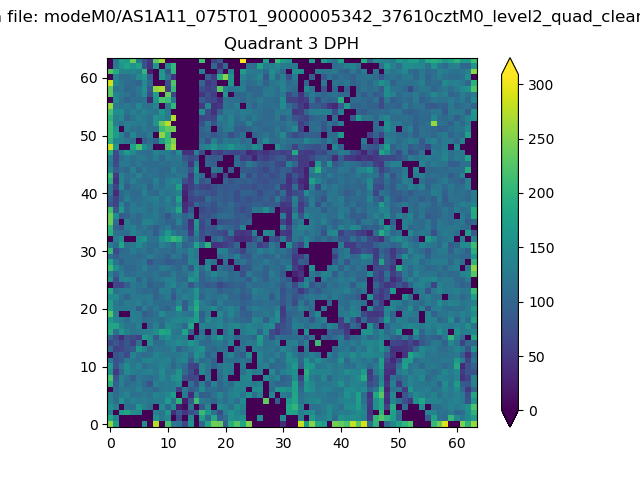 |
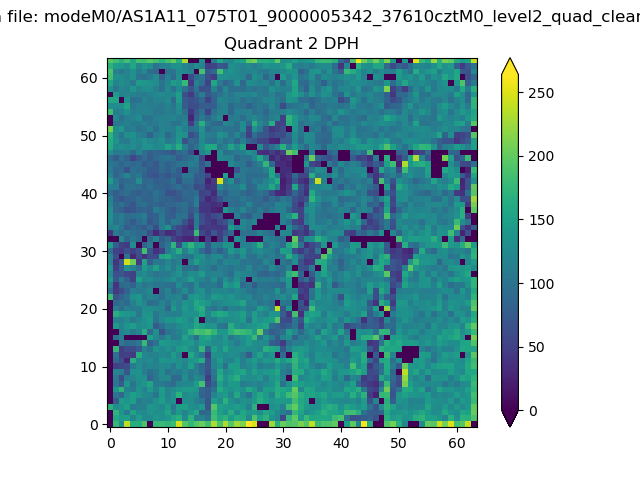 |
Quadrant C |
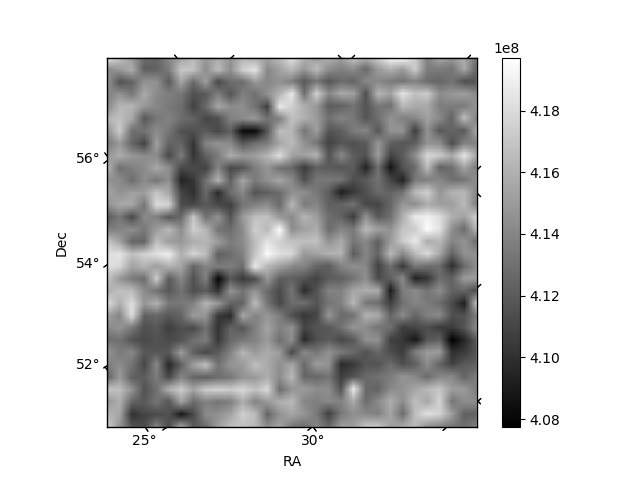
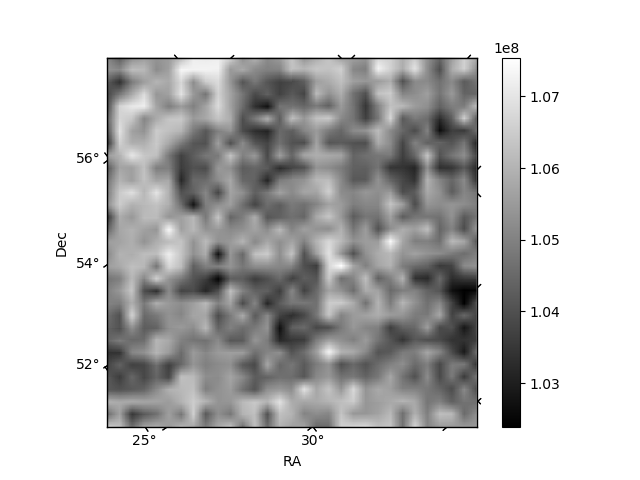
| Plot type | Count rate plots | Images |
|---|---|---|
| Comparison with Poisson distribution Blue bars denote a histogram of data divided into 1 sec bins. Red curve is a Poisson curve with rate = median count rate of data. |
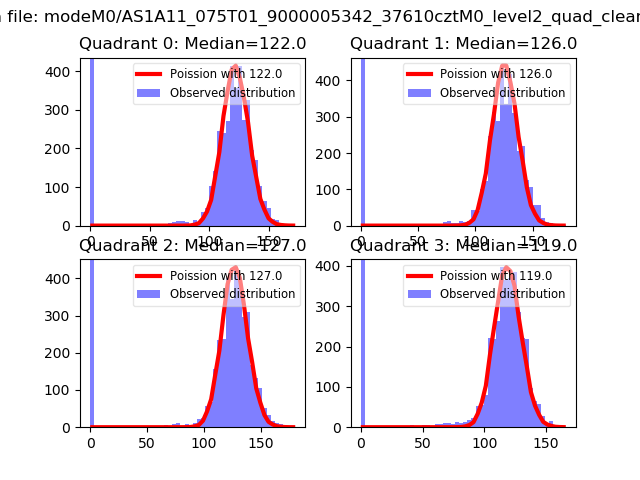 |
 |
| Quadrant-wise count rates Data is divided into 100 sec bins |
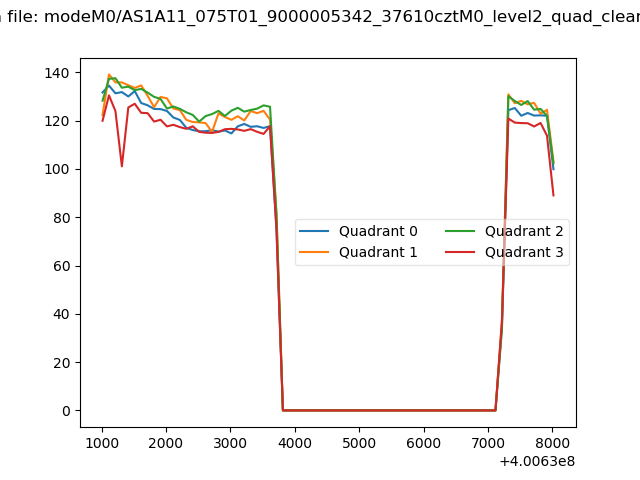 |
|
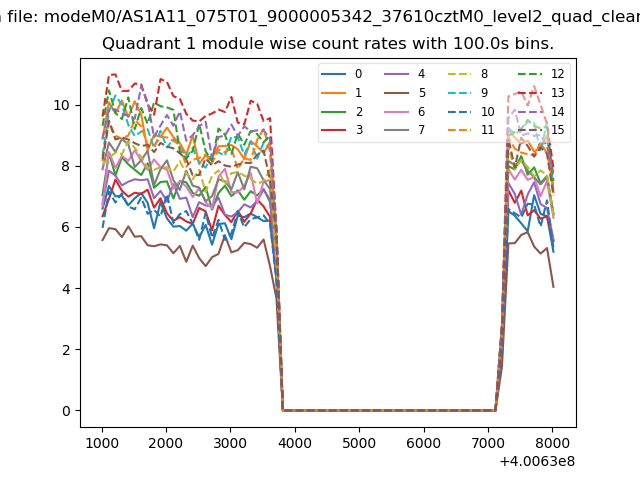
| Module-wise count rates for Quadrant A Data is divided into 100 sec bins |
 |
 |
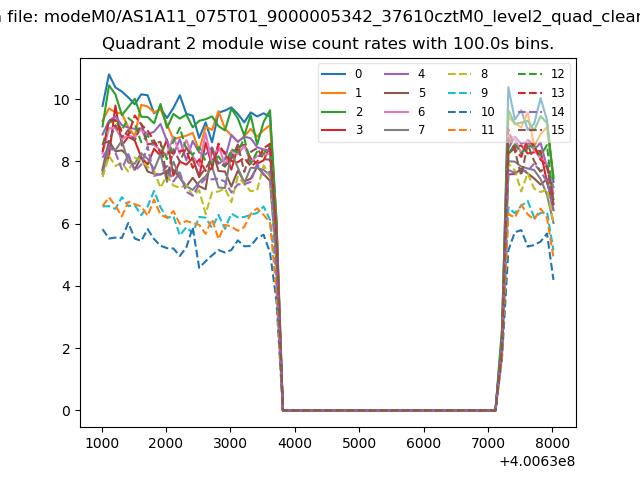
| Module-wise count rates for Quadrant B Data is divided into 100 sec bins |
 |
 |
| Module-wise count rates for Quadrant C Data is divided into 100 sec bins |
 |
 |
| Module-wise count rates for Quadrant D Data is divided into 100 sec bins |
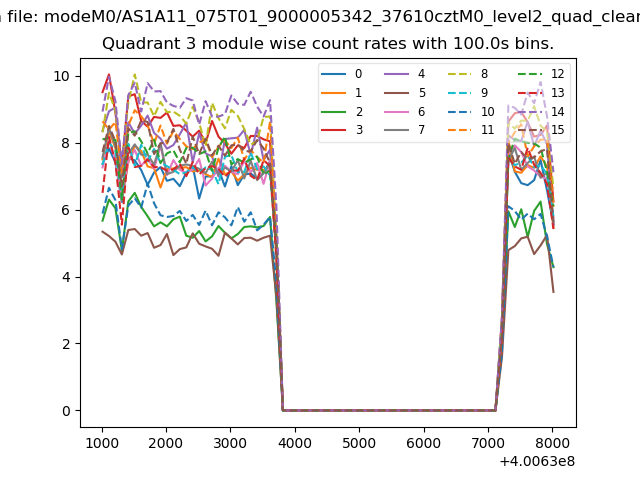 |
 |
| Parameter | Plot |
|---|---|
| CZT HV Monitor | 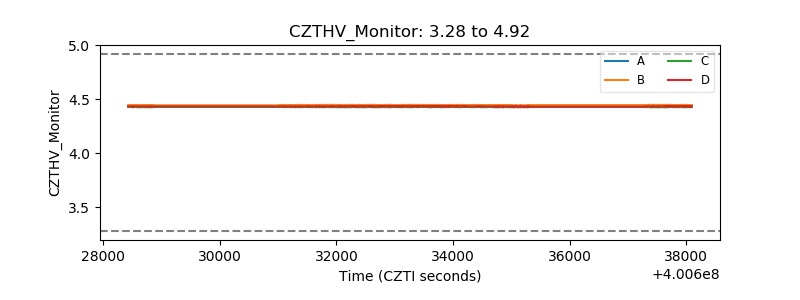 |
| D_VDD | 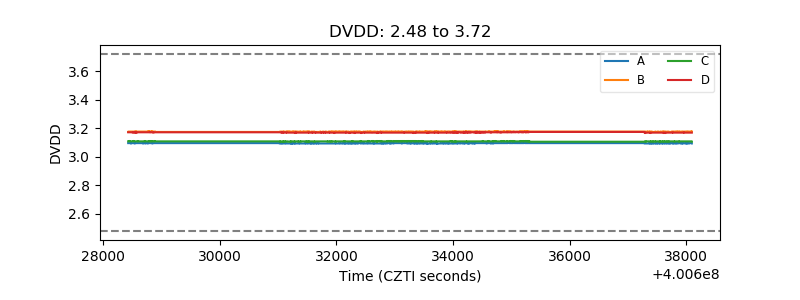 |
| Temperature 1 | 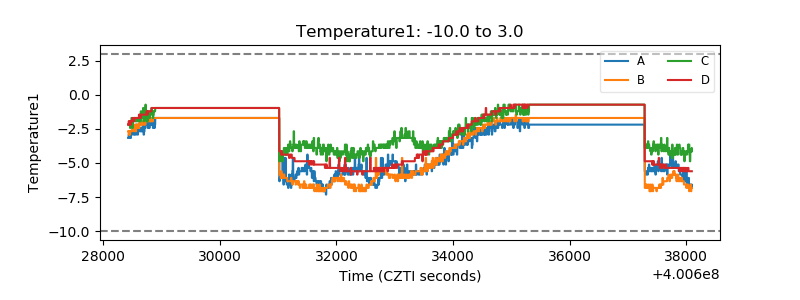 |
| Veto HV Monitor | 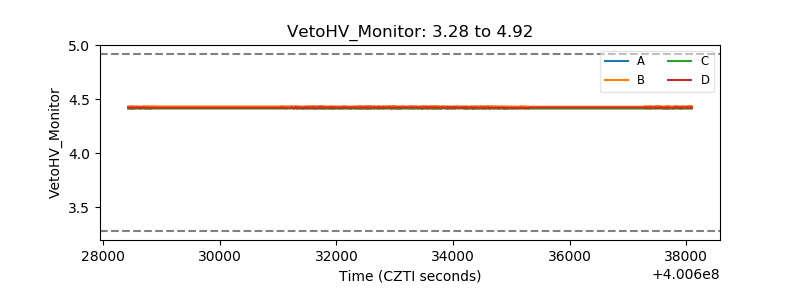 |
| Veto LLD | 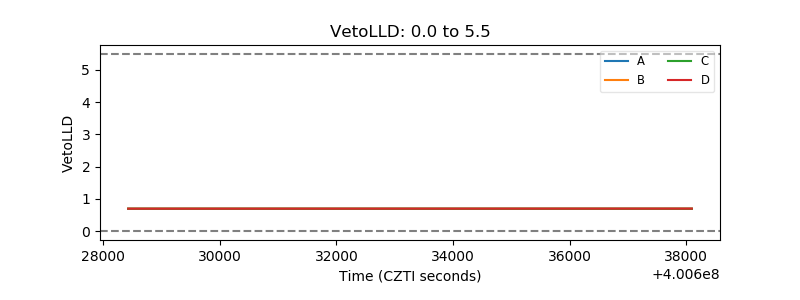 |
| Alpha Counter | 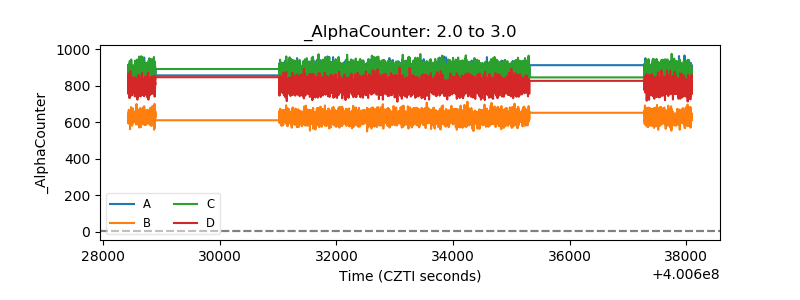 |
| _CPM_Rate | 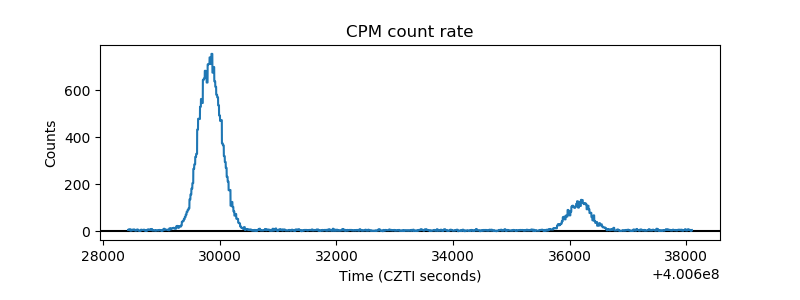 |
| CZT Counter | 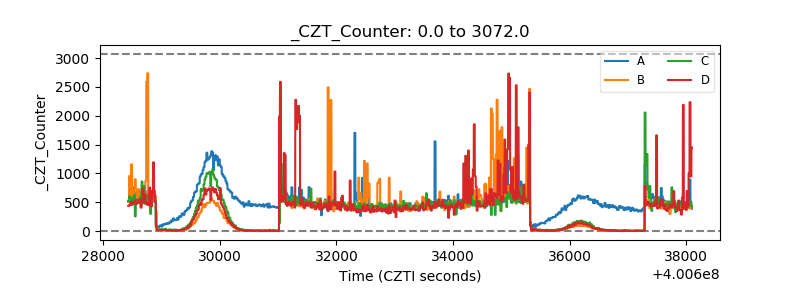 |
| +2.5 Volts monitor | 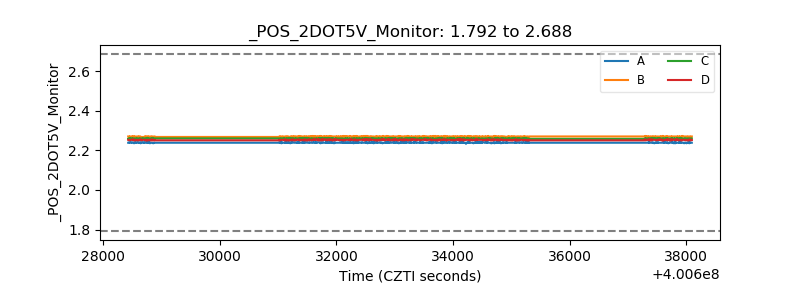 |
| +5 Volts monitor | 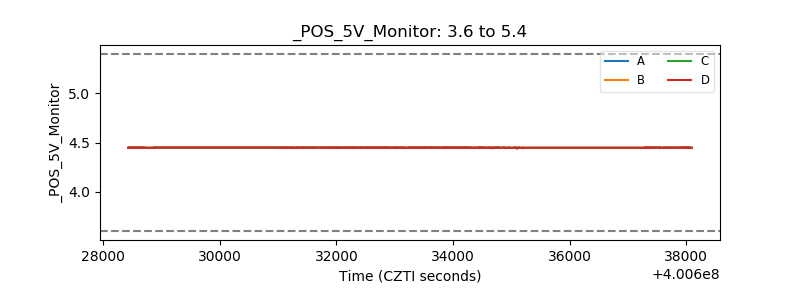 |
| _ROLL_ROT | 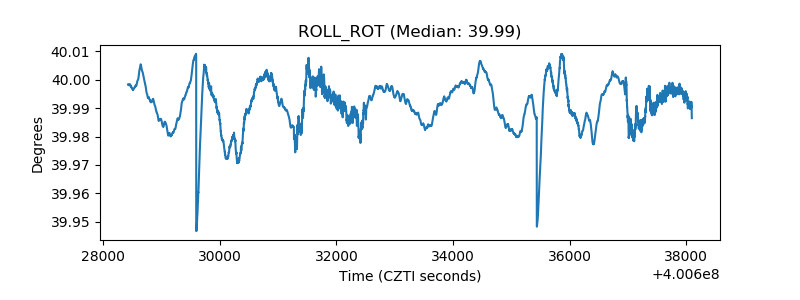 |
| _Roll_DEC | 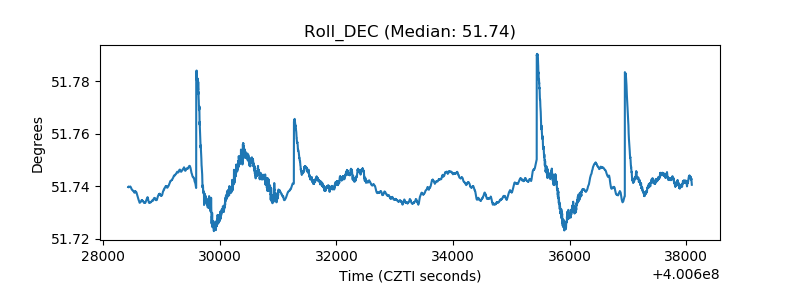 |
| _Roll_RA | 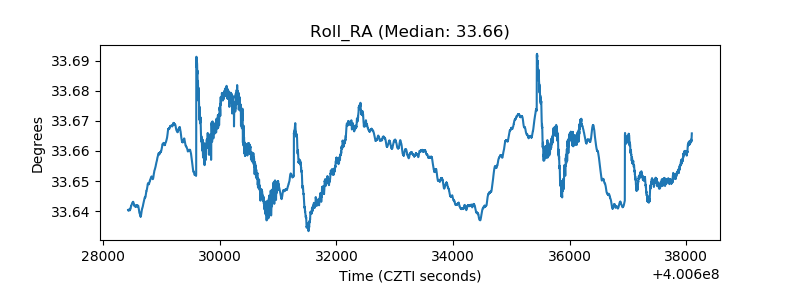 |
| Veto Counter | 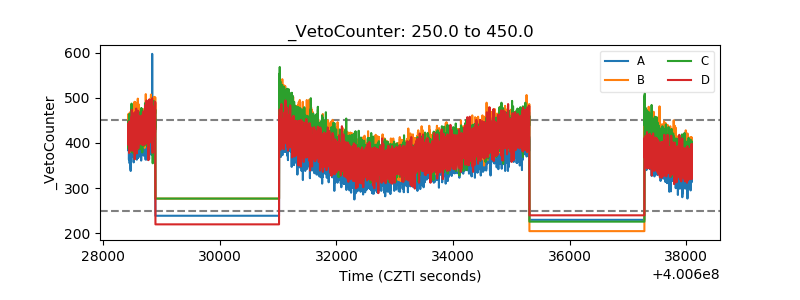 |