| Param | Original file | Final file |
|---|---|---|
| Filename | modeM0/AS1A11_075T01_9000005342_37612cztM0_level2.evt | modeM0/AS1A11_075T01_9000005342_37612cztM0_level2_quad_clean.evt |
| Size (bytes) | 506,016,000 | 79,087,680 |
| Size | 482.6 MB | 75.4 MB |
| Events in quadrant A | 3,314,470 | 483,923 |
| Events in quadrant B | 3,402,944 | 496,939 |
| Events in quadrant C | 3,217,995 | 499,313 |
| Events in quadrant D | 4,948,075 | 461,316 |
| Mode SS | |||
|---|---|---|---|
| Quadrant | BADHDUFLAG | Total packets | Discarded packets |
| A | 0 | 134 | 0 |
| B | 0 | 134 | 0 |
| C | 0 | 134 | 0 |
| D | 0 | 134 | 0 |
| Mode M0 | |||
|---|---|---|---|
| Quadrant | BADHDUFLAG | Total packets | Discarded packets |
| A | 0 | 13840 | 3 |
| B | 0 | 14511 | 2 |
| C | 0 | 13563 | 2 |
| D | 0 | 19357 | 2 |
| Mode M9 | |||
|---|---|---|---|
| Quadrant | BADHDUFLAG | Total packets | Discarded packets |
| A | 0 | 31 | 0 |
| B | 0 | 31 | 0 |
| C | 0 | 31 | 0 |
| D | 0 | 31 | 0 |
| Quadrant | Total seconds | Saturated seconds | Saturation percentage |
|---|---|---|---|
| A | 6499 | 16 | 0.246192% |
| B | 6499 | 79 | 1.215572% |
| C | 6499 | 12 | 0.184644% |
| D | 6499 | 666 | 10.247730% |
Noise dominated data is calculated using 1-second bins in cleaned event files. If a bin has >2000 counts, and if more than 50% of those come from <1% of pixels, then it is considered to be noise-dominated and hence unusable.
| Quadrant | # 1 sec bins | Bins with >0 counts | Bins with >2000 counts | High rate bins dominated by noise | Noise dominated (total time) | Noise dominated (detector-on time) | Marked lightcurve |
|---|---|---|---|---|---|---|---|
| A | 9575 | 6501 | 10 | 10 | 0.10% | 0.15% | 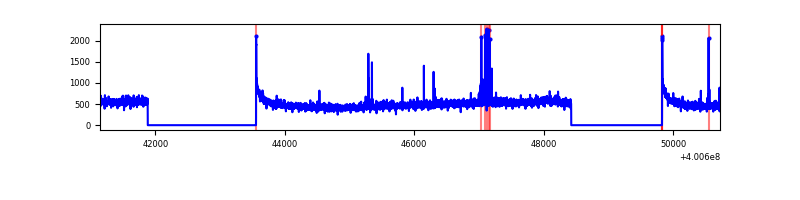 |
| B | 9575 | 6499 | 35 | 35 | 0.37% | 0.54% | 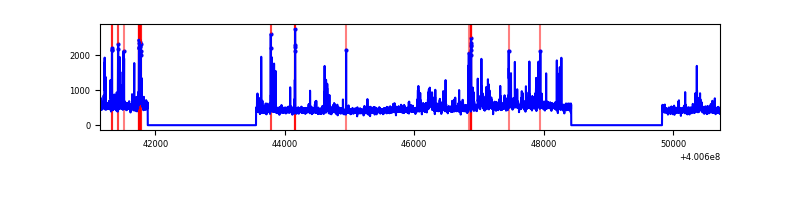 |
| C | 9575 | 6499 | 7 | 7 | 0.07% | 0.11% | 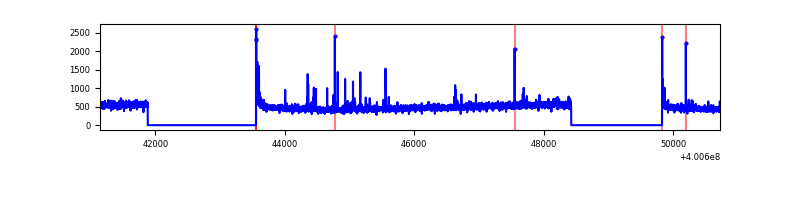 |
| D | 9575 | 6501 | 639 | 639 | 6.67% | 9.83% | 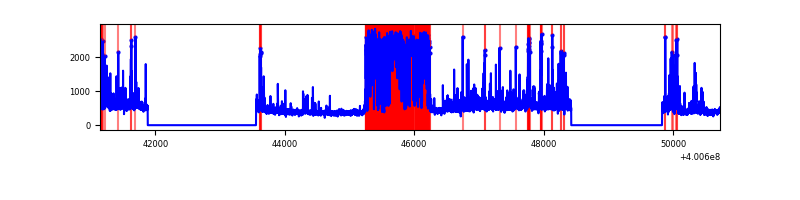 |
Top three noisy pixels from each quadrant. If the there are fewer than three noisy pixels in the level2.evt file, extra rows are filled as -1
| Pixel properties | Quadrant properties | ||||||
|---|---|---|---|---|---|---|---|
| Quadrant | DetID | PixID | Counts | Sigma | Mean | Median | Sigma |
| A | 10 | 83 | 358280 | 2394.07 | 736 | 721 | 149.4 |
| A | 9 | 143 | 61217 | 405.06 | 736 | 721 | 149.4 |
| A | 12 | 189 | 25973 | 169.08 | 736 | 721 | 149.4 |
| B | 5 | 172 | 161429 | 1142.14 | 732 | 711 | 140.7 |
| B | 0 | 189 | 76388 | 537.8 | 732 | 711 | 140.7 |
| B | 0 | 230 | 59277 | 416.2 | 732 | 711 | 140.7 |
| C | 15 | 214 | 299761 | 1786.79 | 719 | 724 | 167.4 |
| C | 0 | 10 | 51086 | 300.92 | 719 | 724 | 167.4 |
| C | 12 | 249 | 27816 | 161.88 | 719 | 724 | 167.4 |
| D | 2 | 249 | 1617533 | 9852.98 | 682 | 663 | 164.1 |
| D | 2 | 153 | 192663 | 1170.02 | 682 | 663 | 164.1 |
| D | 2 | 250 | 124212 | 752.89 | 682 | 663 | 164.1 |
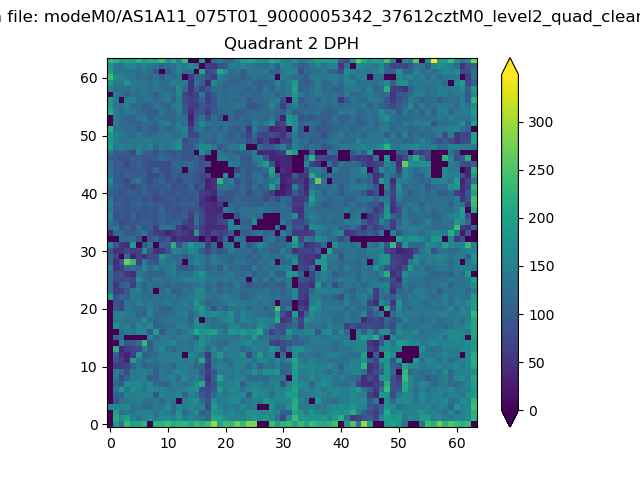
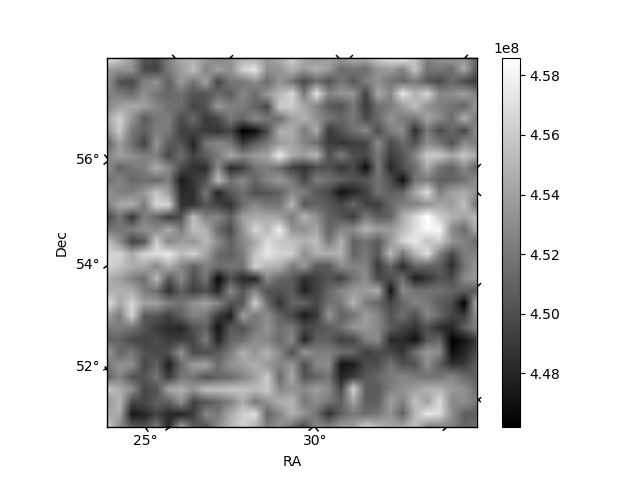
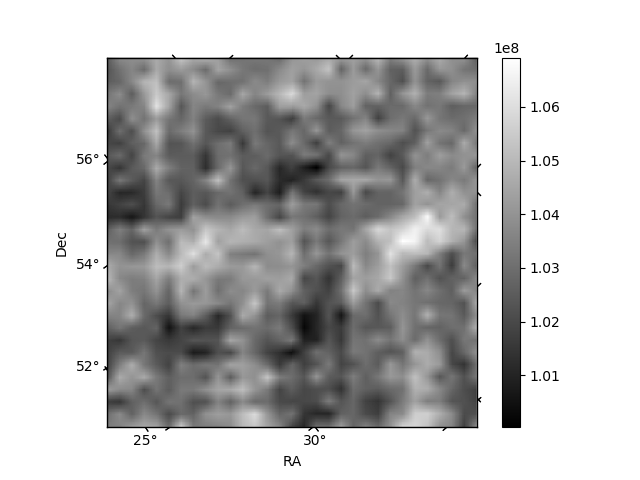
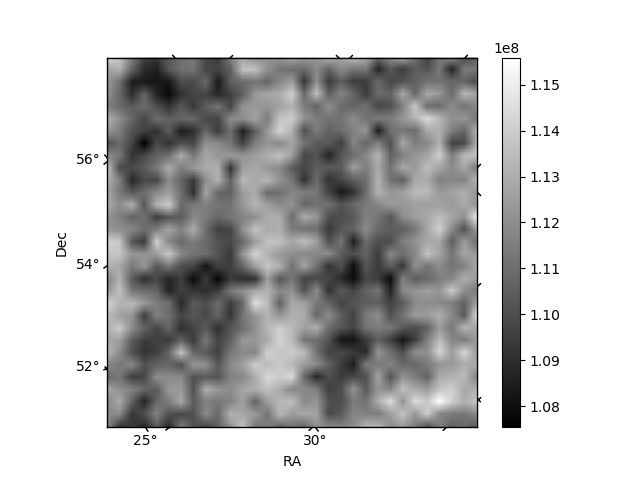
Histogram calculated using DETX and DETY for each event in the final _common_clean file
| Quadrant A | 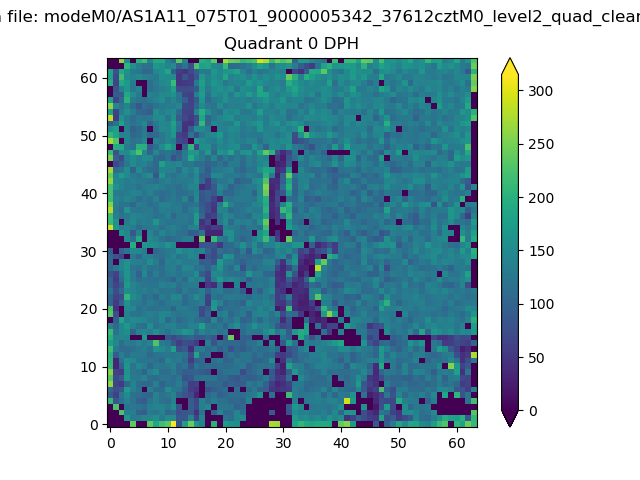 |
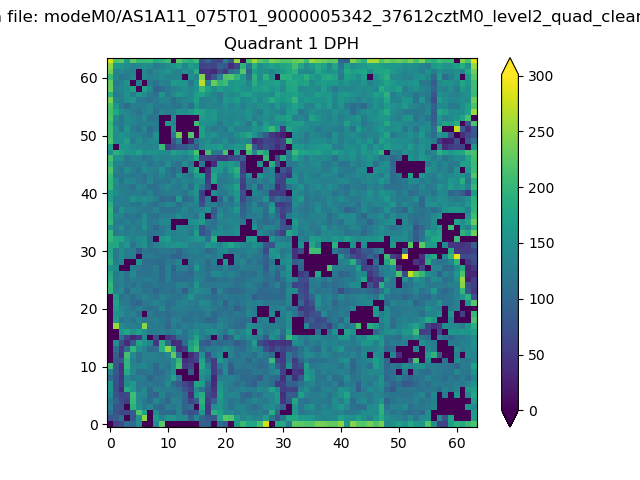 |
Quadrant B |
|---|---|---|---|
| Quadrant D | 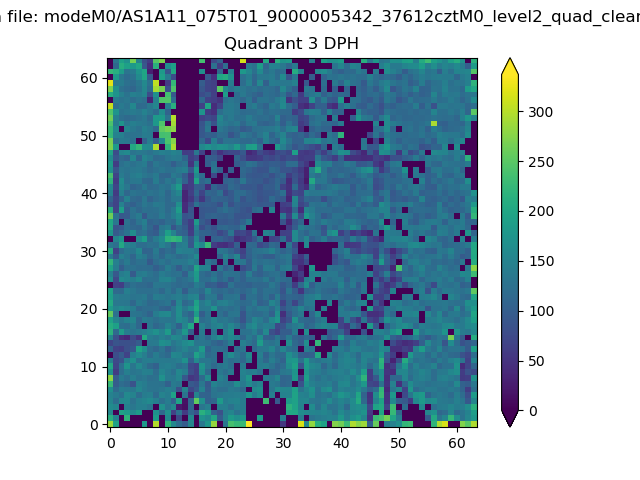 |
 |
Quadrant C |
| Plot type | Count rate plots | Images |
|---|---|---|
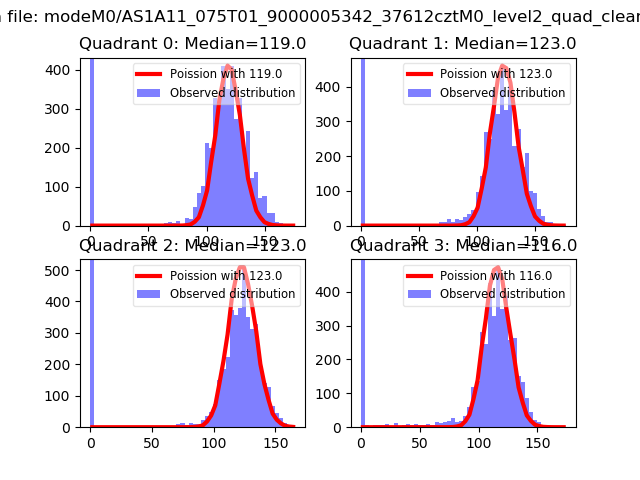
| Comparison with Poisson distribution Blue bars denote a histogram of data divided into 1 sec bins. Red curve is a Poisson curve with rate = median count rate of data. |
 |
 |
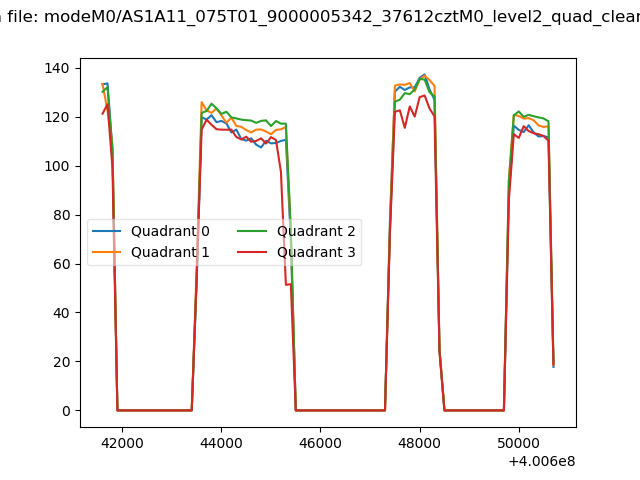
| Quadrant-wise count rates Data is divided into 100 sec bins |
 |
|
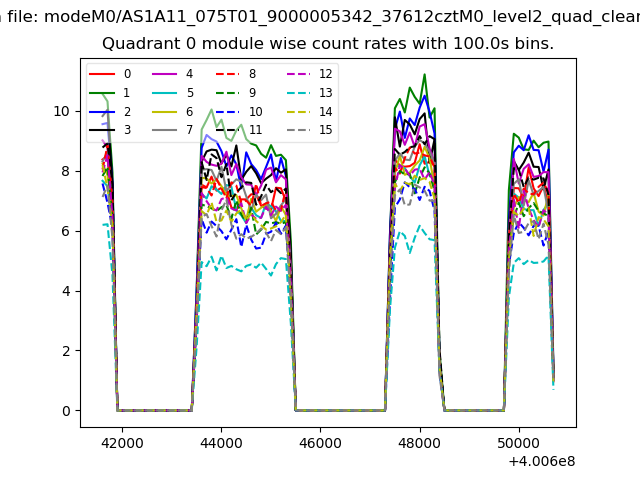
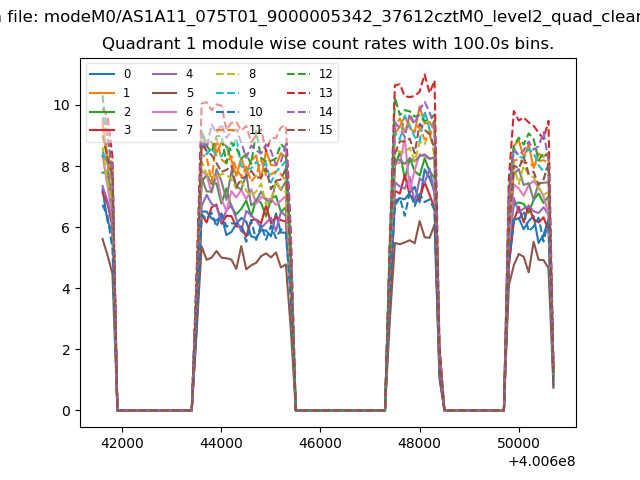
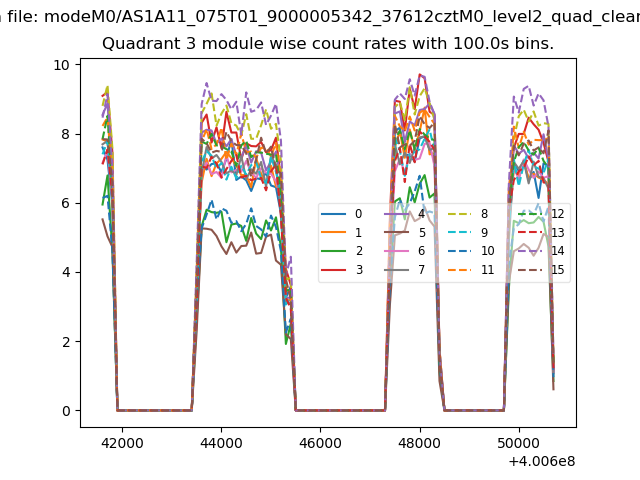
| Module-wise count rates for Quadrant A Data is divided into 100 sec bins |
 |
 |
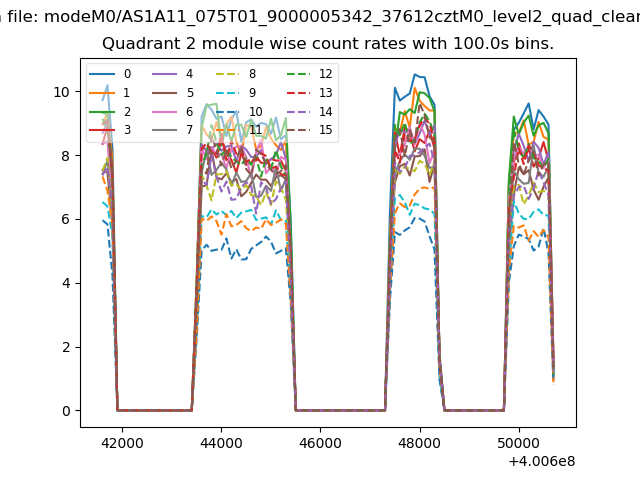
| Module-wise count rates for Quadrant B Data is divided into 100 sec bins |
 |
 |
| Module-wise count rates for Quadrant C Data is divided into 100 sec bins |
 |
 |
| Module-wise count rates for Quadrant D Data is divided into 100 sec bins |
 |
 |
| Parameter | Plot |
|---|---|
| CZT HV Monitor | 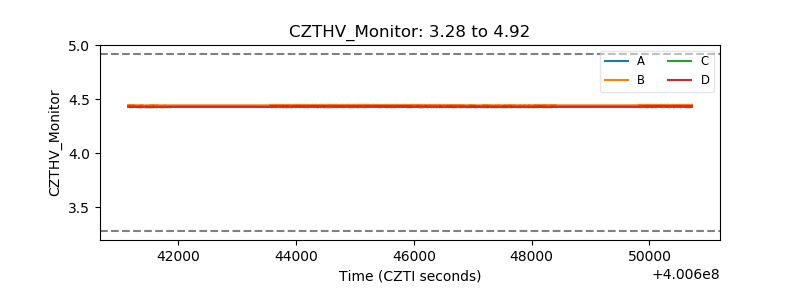 |
| D_VDD | 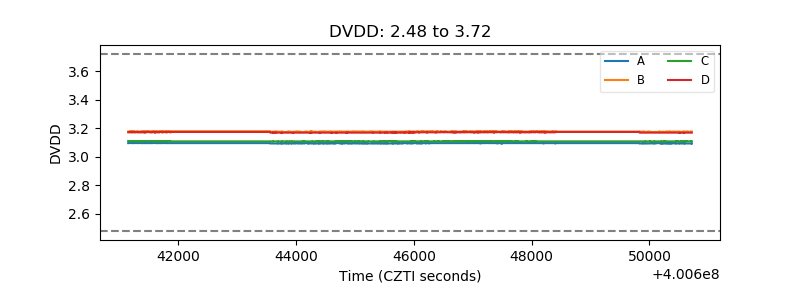 |
| Temperature 1 | 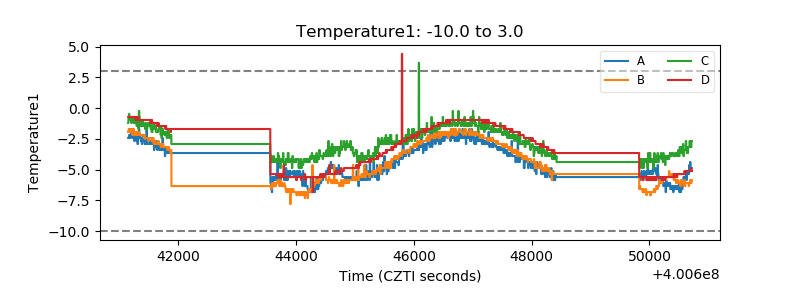 |
| Veto HV Monitor | 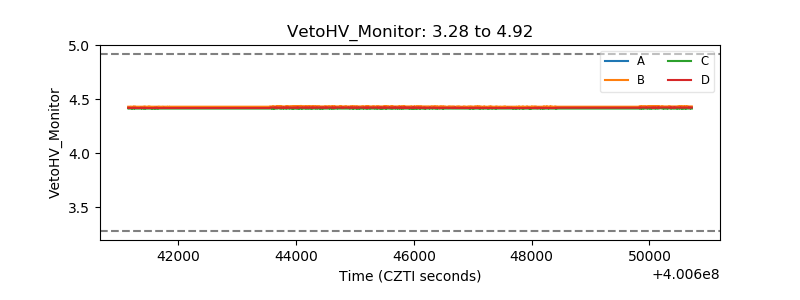 |
| Veto LLD | 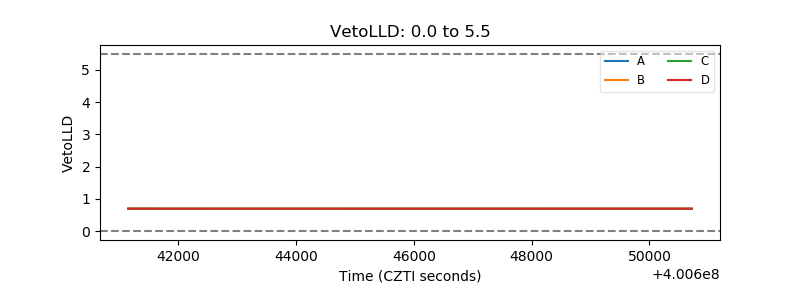 |
| Alpha Counter | 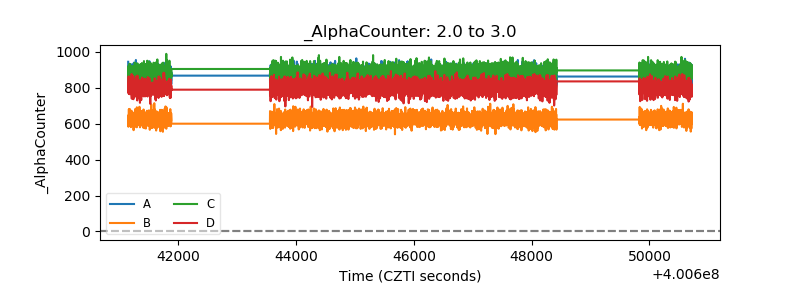 |
| _CPM_Rate | 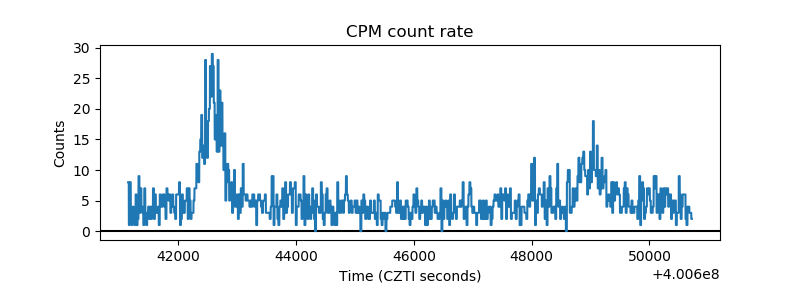 |
| CZT Counter | 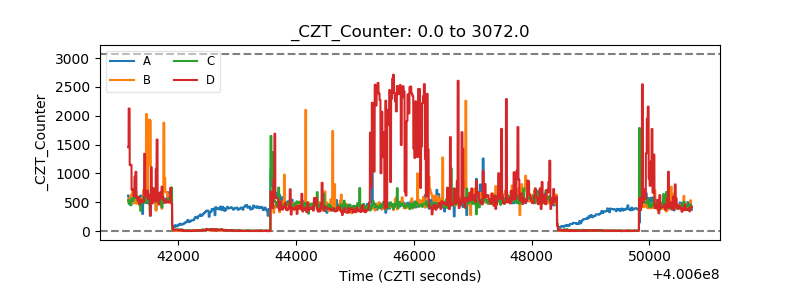 |
| +2.5 Volts monitor | 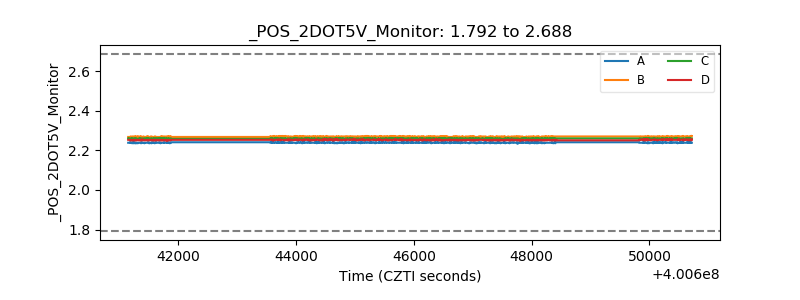 |
| +5 Volts monitor | 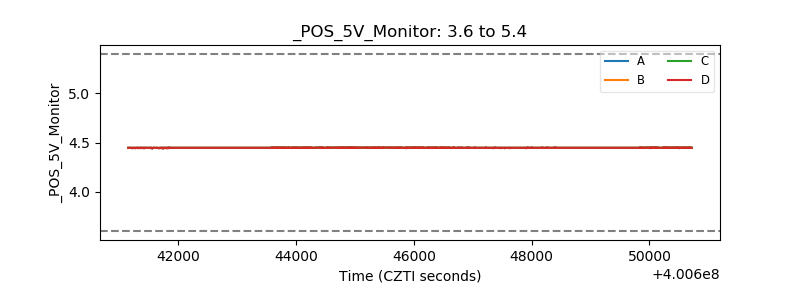 |
| _ROLL_ROT | 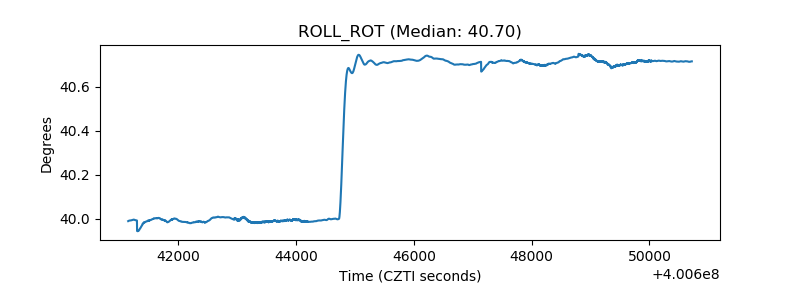 |
| _Roll_DEC | 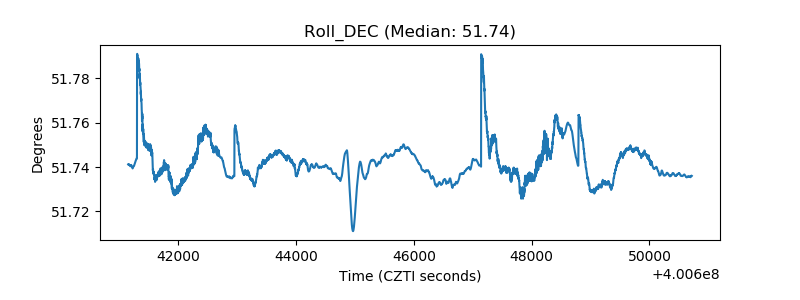 |
| _Roll_RA | 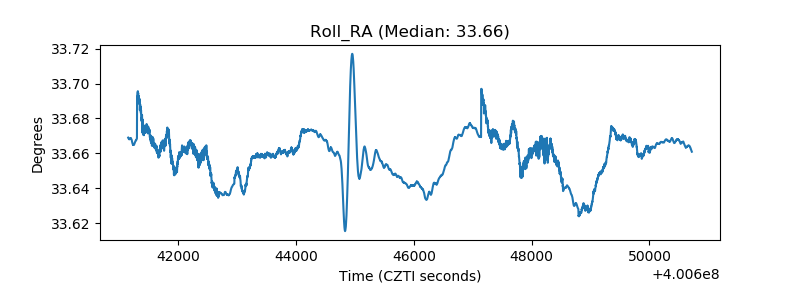 |
| Veto Counter | 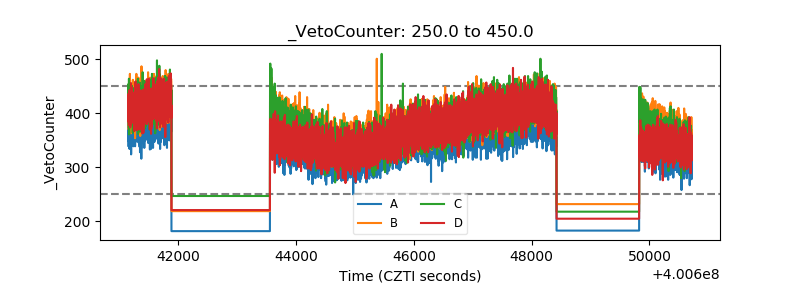 |