| Param | Original file | Final file |
|---|---|---|
| Filename | modeM0/AS1A11_075T01_9000005342_37613cztM0_level2.evt | modeM0/AS1A11_075T01_9000005342_37613cztM0_level2_quad_clean.evt |
| Size (bytes) | 428,218,560 | 74,848,320 |
| Size | 408.4 MB | 71.4 MB |
| Events in quadrant A | 2,923,224 | 461,130 |
| Events in quadrant B | 3,501,411 | 472,801 |
| Events in quadrant C | 2,839,273 | 476,419 |
| Events in quadrant D | 3,306,527 | 446,933 |
| Mode SS | |||
|---|---|---|---|
| Quadrant | BADHDUFLAG | Total packets | Discarded packets |
| A | 0 | 120 | 0 |
| B | 0 | 120 | 0 |
| C | 0 | 120 | 0 |
| D | 0 | 120 | 0 |
| Mode M0 | |||
|---|---|---|---|
| Quadrant | BADHDUFLAG | Total packets | Discarded packets |
| A | 0 | 12191 | 3 |
| B | 0 | 14415 | 2 |
| C | 0 | 12014 | 2 |
| D | 0 | 14026 | 2 |
| Mode M9 | |||
|---|---|---|---|
| Quadrant | BADHDUFLAG | Total packets | Discarded packets |
| A | 0 | 13 | 0 |
| B | 0 | 13 | 0 |
| C | 0 | 13 | 0 |
| D | 0 | 13 | 0 |
| Quadrant | Total seconds | Saturated seconds | Saturation percentage |
|---|---|---|---|
| A | 5852 | 8 | 0.136705% |
| B | 5852 | 298 | 5.092276% |
| C | 5852 | 9 | 0.153794% |
| D | 5852 | 138 | 2.358168% |
Noise dominated data is calculated using 1-second bins in cleaned event files. If a bin has >2000 counts, and if more than 50% of those come from <1% of pixels, then it is considered to be noise-dominated and hence unusable.
| Quadrant | # 1 sec bins | Bins with >0 counts | Bins with >2000 counts | High rate bins dominated by noise | Noise dominated (total time) | Noise dominated (detector-on time) | Marked lightcurve |
|---|---|---|---|---|---|---|---|
| A | 7165 | 5853 | 2 | 2 | 0.03% | 0.03% | 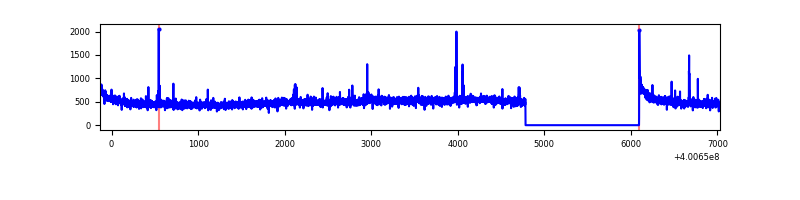 |
| B | 7165 | 5852 | 242 | 242 | 3.38% | 4.14% | 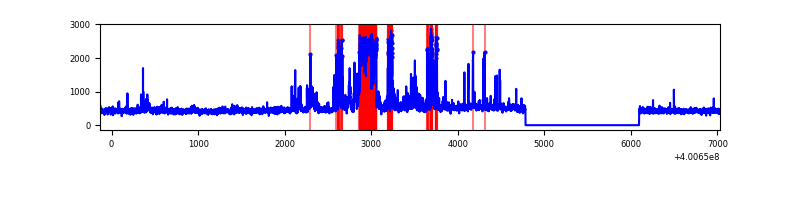 |
| C | 7165 | 5852 | 10 | 10 | 0.14% | 0.17% | 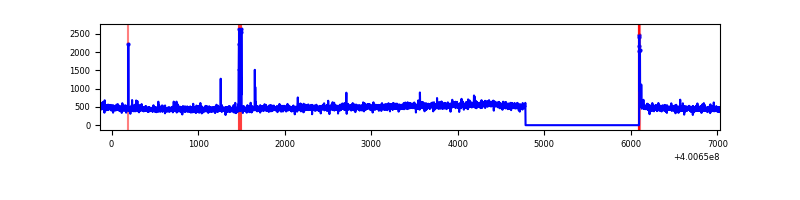 |
| D | 7165 | 5853 | 94 | 94 | 1.31% | 1.61% | 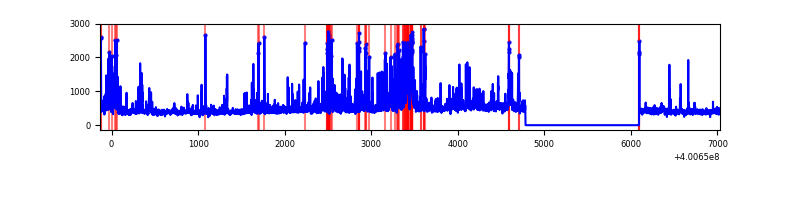 |
Top three noisy pixels from each quadrant. If the there are fewer than three noisy pixels in the level2.evt file, extra rows are filled as -1
| Pixel properties | Quadrant properties | ||||||
|---|---|---|---|---|---|---|---|
| Quadrant | DetID | PixID | Counts | Sigma | Mean | Median | Sigma |
| A | 10 | 83 | 314963 | 2360.11 | 658 | 644 | 133.2 |
| A | 9 | 143 | 28102 | 206.17 | 658 | 644 | 133.2 |
| A | 12 | 189 | 14898 | 107.03 | 658 | 644 | 133.2 |
| B | 5 | 172 | 665536 | 5333.0 | 642 | 623 | 124.7 |
| B | 0 | 189 | 112713 | 899.03 | 642 | 623 | 124.7 |
| B | 5 | 200 | 66035 | 524.64 | 642 | 623 | 124.7 |
| C | 15 | 214 | 271030 | 1803.63 | 641 | 645 | 149.9 |
| C | 15 | 208 | 24693 | 160.41 | 641 | 645 | 149.9 |
| C | 0 | 10 | 24034 | 156.02 | 641 | 645 | 149.9 |
| D | 2 | 250 | 307567 | 1998.71 | 633 | 616 | 153.6 |
| D | 2 | 153 | 123195 | 798.17 | 633 | 616 | 153.6 |
| D | 13 | 249 | 90910 | 587.95 | 633 | 616 | 153.6 |
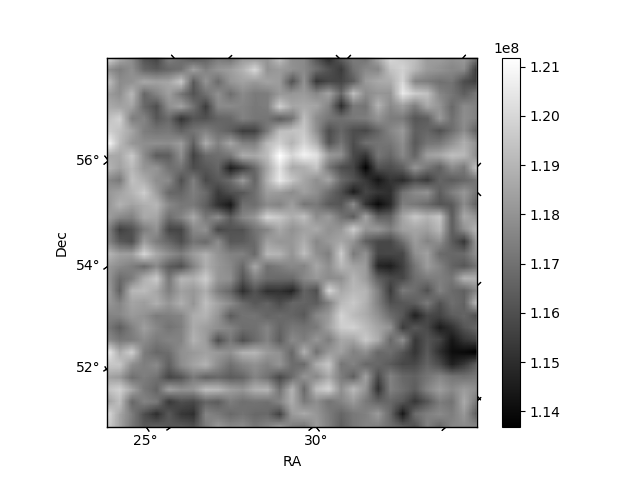
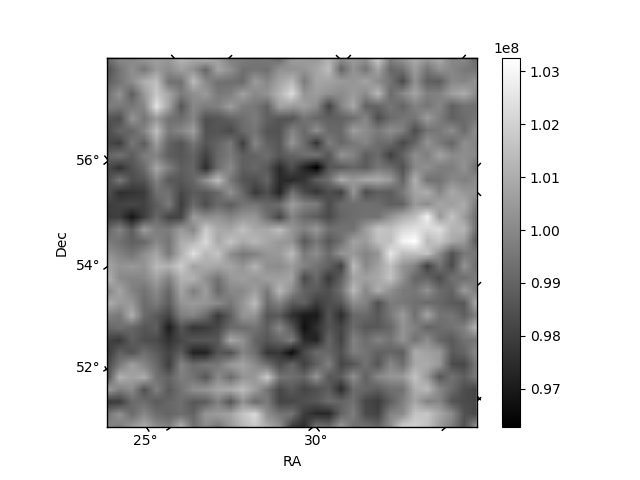
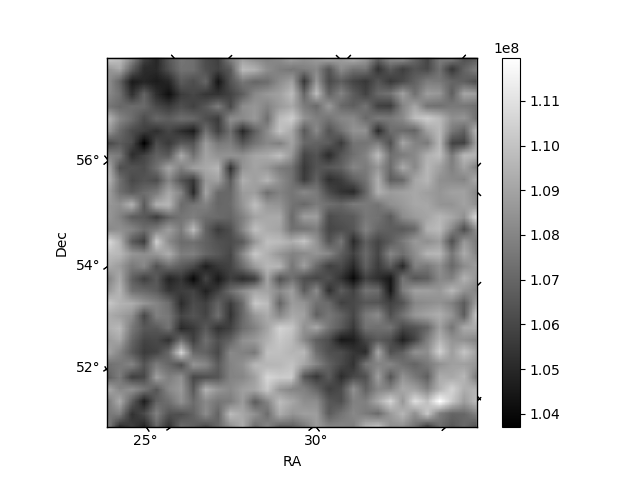
Histogram calculated using DETX and DETY for each event in the final _common_clean file
| Quadrant A | 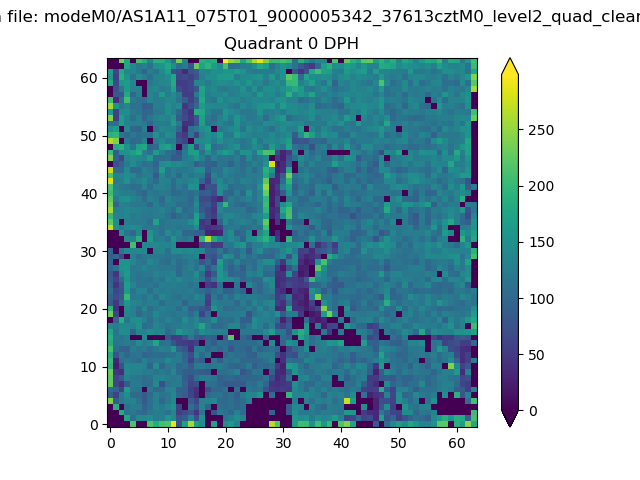 |
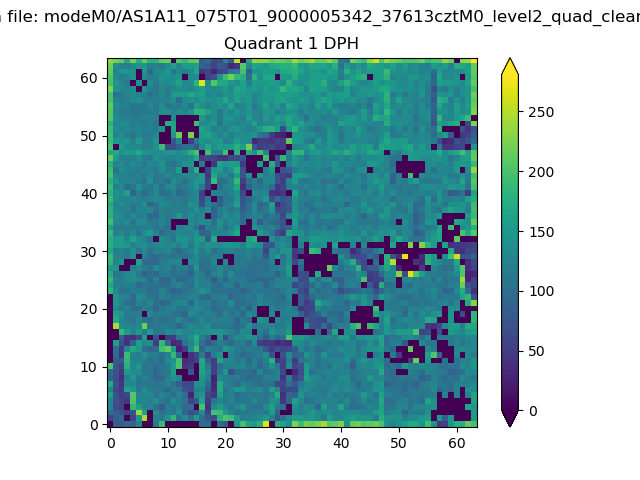 |
Quadrant B |
|---|---|---|---|
| Quadrant D | 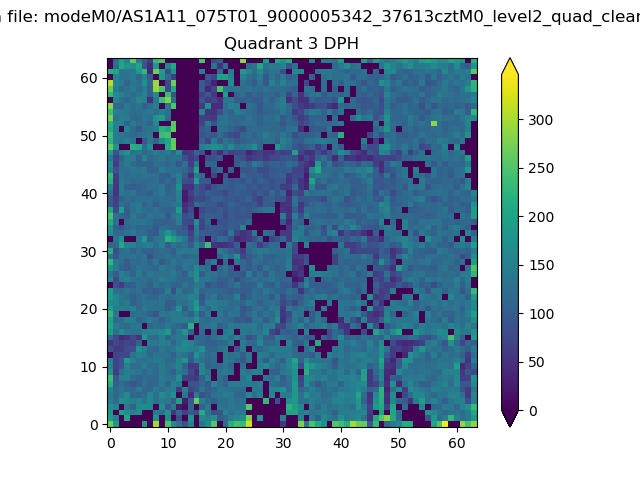 |
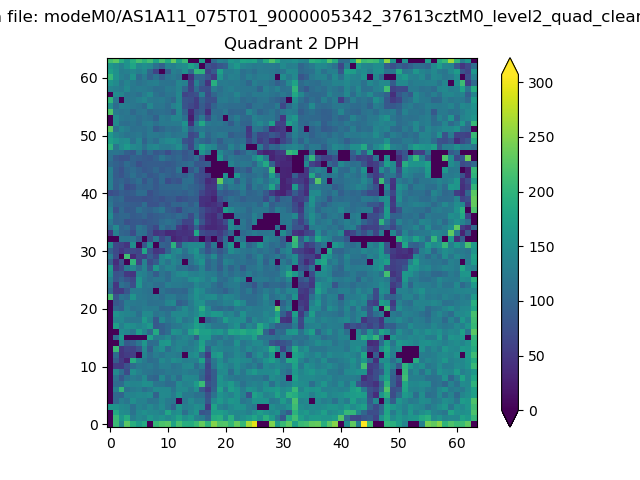 |
Quadrant C |
| Plot type | Count rate plots | Images |
|---|---|---|
| Comparison with Poisson distribution Blue bars denote a histogram of data divided into 1 sec bins. Red curve is a Poisson curve with rate = median count rate of data. |
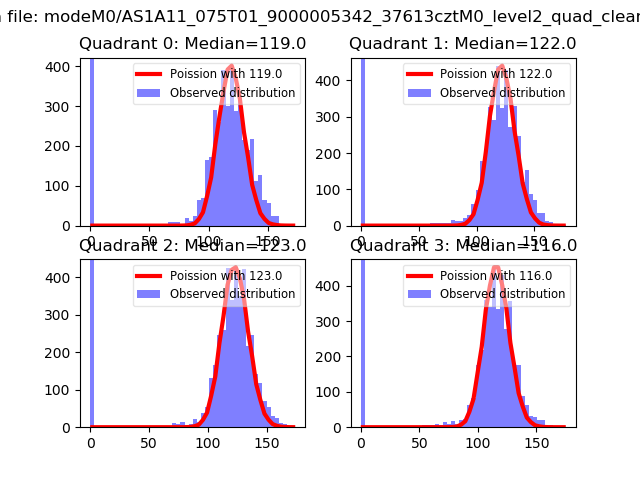 |
 |
| Quadrant-wise count rates Data is divided into 100 sec bins |
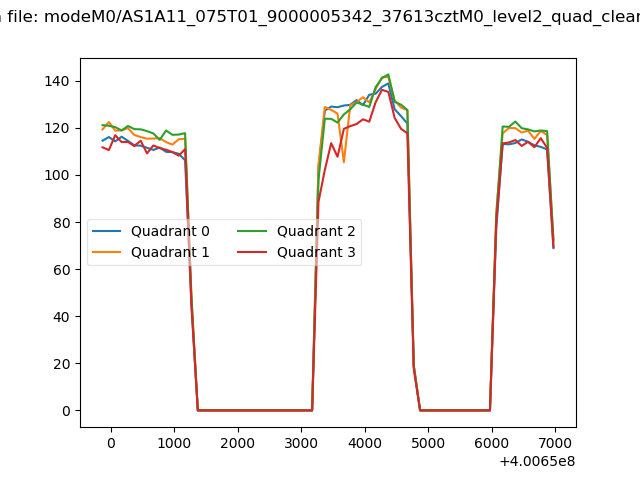 |
|
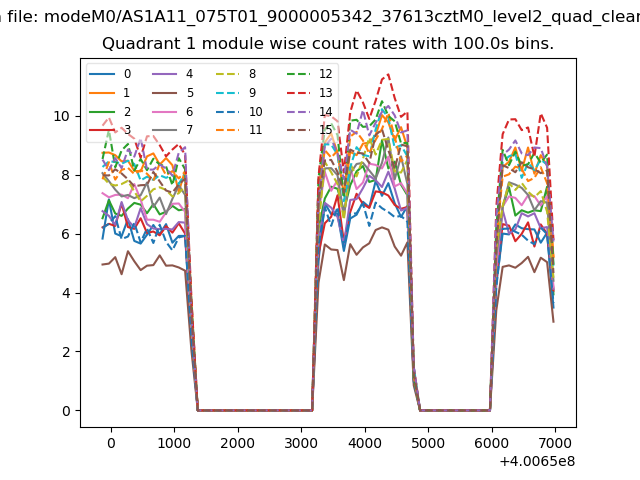
| Module-wise count rates for Quadrant A Data is divided into 100 sec bins |
 |
 |
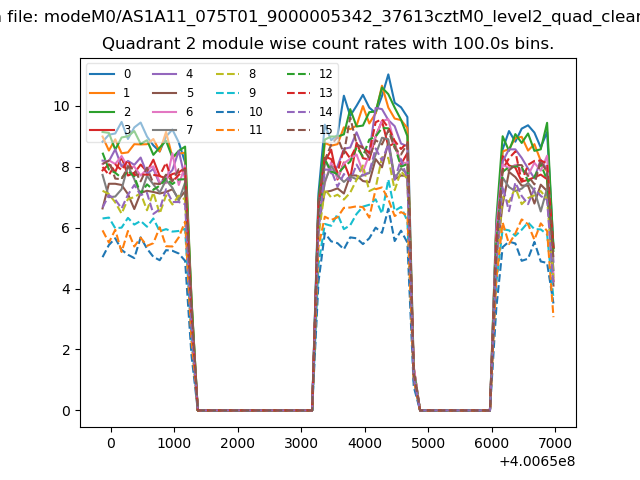
| Module-wise count rates for Quadrant B Data is divided into 100 sec bins |
 |
 |
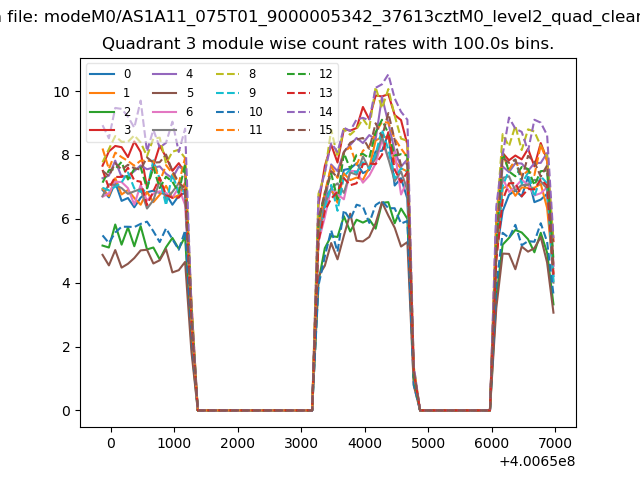
| Module-wise count rates for Quadrant C Data is divided into 100 sec bins |
 |
 |
| Module-wise count rates for Quadrant D Data is divided into 100 sec bins |
 |
 |
| Parameter | Plot |
|---|---|
| CZT HV Monitor | 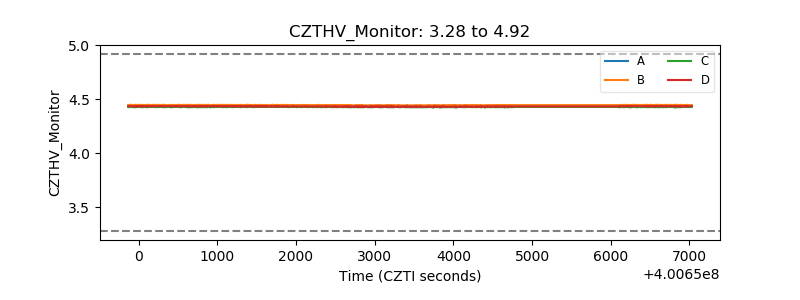 |
| D_VDD | 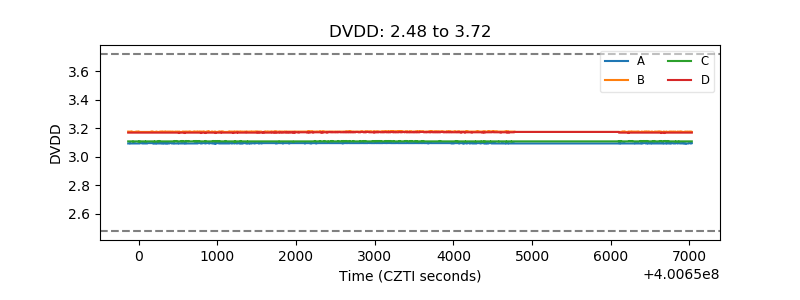 |
| Temperature 1 | 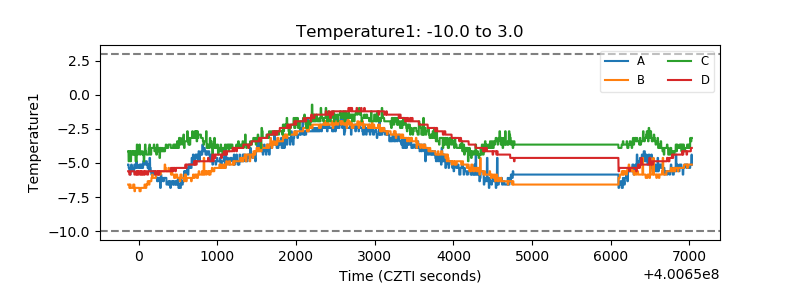 |
| Veto HV Monitor |  |
| Veto LLD | 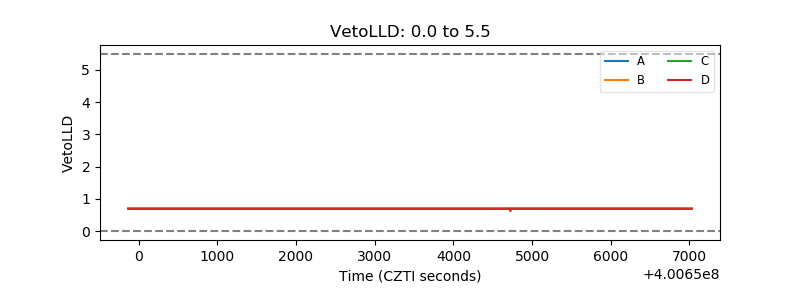 |
| Alpha Counter | 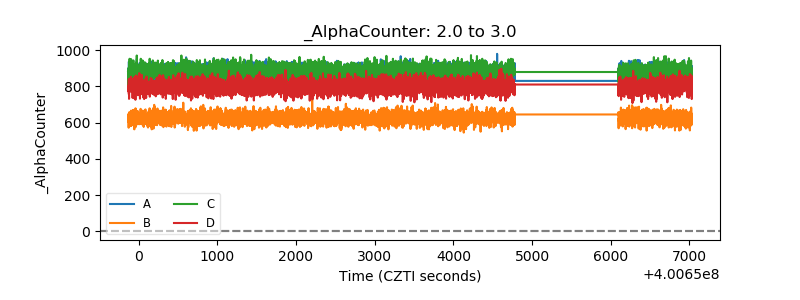 |
| _CPM_Rate | 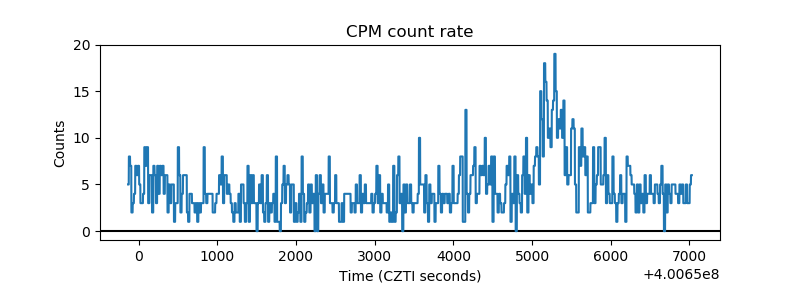 |
| CZT Counter | 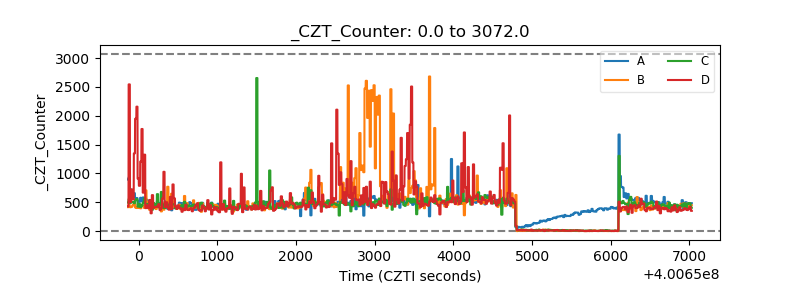 |
| +2.5 Volts monitor | 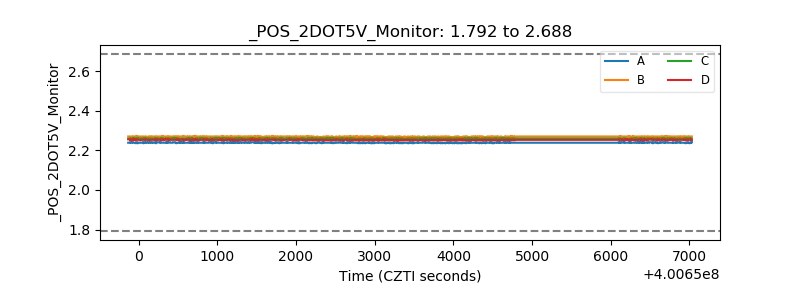 |
| +5 Volts monitor | 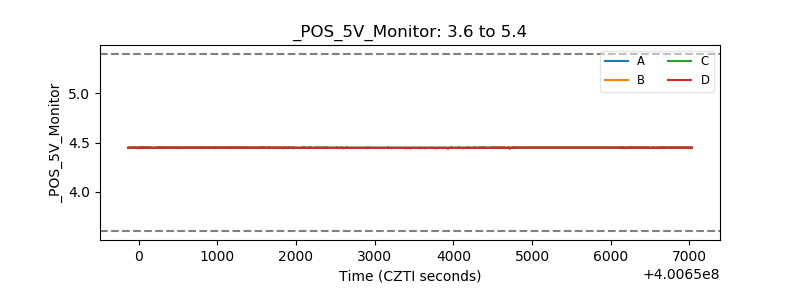 |
| _ROLL_ROT | 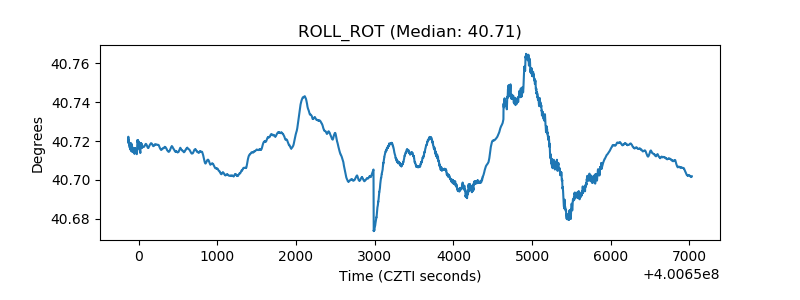 |
| _Roll_DEC | 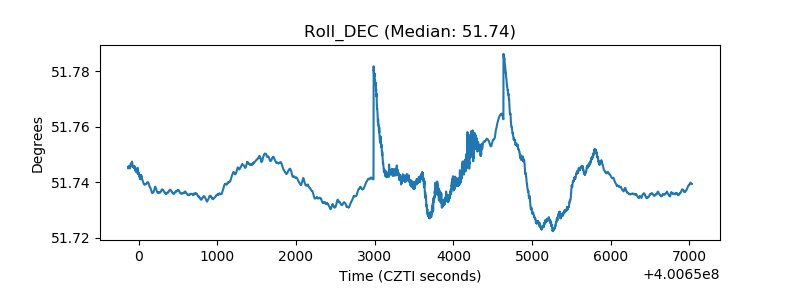 |
| _Roll_RA | 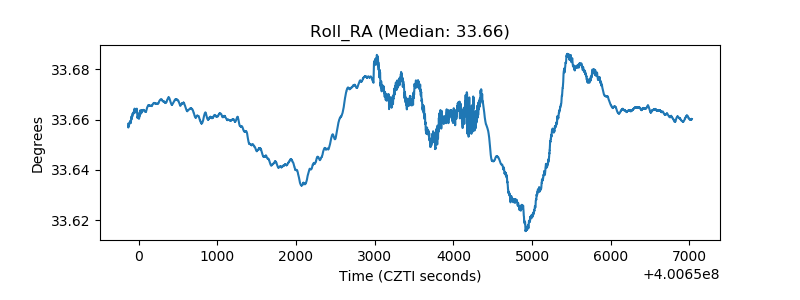 |
| Veto Counter | 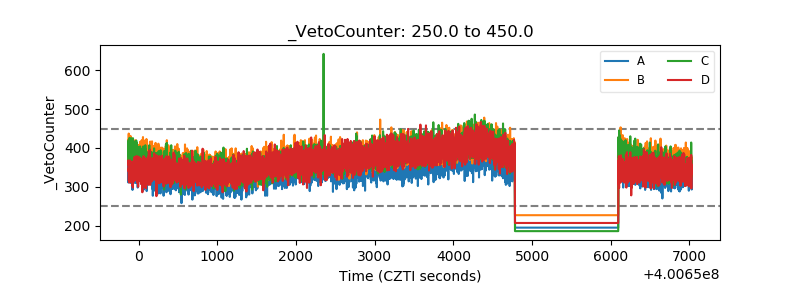 |