| Param | Original file | Final file |
|---|---|---|
| Filename | modeM0/AS1A11_075T01_9000005342_37616cztM0_level2.evt | modeM0/AS1A11_075T01_9000005342_37616cztM0_level2_quad_clean.evt |
| Size (bytes) | 1,130,803,200 | 171,728,640 |
| Size | 1.1 GB | 163.8 MB |
| Events in quadrant A | 8,519,614 | 1,039,396 |
| Events in quadrant B | 8,144,607 | 1,061,719 |
| Events in quadrant C | 7,666,425 | 1,053,332 |
| Events in quadrant D | 8,880,854 | 989,509 |
| Mode SS | |||
|---|---|---|---|
| Quadrant | BADHDUFLAG | Total packets | Discarded packets |
| A | 0 | 314 | 0 |
| B | 0 | 314 | 0 |
| C | 0 | 314 | 0 |
| D | 0 | 314 | 0 |
| Mode M0 | |||
|---|---|---|---|
| Quadrant | BADHDUFLAG | Total packets | Discarded packets |
| A | 0 | 34384 | 4 |
| B | 0 | 33879 | 3 |
| C | 0 | 31707 | 3 |
| D | 0 | 36823 | 3 |
| Mode M9 | |||
|---|---|---|---|
| Quadrant | BADHDUFLAG | Total packets | Discarded packets |
| A | 0 | 42 | 0 |
| B | 0 | 42 | 0 |
| C | 0 | 42 | 0 |
| D | 0 | 42 | 0 |
| Quadrant | Total seconds | Saturated seconds | Saturation percentage |
|---|---|---|---|
| A | 15311 | 223 | 1.456469% |
| B | 15311 | 168 | 1.097250% |
| C | 15311 | 37 | 0.241656% |
| D | 15311 | 306 | 1.998563% |
Noise dominated data is calculated using 1-second bins in cleaned event files. If a bin has >2000 counts, and if more than 50% of those come from <1% of pixels, then it is considered to be noise-dominated and hence unusable.
| Quadrant | # 1 sec bins | Bins with >0 counts | Bins with >2000 counts | High rate bins dominated by noise | Noise dominated (total time) | Noise dominated (detector-on time) | Marked lightcurve |
|---|---|---|---|---|---|---|---|
| A | 19579 | 15315 | 199 | 199 | 1.02% | 1.30% | 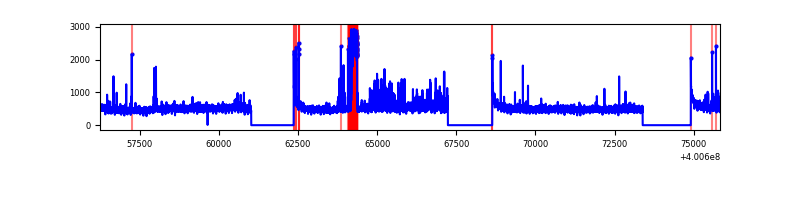 |
| B | 19579 | 15312 | 107 | 107 | 0.55% | 0.70% | 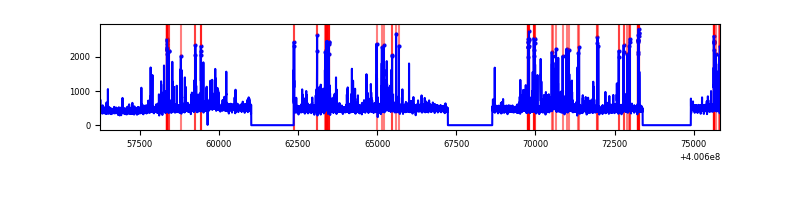 |
| C | 19579 | 15313 | 31 | 31 | 0.16% | 0.20% | 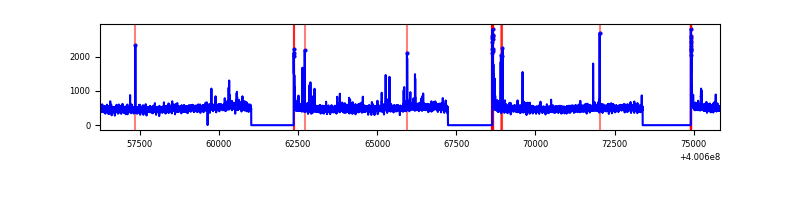 |
| D | 19579 | 15315 | 272 | 272 | 1.39% | 1.78% |  |
Top three noisy pixels from each quadrant. If the there are fewer than three noisy pixels in the level2.evt file, extra rows are filled as -1
| Pixel properties | Quadrant properties | ||||||
|---|---|---|---|---|---|---|---|
| Quadrant | DetID | PixID | Counts | Sigma | Mean | Median | Sigma |
| A | 10 | 83 | 745672 | 2128.51 | 1741 | 1705 | 349.5 |
| A | 13 | 248 | 499258 | 1423.51 | 1741 | 1705 | 349.5 |
| A | 6 | 10 | 336918 | 959.05 | 1741 | 1705 | 349.5 |
| B | 5 | 172 | 379224 | 1125.85 | 1746 | 1699 | 335.3 |
| B | 5 | 200 | 268762 | 796.43 | 1746 | 1699 | 335.3 |
| B | 0 | 189 | 174673 | 515.84 | 1746 | 1699 | 335.3 |
| C | 15 | 214 | 701699 | 1763.79 | 1711 | 1723 | 396.9 |
| C | 0 | 10 | 118281 | 293.7 | 1711 | 1723 | 396.9 |
| C | 14 | 254 | 113315 | 281.19 | 1711 | 1723 | 396.9 |
| D | 2 | 250 | 655826 | 1592.64 | 1697 | 1649 | 410.8 |
| D | 2 | 249 | 443374 | 1075.41 | 1697 | 1649 | 410.8 |
| D | 13 | 249 | 372620 | 903.15 | 1697 | 1649 | 410.8 |
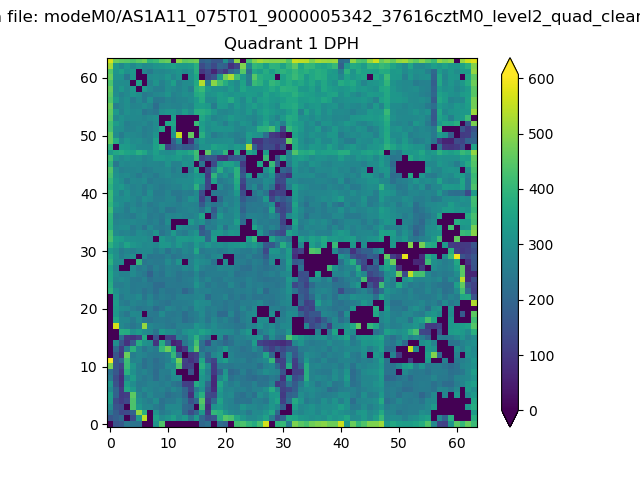
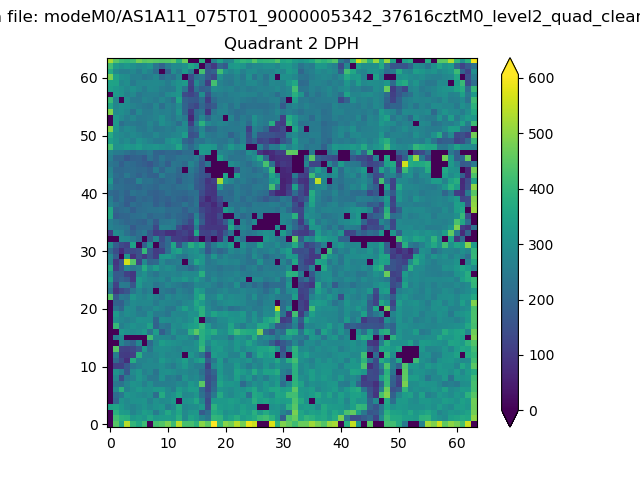
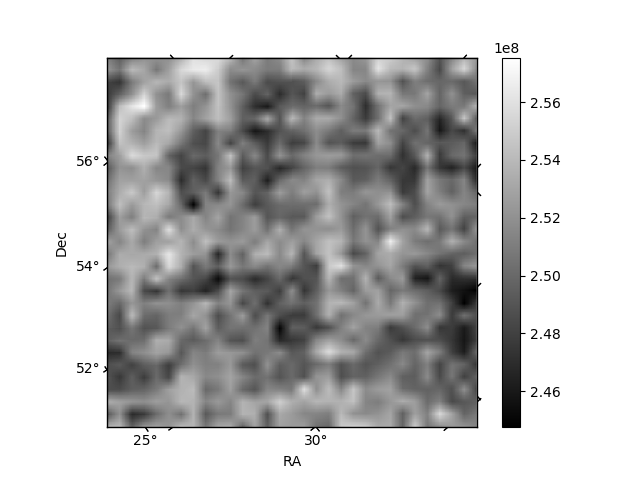
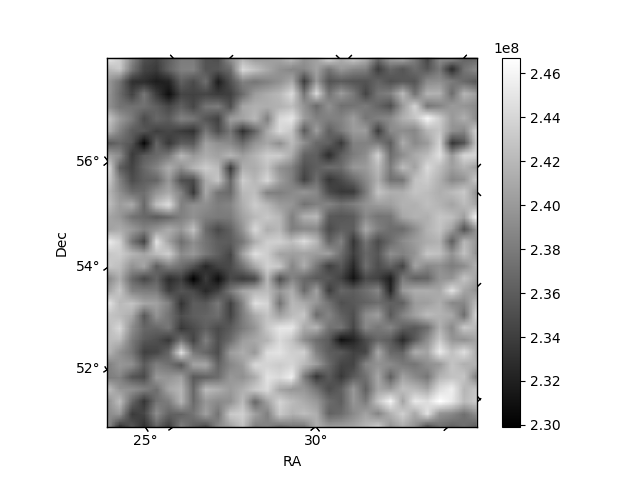
Histogram calculated using DETX and DETY for each event in the final _common_clean file
| Quadrant A |  |
 |
Quadrant B |
|---|---|---|---|
| Quadrant D | 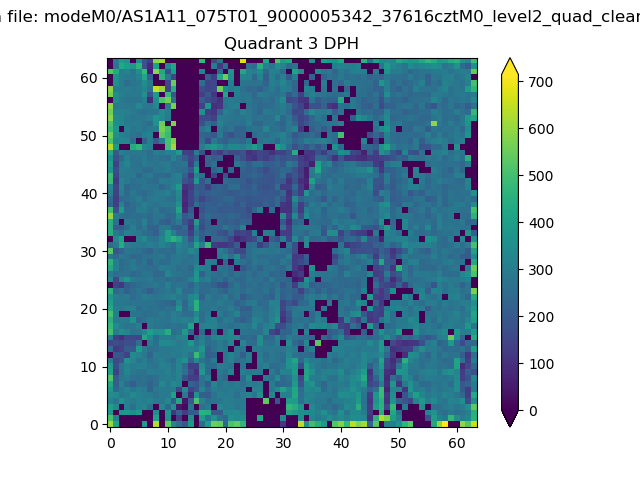 |
 |
Quadrant C |
| Plot type | Count rate plots | Images |
|---|---|---|
| Comparison with Poisson distribution Blue bars denote a histogram of data divided into 1 sec bins. Red curve is a Poisson curve with rate = median count rate of data. |
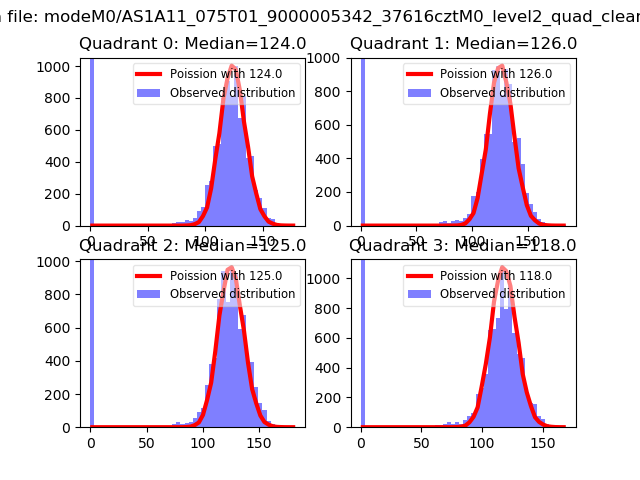 |
 |
| Quadrant-wise count rates Data is divided into 100 sec bins |
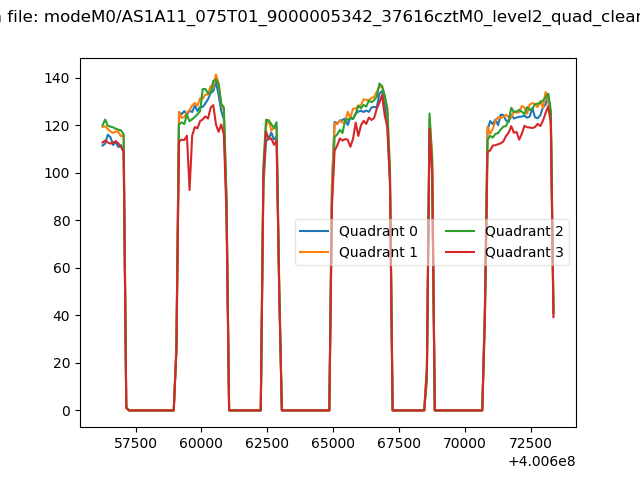 |
|
| Module-wise count rates for Quadrant A Data is divided into 100 sec bins |
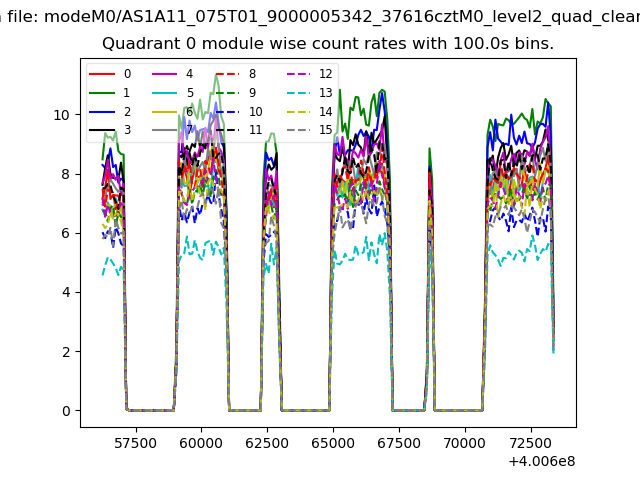 |
 |
| Module-wise count rates for Quadrant B Data is divided into 100 sec bins |
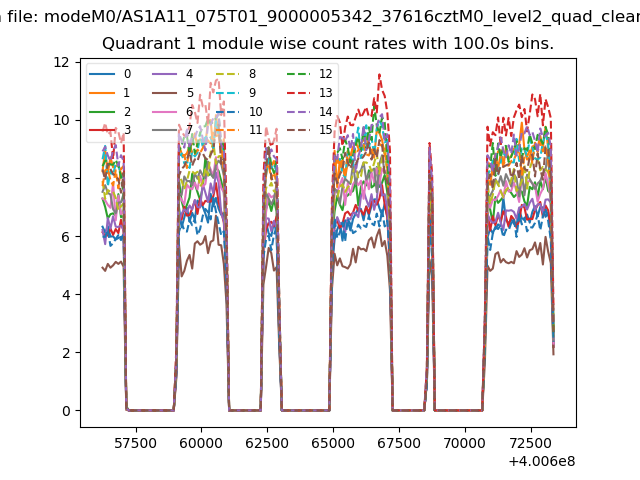 |
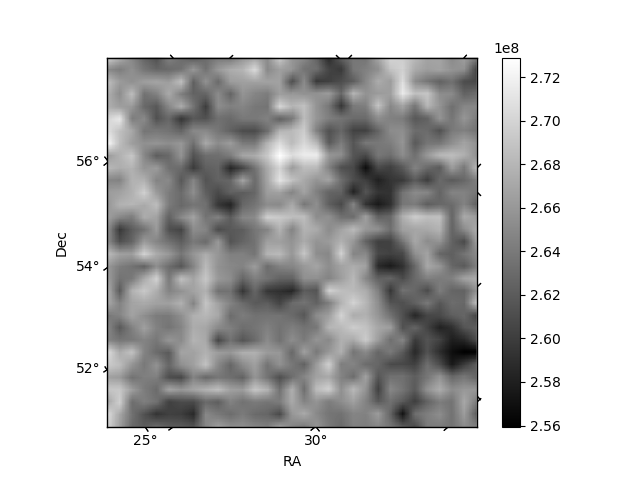 |
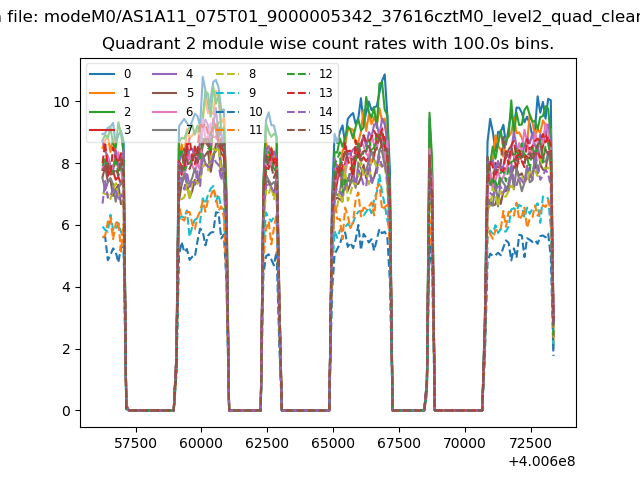
| Module-wise count rates for Quadrant C Data is divided into 100 sec bins |
 |
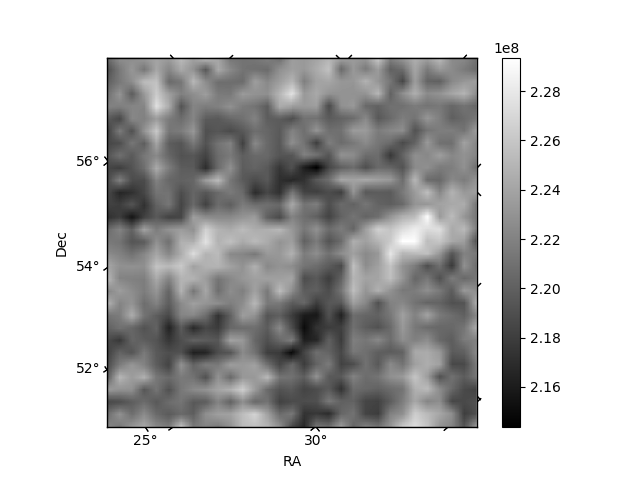 |
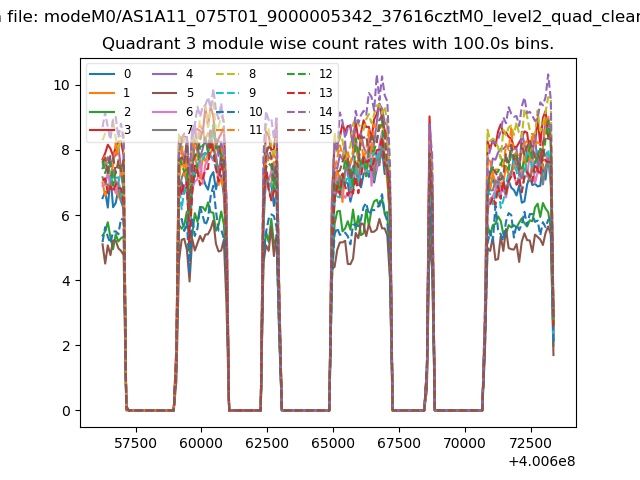
| Module-wise count rates for Quadrant D Data is divided into 100 sec bins |
 |
 |
| Parameter | Plot |
|---|---|
| CZT HV Monitor |  |
| D_VDD | 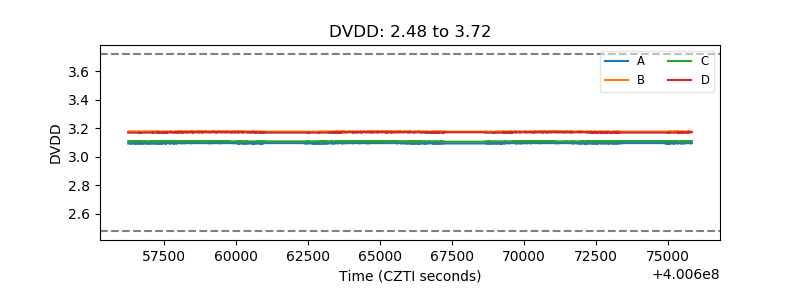 |
| Temperature 1 | 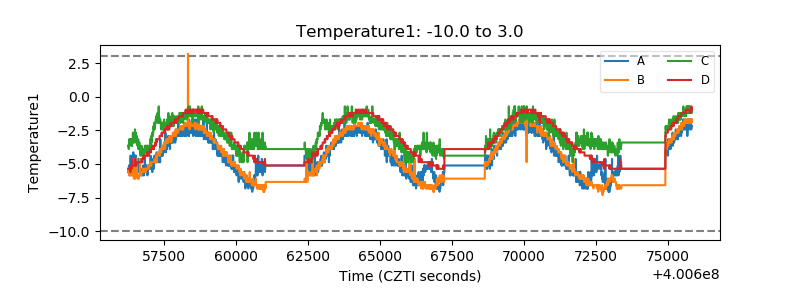 |
| Veto HV Monitor | 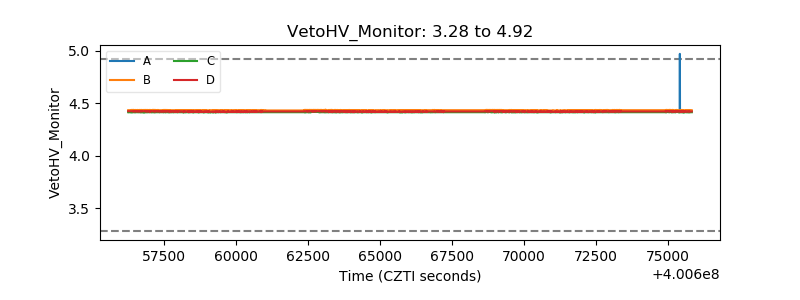 |
| Veto LLD | 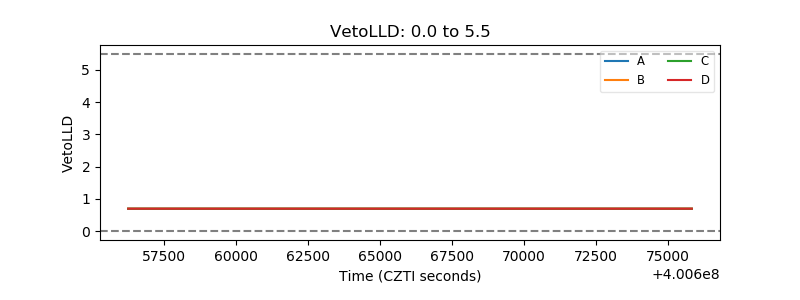 |
| Alpha Counter | 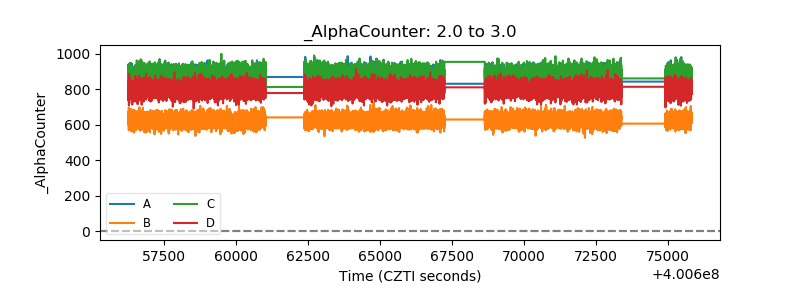 |
| _CPM_Rate | 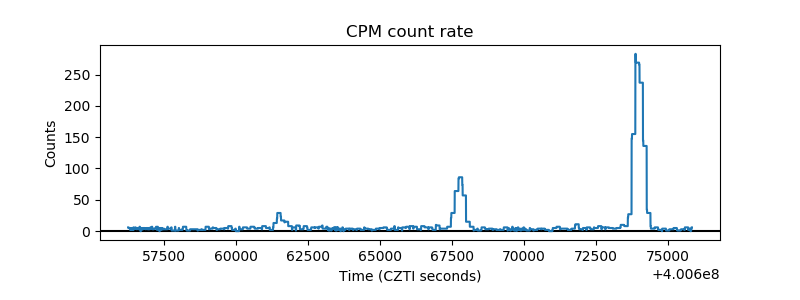 |
| CZT Counter | 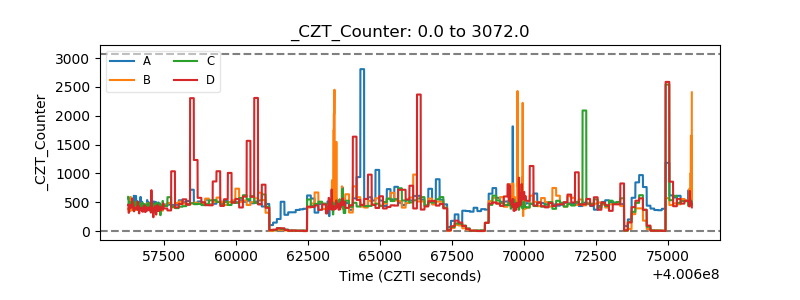 |
| +2.5 Volts monitor | 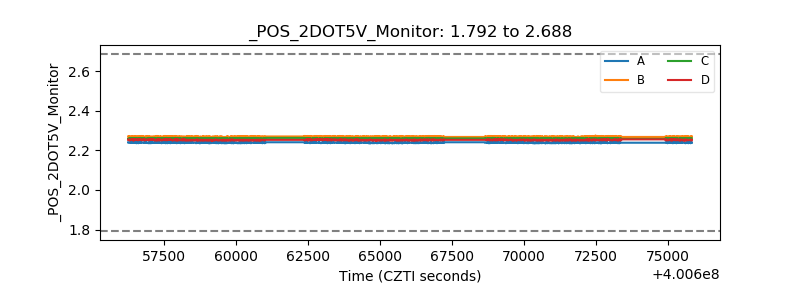 |
| +5 Volts monitor | 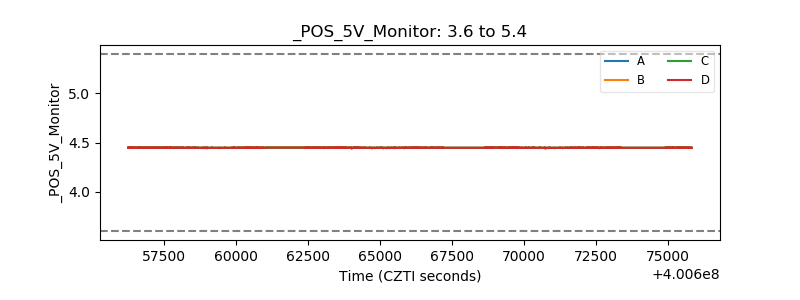 |
| _ROLL_ROT | 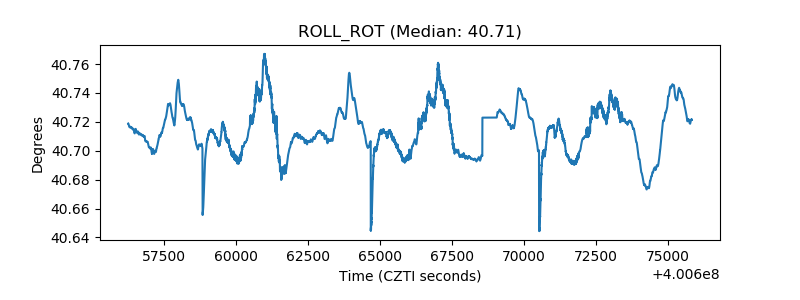 |
| _Roll_DEC | 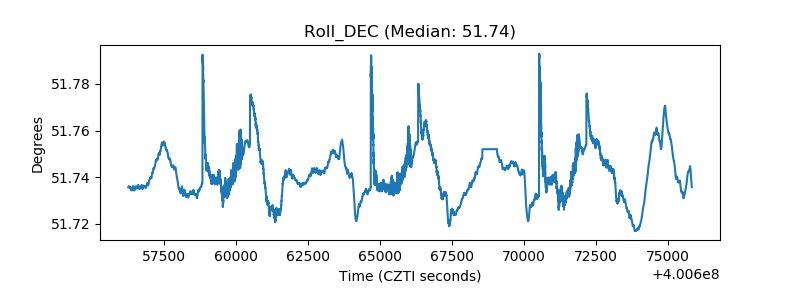 |
| _Roll_RA | 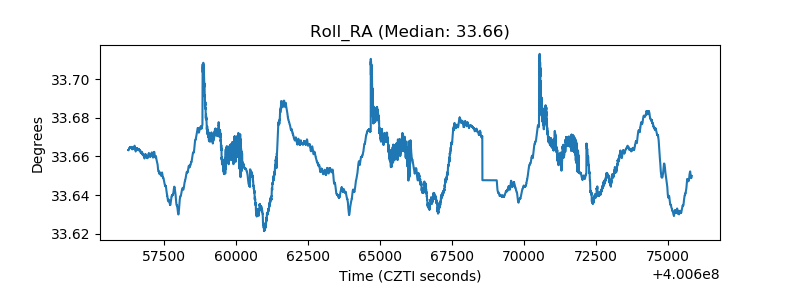 |
| Veto Counter | 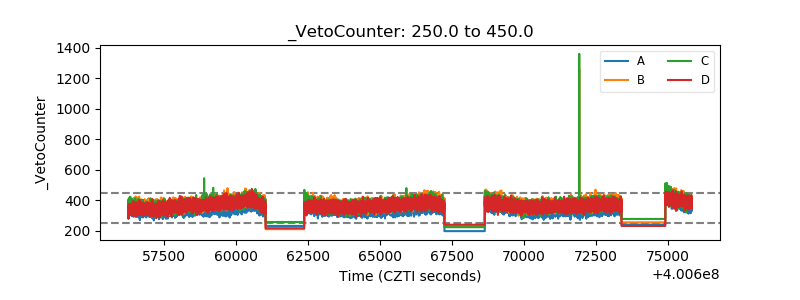 |