| Param | Original file | Final file |
|---|---|---|
| Filename | modeM0/AS1A11_075T01_9000005342_37617cztM0_level2.evt | modeM0/AS1A11_075T01_9000005342_37617cztM0_level2_quad_clean.evt |
| Size (bytes) | 505,595,520 | 57,876,480 |
| Size | 482.2 MB | 55.2 MB |
| Events in quadrant A | 4,019,297 | 347,907 |
| Events in quadrant B | 3,152,329 | 358,375 |
| Events in quadrant C | 2,888,304 | 355,117 |
| Events in quadrant D | 4,876,742 | 303,383 |
| Mode SS | |||
|---|---|---|---|
| Quadrant | BADHDUFLAG | Total packets | Discarded packets |
| A | 0 | 114 | 0 |
| B | 0 | 114 | 0 |
| C | 0 | 114 | 0 |
| D | 0 | 114 | 0 |
| Mode M0 | |||
|---|---|---|---|
| Quadrant | BADHDUFLAG | Total packets | Discarded packets |
| A | 0 | 15441 | 3 |
| B | 0 | 12866 | 2 |
| C | 0 | 11789 | 2 |
| D | 0 | 18196 | 2 |
| Mode M9 | |||
|---|---|---|---|
| Quadrant | BADHDUFLAG | Total packets | Discarded packets |
| A | 0 | 30 | 0 |
| B | 0 | 30 | 0 |
| C | 0 | 30 | 0 |
| D | 0 | 30 | 0 |
| Quadrant | Total seconds | Saturated seconds | Saturation percentage |
|---|---|---|---|
| A | 5527 | 224 | 4.052832% |
| B | 5527 | 137 | 2.478741% |
| C | 5527 | 52 | 0.940836% |
| D | 5527 | 689 | 12.466076% |
Noise dominated data is calculated using 1-second bins in cleaned event files. If a bin has >2000 counts, and if more than 50% of those come from <1% of pixels, then it is considered to be noise-dominated and hence unusable.
| Quadrant | # 1 sec bins | Bins with >0 counts | Bins with >2000 counts | High rate bins dominated by noise | Noise dominated (total time) | Noise dominated (detector-on time) | Marked lightcurve |
|---|---|---|---|---|---|---|---|
| A | 7169 | 5528 | 117 | 117 | 1.63% | 2.12% | 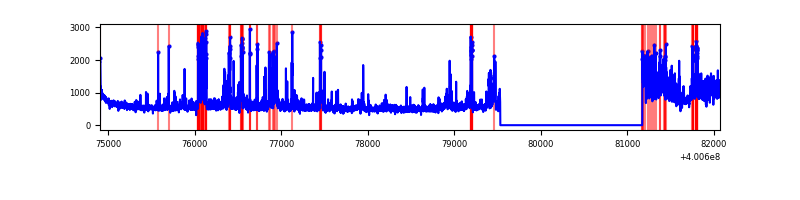 |
| B | 7168 | 5526 | 103 | 103 | 1.44% | 1.86% | 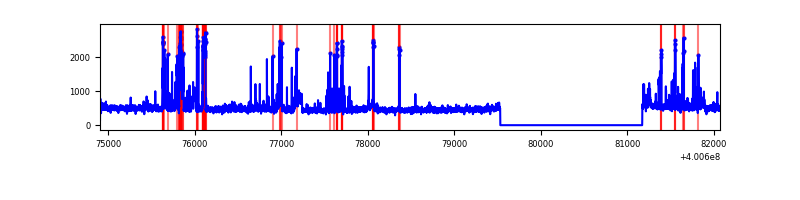 |
| C | 7169 | 5528 | 43 | 43 | 0.60% | 0.78% | 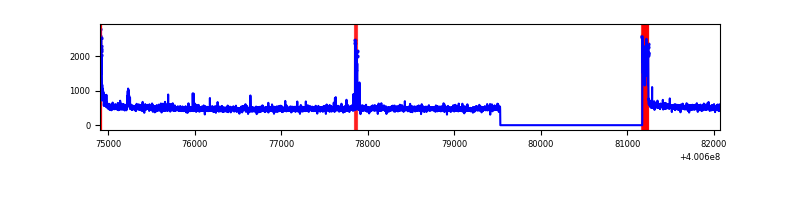 |
| D | 7169 | 5528 | 673 | 673 | 9.39% | 12.17% | 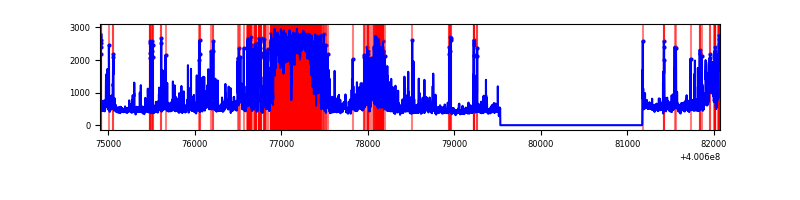 |
Top three noisy pixels from each quadrant. If the there are fewer than three noisy pixels in the level2.evt file, extra rows are filled as -1
| Pixel properties | Quadrant properties | ||||||
|---|---|---|---|---|---|---|---|
| Quadrant | DetID | PixID | Counts | Sigma | Mean | Median | Sigma |
| A | 15 | 222 | 821035 | 6378.98 | 633 | 621 | 128.6 |
| A | 10 | 83 | 326293 | 2532.2 | 633 | 621 | 128.6 |
| A | 6 | 10 | 305681 | 2371.94 | 633 | 621 | 128.6 |
| B | 5 | 172 | 321039 | 2619.91 | 636 | 618 | 122.3 |
| B | 5 | 200 | 137094 | 1115.89 | 636 | 618 | 122.3 |
| B | 0 | 230 | 66596 | 539.47 | 636 | 618 | 122.3 |
| C | 15 | 214 | 253912 | 1722.16 | 624 | 630 | 147.1 |
| C | 0 | 10 | 145974 | 988.25 | 624 | 630 | 147.1 |
| C | 14 | 254 | 44882 | 300.89 | 624 | 630 | 147.1 |
| D | 12 | 233 | 1041900 | 7054.97 | 596 | 578 | 147.6 |
| D | 2 | 250 | 876591 | 5935.0 | 596 | 578 | 147.6 |
| D | 13 | 249 | 229555 | 1551.32 | 596 | 578 | 147.6 |
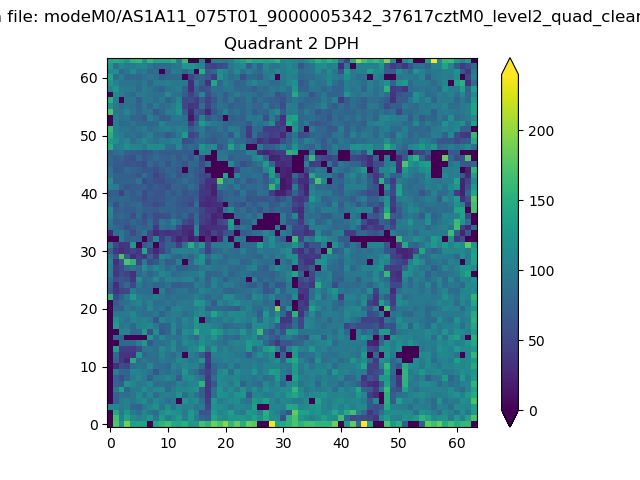
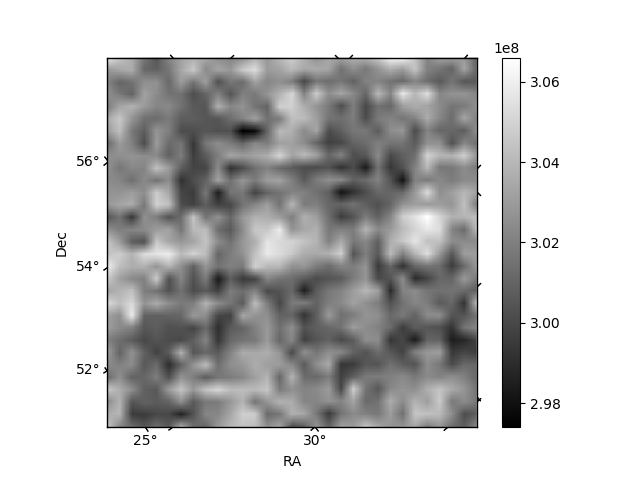
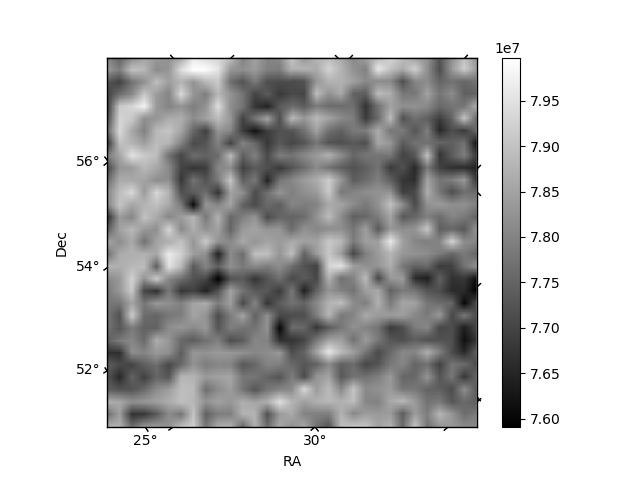
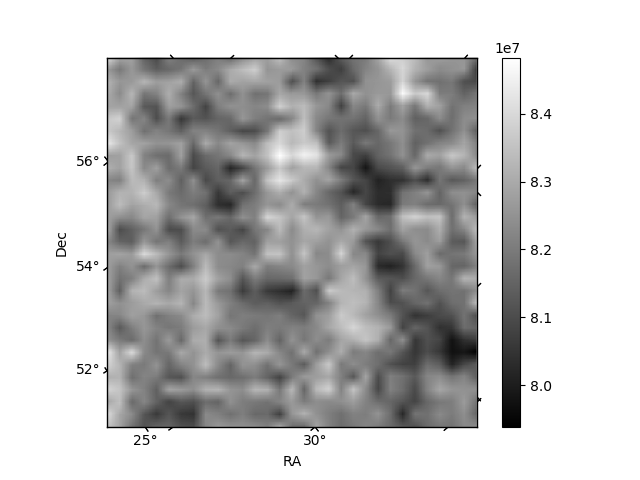
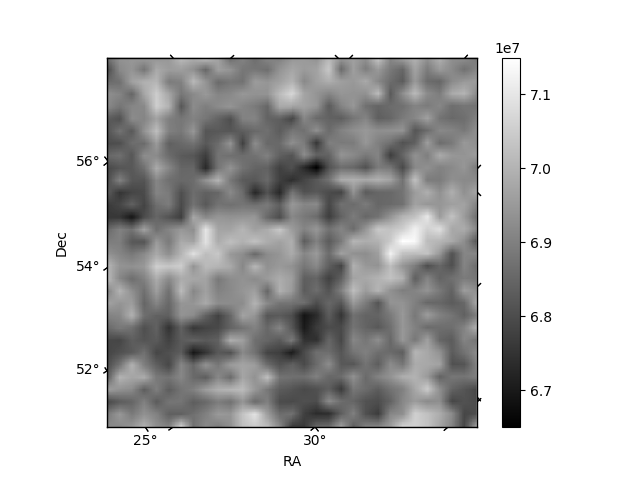
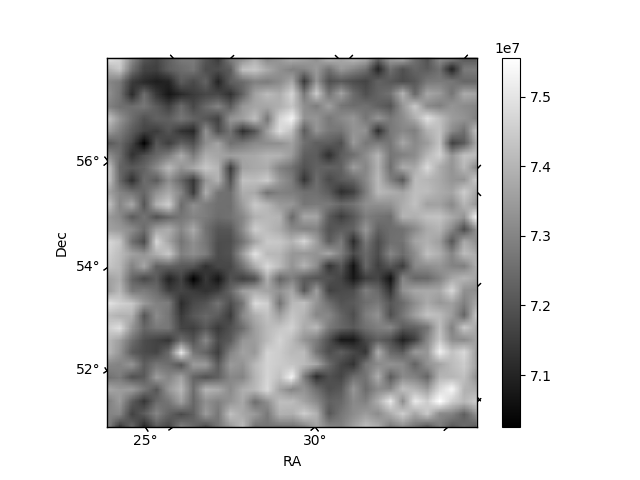
Histogram calculated using DETX and DETY for each event in the final _common_clean file
| Quadrant A | 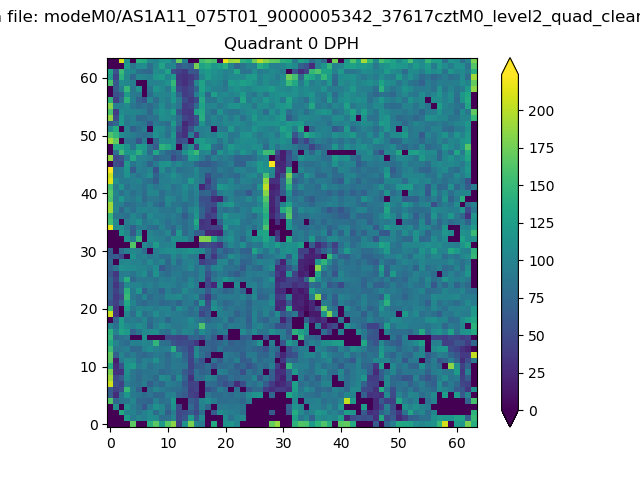 |
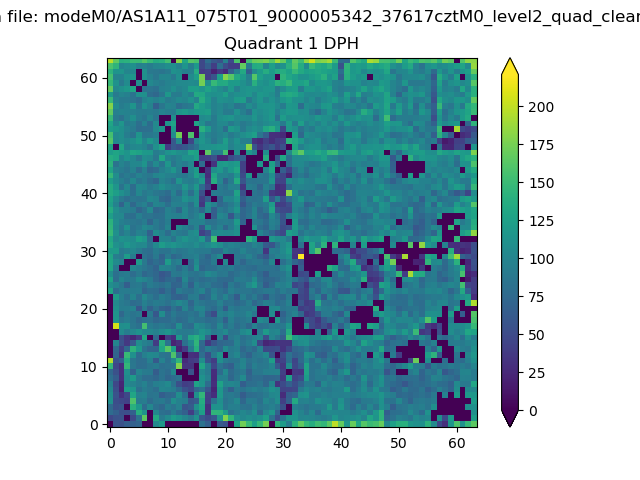 |
Quadrant B |
|---|---|---|---|
| Quadrant D | 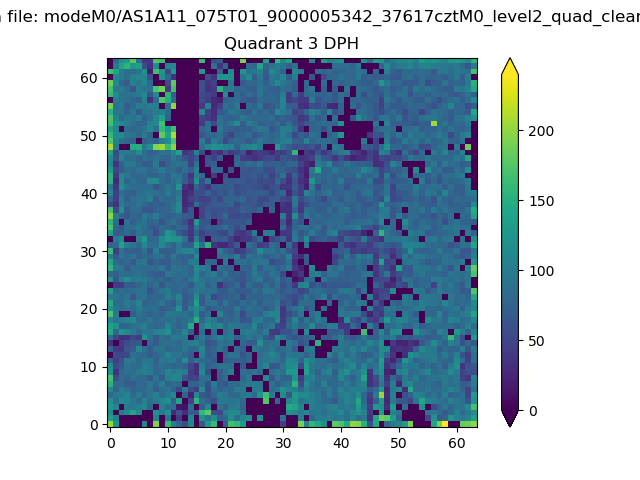 |
 |
Quadrant C |
| Plot type | Count rate plots | Images |
|---|---|---|
| Comparison with Poisson distribution Blue bars denote a histogram of data divided into 1 sec bins. Red curve is a Poisson curve with rate = median count rate of data. |
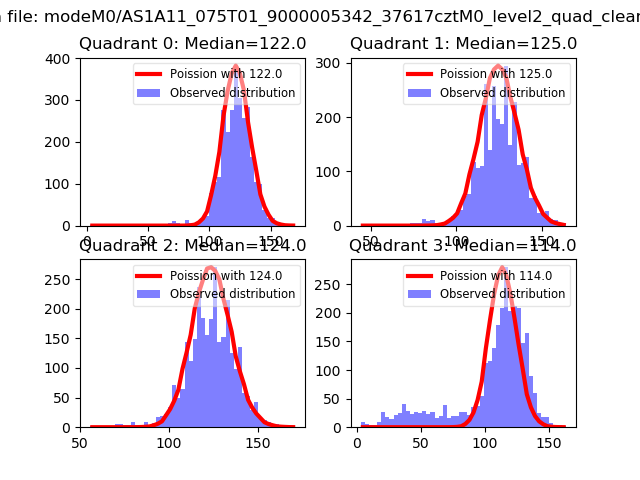 |
 |
| Quadrant-wise count rates Data is divided into 100 sec bins |
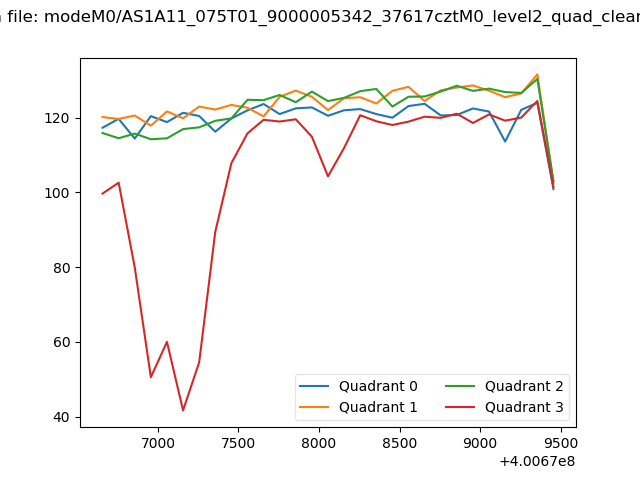 |
|
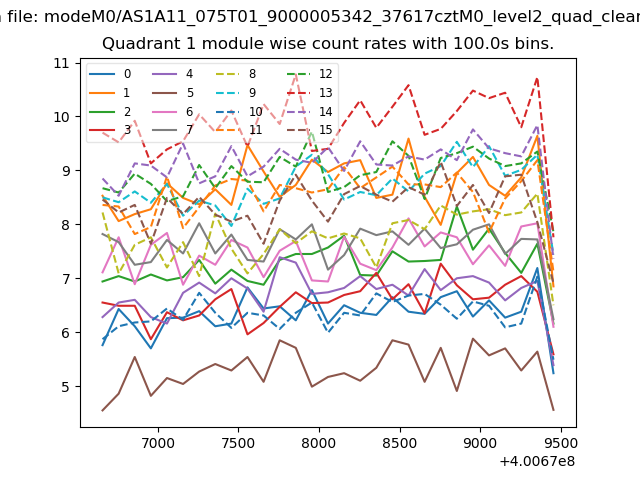
| Module-wise count rates for Quadrant A Data is divided into 100 sec bins |
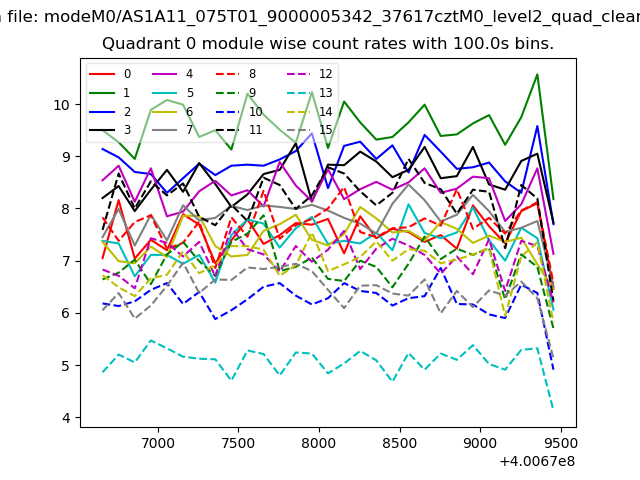 |
 |
| Module-wise count rates for Quadrant B Data is divided into 100 sec bins |
 |
 |
| Module-wise count rates for Quadrant C Data is divided into 100 sec bins |
 |
 |
| Module-wise count rates for Quadrant D Data is divided into 100 sec bins |
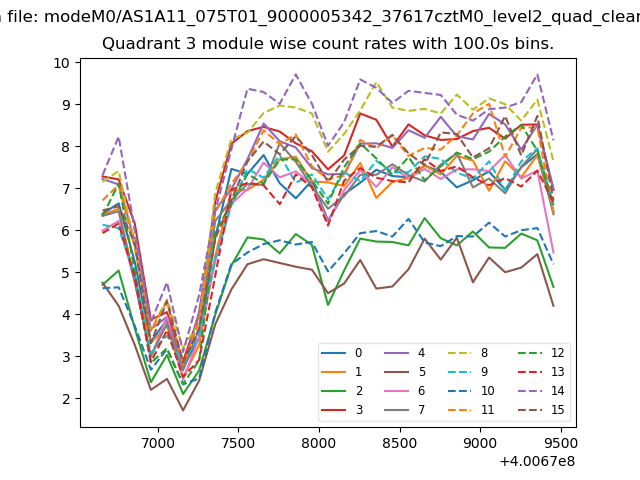 |
 |
| Parameter | Plot |
|---|---|
| CZT HV Monitor | 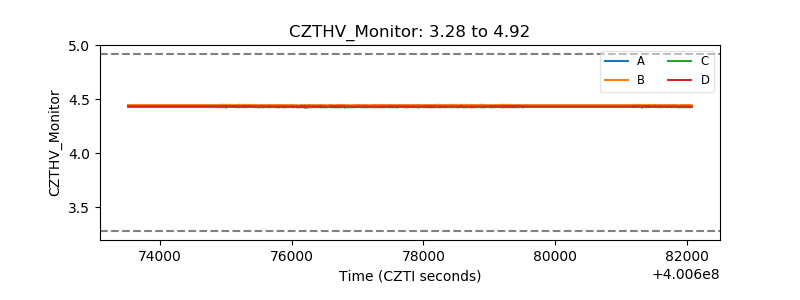 |
| D_VDD | 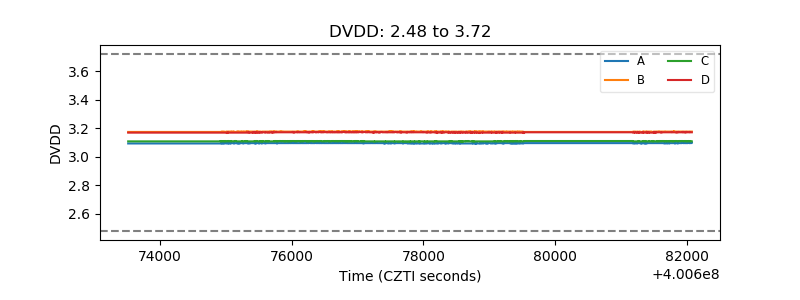 |
| Temperature 1 | 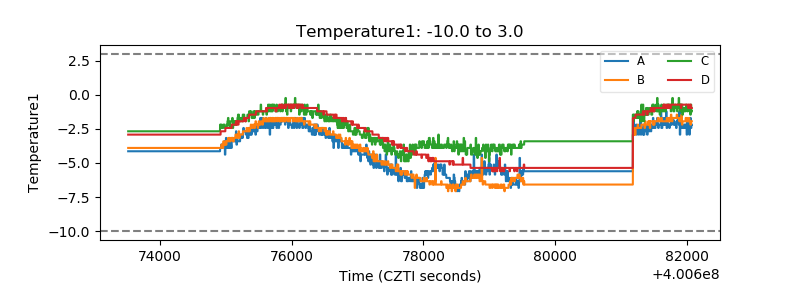 |
| Veto HV Monitor | 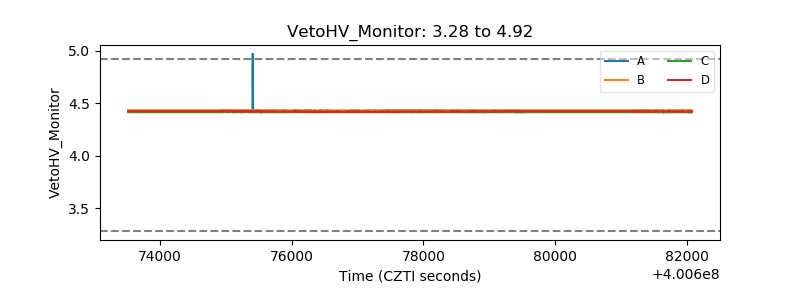 |
| Veto LLD | 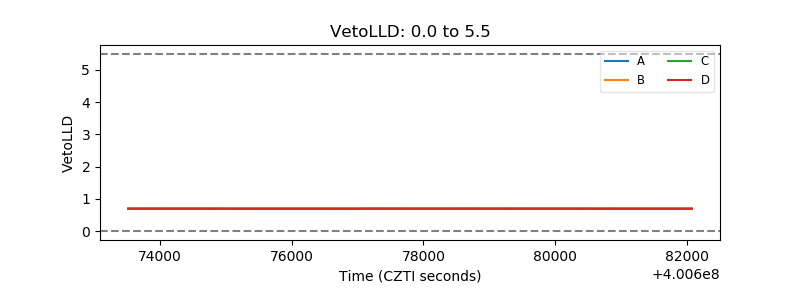 |
| Alpha Counter | 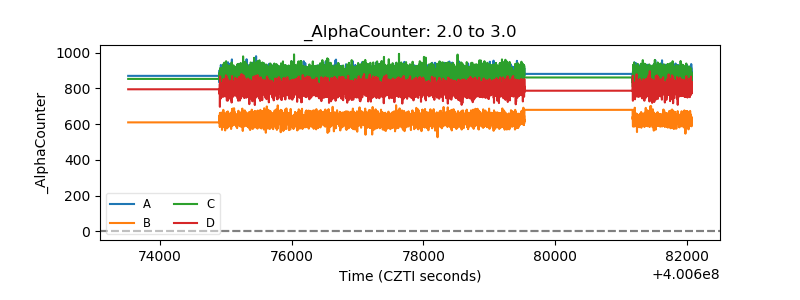 |
| _CPM_Rate | 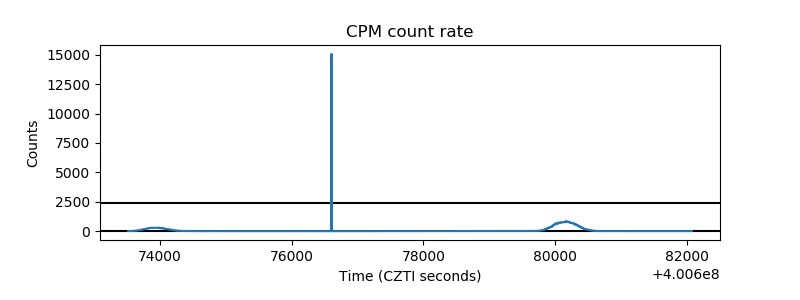 |
| CZT Counter | 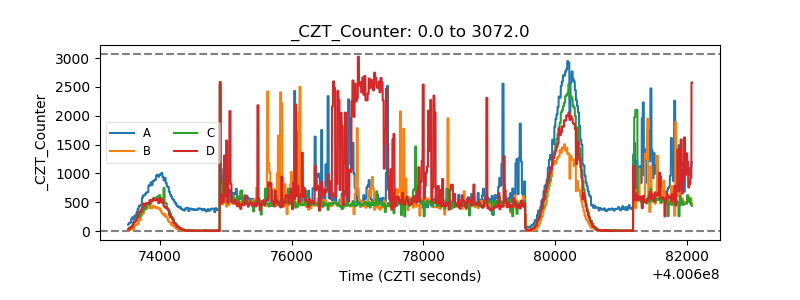 |
| +2.5 Volts monitor | 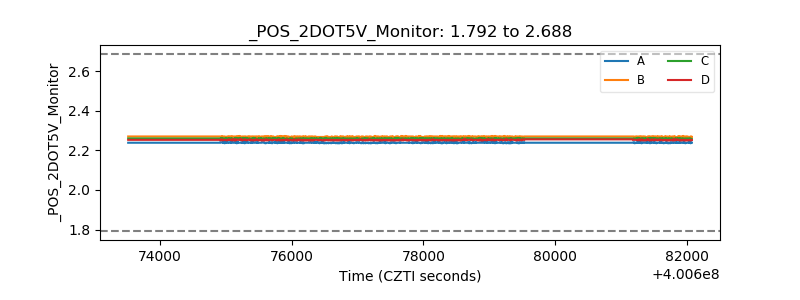 |
| +5 Volts monitor | 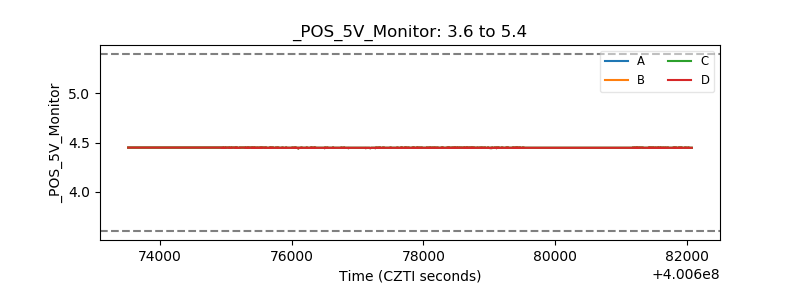 |
| _ROLL_ROT | 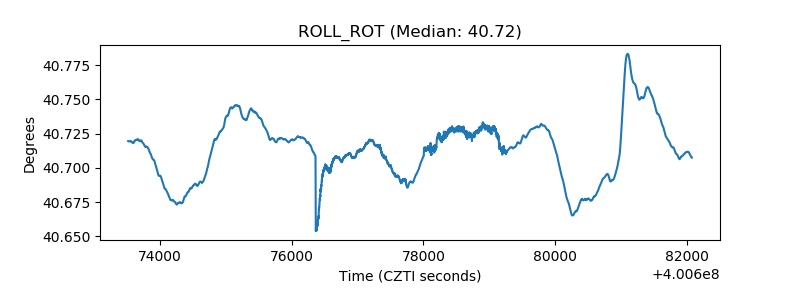 |
| _Roll_DEC | 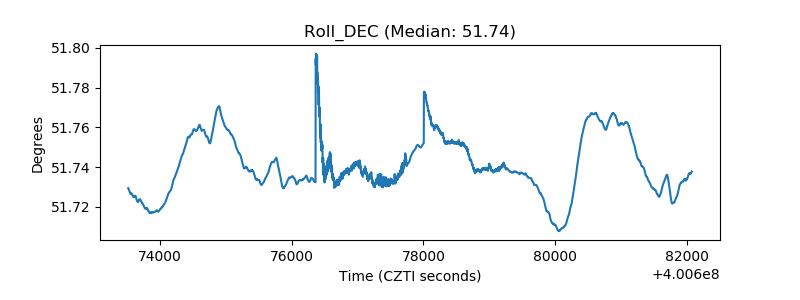 |
| _Roll_RA | 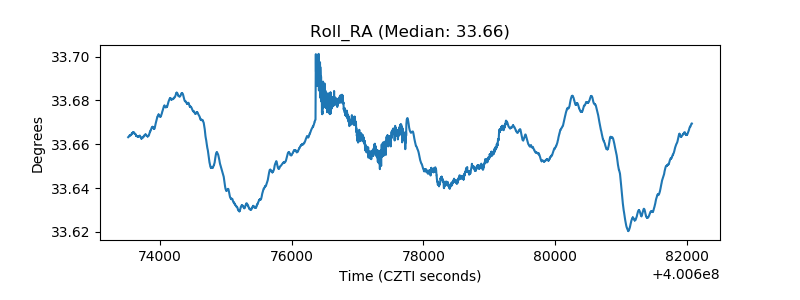 |
| Veto Counter | 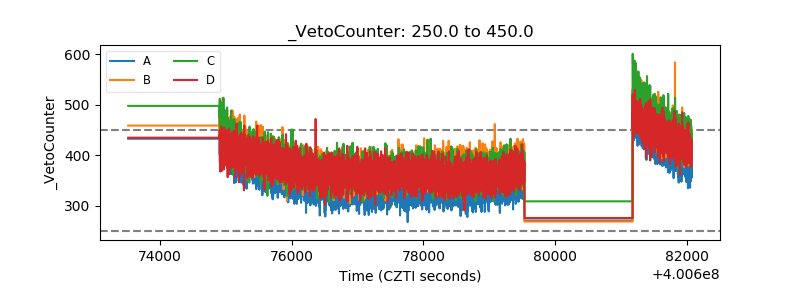 |