| Param | Original file | Final file |
|---|---|---|
| Filename | modeM0/AS1A11_075T01_9000005342_37619cztM0_level2.evt | modeM0/AS1A11_075T01_9000005342_37619cztM0_level2_quad_clean.evt |
| Size (bytes) | 613,140,480 | 60,563,520 |
| Size | 584.7 MB | 57.8 MB |
| Events in quadrant A | 8,541,871 | 276,631 |
| Events in quadrant B | 3,087,628 | 398,043 |
| Events in quadrant C | 2,894,739 | 399,966 |
| Events in quadrant D | 3,677,256 | 378,617 |
| Mode SS | |||
|---|---|---|---|
| Quadrant | BADHDUFLAG | Total packets | Discarded packets |
| A | 0 | 112 | 0 |
| B | 0 | 112 | 0 |
| C | 0 | 112 | 0 |
| D | 0 | 112 | 0 |
| Mode M0 | |||
|---|---|---|---|
| Quadrant | BADHDUFLAG | Total packets | Discarded packets |
| A | 0 | 29073 | 3 |
| B | 0 | 12669 | 2 |
| C | 0 | 11777 | 2 |
| D | 0 | 14641 | 2 |
| Mode M9 | |||
|---|---|---|---|
| Quadrant | BADHDUFLAG | Total packets | Discarded packets |
| A | 0 | 31 | 0 |
| B | 0 | 31 | 0 |
| C | 0 | 31 | 0 |
| D | 0 | 32 | 0 |
| Quadrant | Total seconds | Saturated seconds | Saturation percentage |
|---|---|---|---|
| A | 5419 | 2356 | 43.476656% |
| B | 5419 | 125 | 2.306699% |
| C | 5419 | 64 | 1.181030% |
| D | 5419 | 205 | 3.782986% |
Noise dominated data is calculated using 1-second bins in cleaned event files. If a bin has >2000 counts, and if more than 50% of those come from <1% of pixels, then it is considered to be noise-dominated and hence unusable.
| Quadrant | # 1 sec bins | Bins with >0 counts | Bins with >2000 counts | High rate bins dominated by noise | Noise dominated (total time) | Noise dominated (detector-on time) | Marked lightcurve |
|---|---|---|---|---|---|---|---|
| A | 7182 | 5420 | 2110 | 2110 | 29.38% | 38.93% |  |
| B | 7181 | 5418 | 71 | 71 | 0.99% | 1.31% | 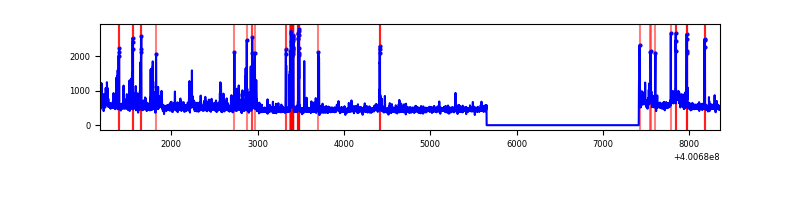 |
| C | 7182 | 5419 | 46 | 46 | 0.64% | 0.85% | 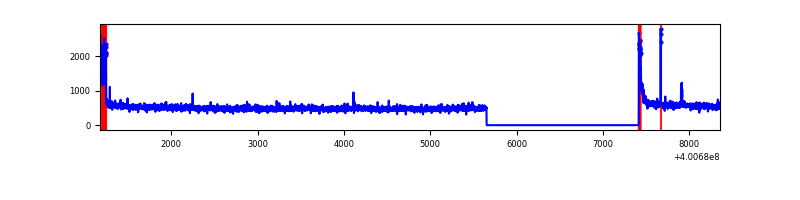 |
| D | 7182 | 5420 | 177 | 177 | 2.46% | 3.27% | 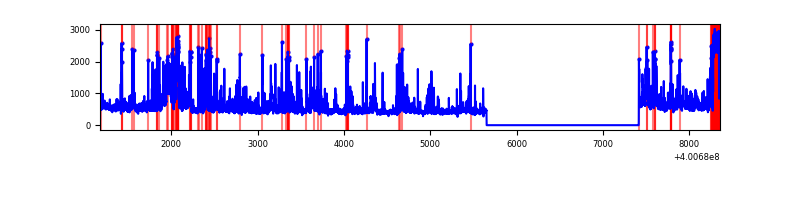 |
Top three noisy pixels from each quadrant. If the there are fewer than three noisy pixels in the level2.evt file, extra rows are filled as -1
| Pixel properties | Quadrant properties | ||||||
|---|---|---|---|---|---|---|---|
| Quadrant | DetID | PixID | Counts | Sigma | Mean | Median | Sigma |
| A | 15 | 222 | 6200433 | 59675.36 | 516 | 507 | 103.9 |
| A | 10 | 83 | 279919 | 2689.39 | 516 | 507 | 103.9 |
| A | 9 | 143 | 30248 | 286.26 | 516 | 507 | 103.9 |
| B | 5 | 172 | 220045 | 1797.21 | 638 | 622 | 122.1 |
| B | 5 | 200 | 83151 | 675.96 | 638 | 622 | 122.1 |
| B | 0 | 189 | 77496 | 629.65 | 638 | 622 | 122.1 |
| C | 15 | 214 | 247840 | 1680.92 | 631 | 635 | 147.1 |
| C | 0 | 10 | 157977 | 1069.88 | 631 | 635 | 147.1 |
| C | 14 | 254 | 16655 | 108.93 | 631 | 635 | 147.1 |
| D | 2 | 250 | 515342 | 3388.57 | 621 | 603 | 151.9 |
| D | 13 | 249 | 270708 | 1778.12 | 621 | 603 | 151.9 |
| D | 1 | 47 | 145164 | 951.66 | 621 | 603 | 151.9 |
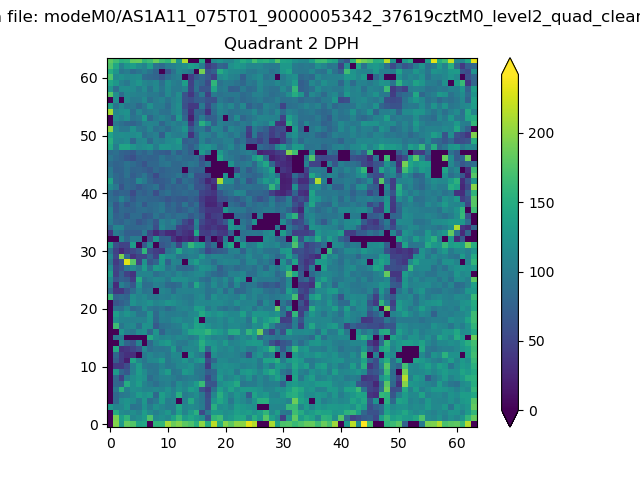
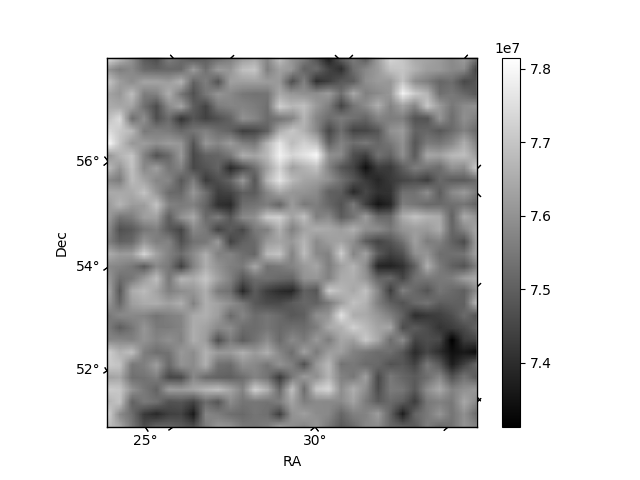
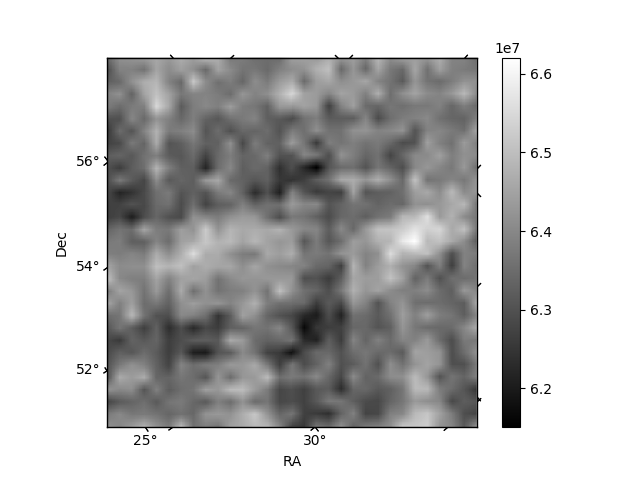
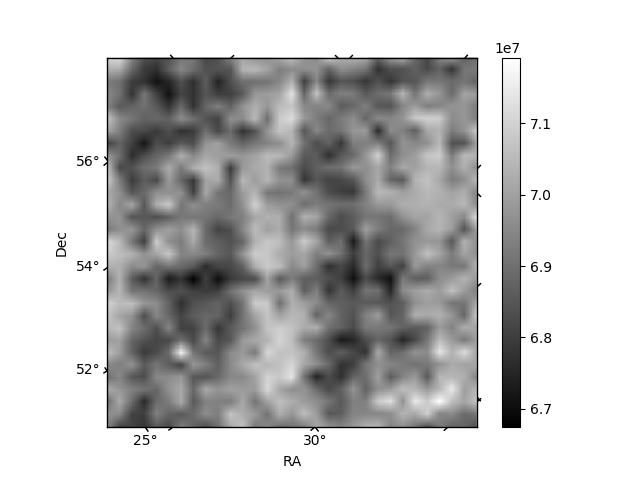
Histogram calculated using DETX and DETY for each event in the final _common_clean file
| Quadrant A | 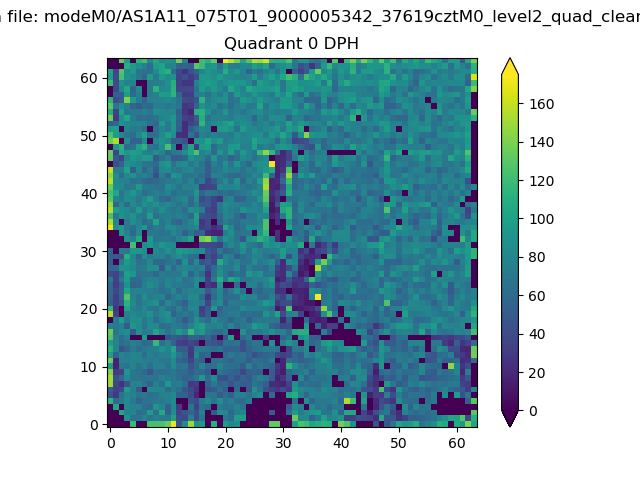 |
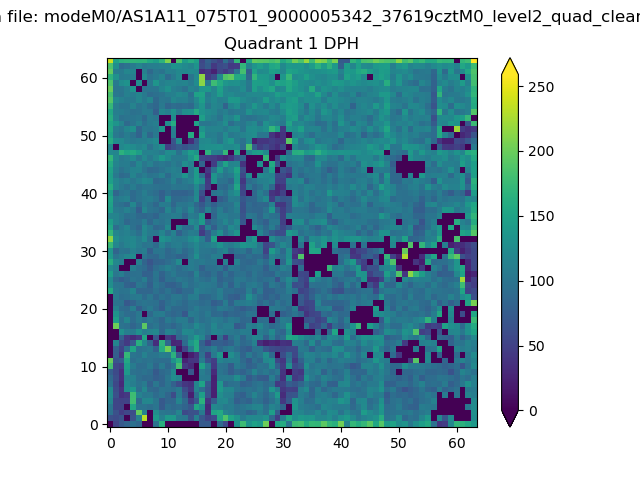 |
Quadrant B |
|---|---|---|---|
| Quadrant D | 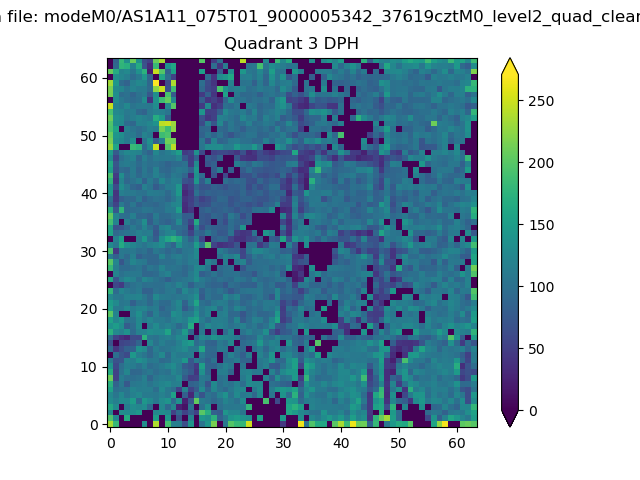 |
 |
Quadrant C |
| Plot type | Count rate plots | Images |
|---|---|---|
| Comparison with Poisson distribution Blue bars denote a histogram of data divided into 1 sec bins. Red curve is a Poisson curve with rate = median count rate of data. |
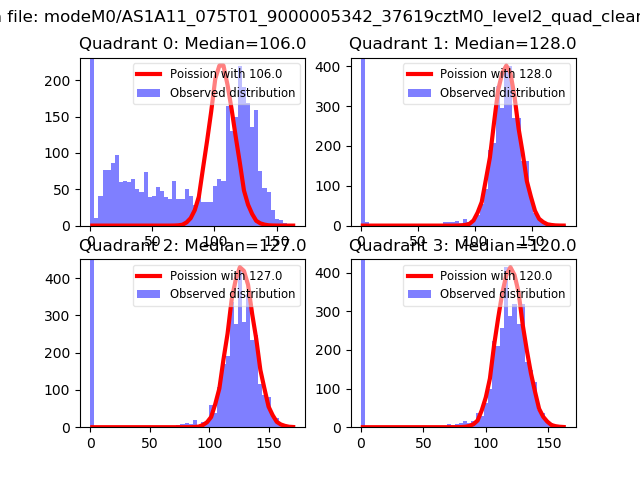 |
 |
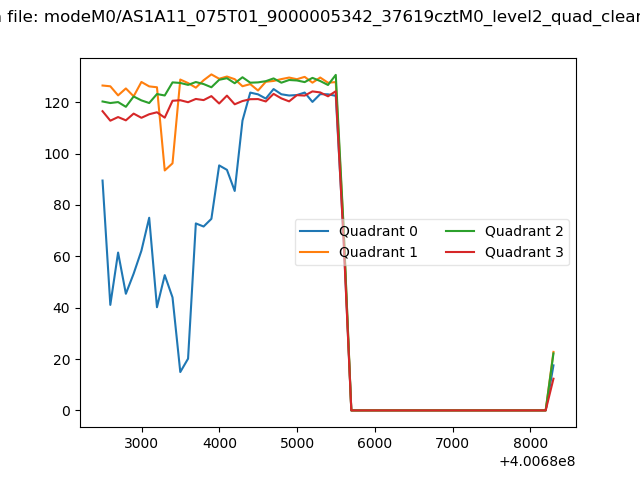
| Quadrant-wise count rates Data is divided into 100 sec bins |
 |
|
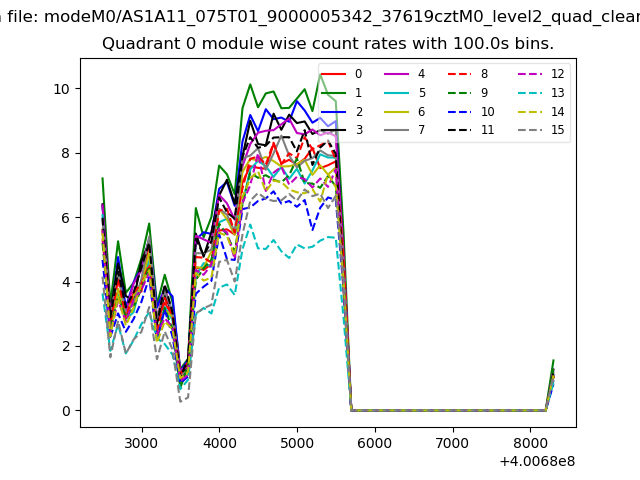
| Module-wise count rates for Quadrant A Data is divided into 100 sec bins |
 |
 |
| Module-wise count rates for Quadrant B Data is divided into 100 sec bins |
 |
 |
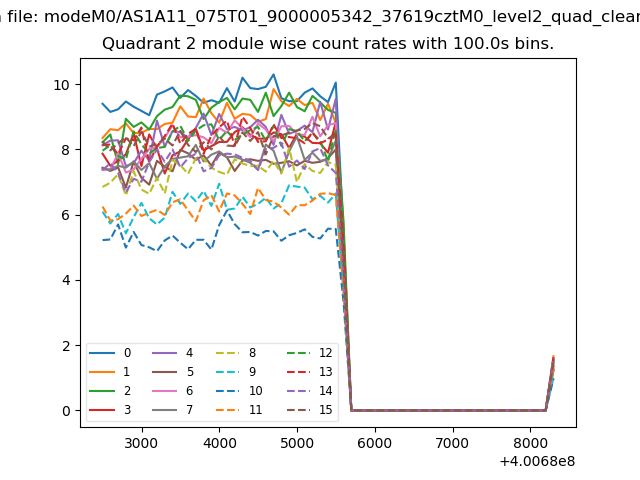
| Module-wise count rates for Quadrant C Data is divided into 100 sec bins |
 |
 |
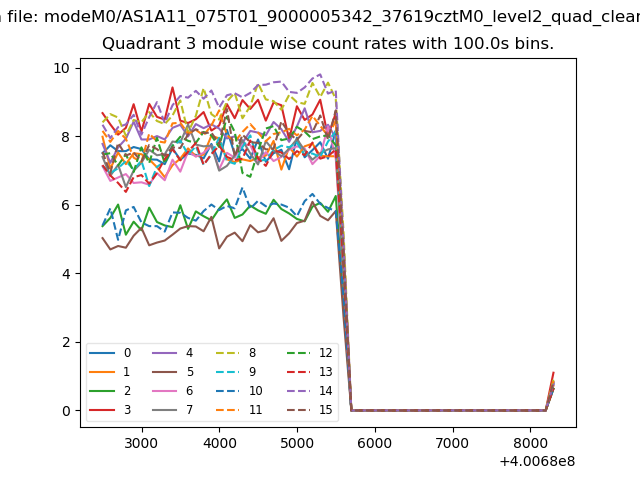
| Module-wise count rates for Quadrant D Data is divided into 100 sec bins |
 |
 |
| Parameter | Plot |
|---|---|
| CZT HV Monitor | 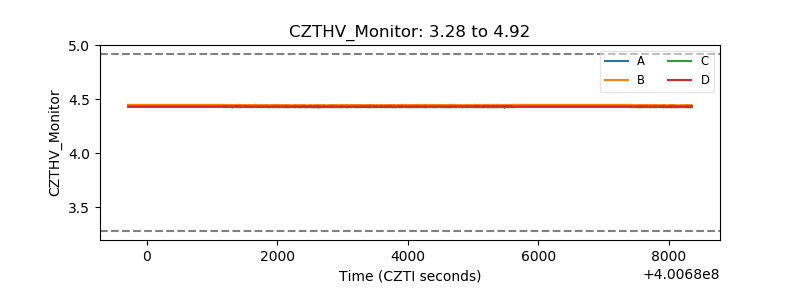 |
| D_VDD | 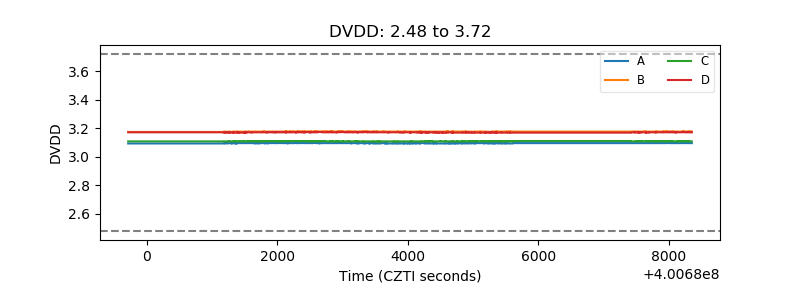 |
| Temperature 1 | 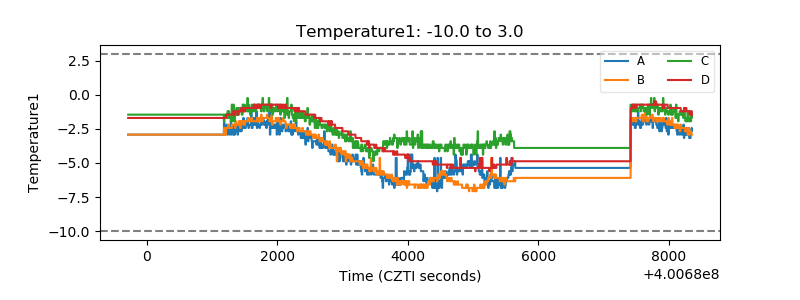 |
| Veto HV Monitor | 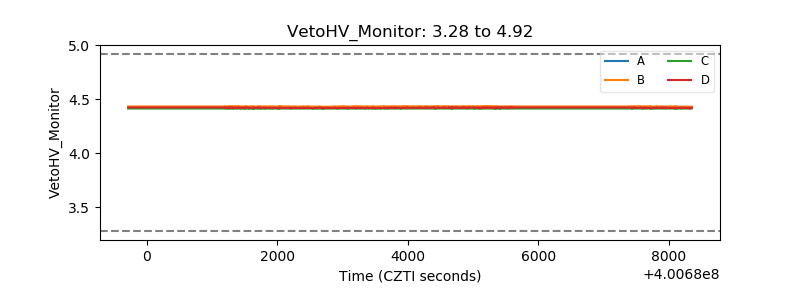 |
| Veto LLD | 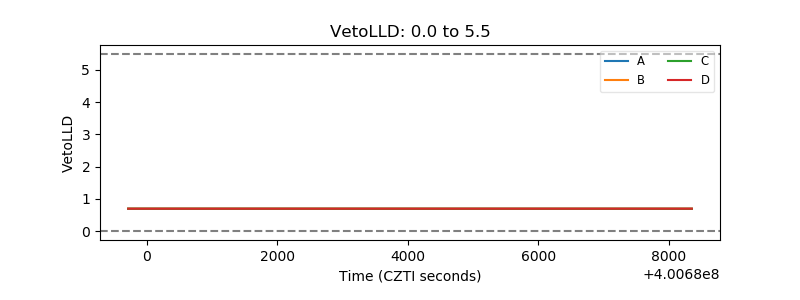 |
| Alpha Counter | 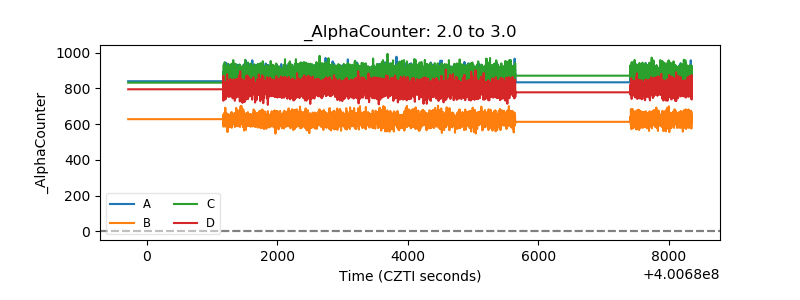 |
| _CPM_Rate | 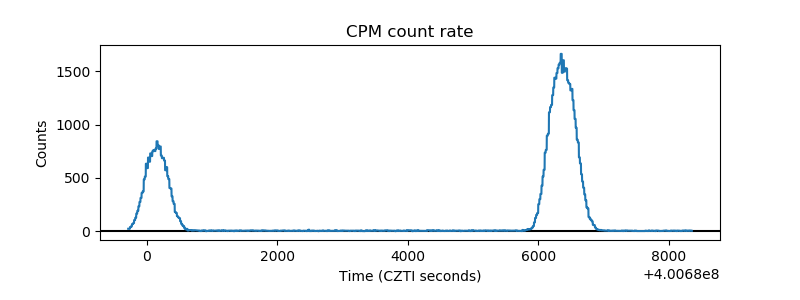 |
| CZT Counter | 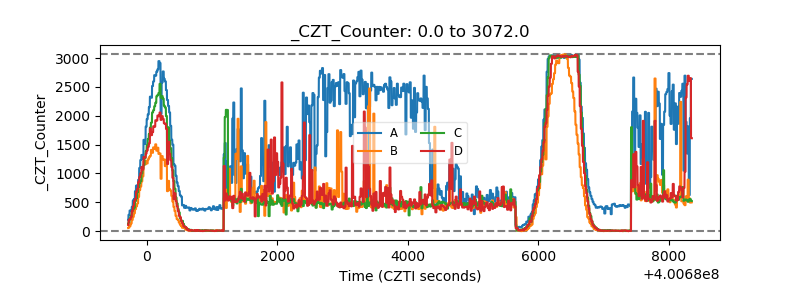 |
| +2.5 Volts monitor | 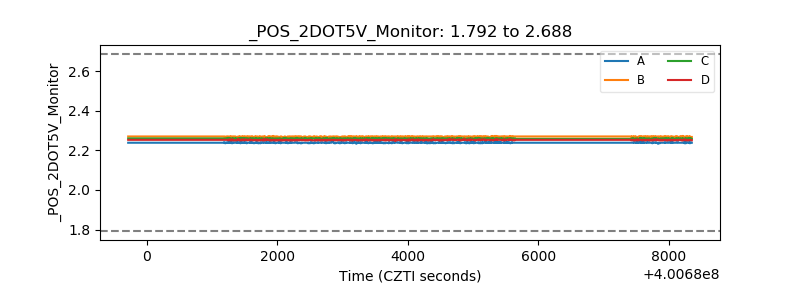 |
| +5 Volts monitor | 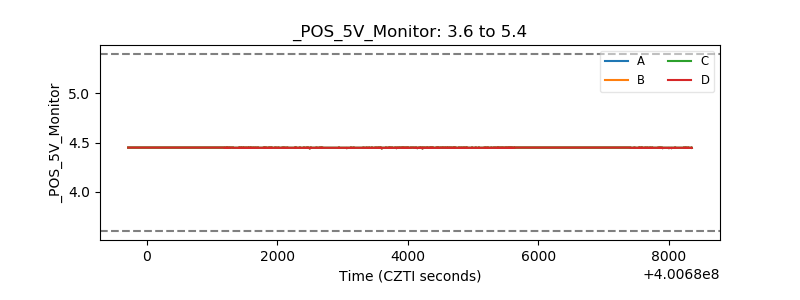 |
| _ROLL_ROT | 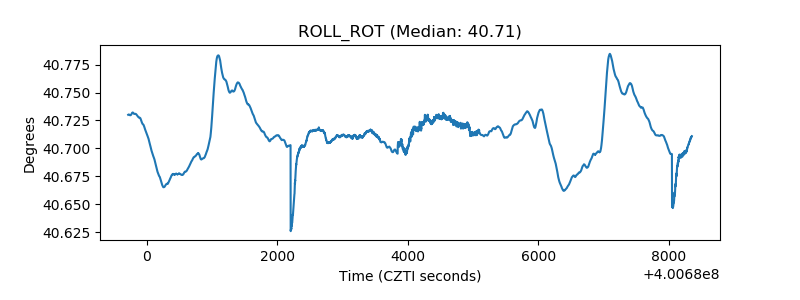 |
| _Roll_DEC | 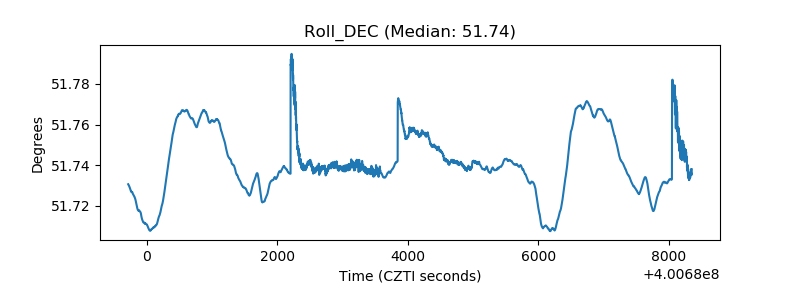 |
| _Roll_RA | 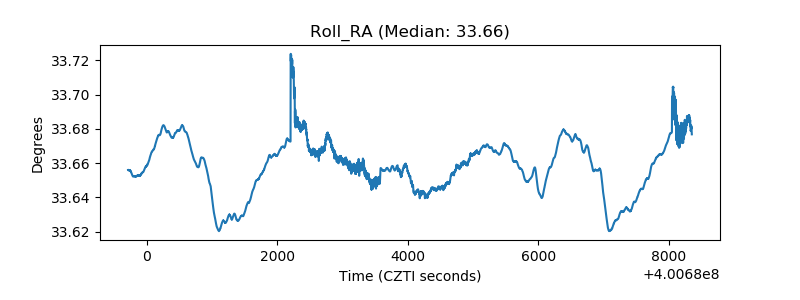 |
| Veto Counter | 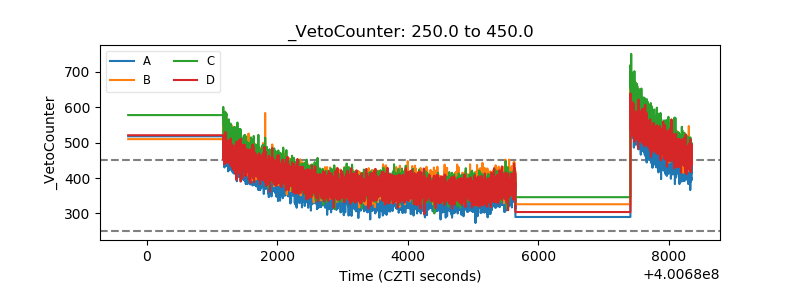 |