| Param | Original file | Final file |
|---|---|---|
| Filename | modeM0/AS1A11_075T01_9000005342_37621cztM0_level2.evt | modeM0/AS1A11_075T01_9000005342_37621cztM0_level2_quad_clean.evt |
| Size (bytes) | 536,328,000 | 95,598,720 |
| Size | 511.5 MB | 91.2 MB |
| Events in quadrant A | 7,086,878 | 583,713 |
| Events in quadrant B | 2,834,341 | 666,364 |
| Events in quadrant C | 2,924,093 | 664,433 |
| Events in quadrant D | 3,049,674 | 620,231 |
| Mode SS | |||
|---|---|---|---|
| Quadrant | BADHDUFLAG | Total packets | Discarded packets |
| A | 0 | 106 | 0 |
| B | 0 | 106 | 0 |
| C | 0 | 106 | 0 |
| D | 0 | 106 | 0 |
| Mode M0 | |||
|---|---|---|---|
| Quadrant | BADHDUFLAG | Total packets | Discarded packets |
| A | 0 | 24669 | 3 |
| B | 0 | 11815 | 2 |
| C | 0 | 11758 | 2 |
| D | 0 | 12491 | 2 |
| Mode M9 | |||
|---|---|---|---|
| Quadrant | BADHDUFLAG | Total packets | Discarded packets |
| A | 0 | 37 | 0 |
| B | 0 | 37 | 0 |
| C | 0 | 37 | 0 |
| D | 0 | 38 | 0 |
| Quadrant | Total seconds | Saturated seconds | Saturation percentage |
|---|---|---|---|
| A | 5135 | 1079 | 21.012658% |
| B | 5135 | 20 | 0.389484% |
| C | 5135 | 54 | 1.051607% |
| D | 5135 | 67 | 1.304771% |
Noise dominated data is calculated using 1-second bins in cleaned event files. If a bin has >2000 counts, and if more than 50% of those come from <1% of pixels, then it is considered to be noise-dominated and hence unusable.
| Quadrant | # 1 sec bins | Bins with >0 counts | Bins with >2000 counts | High rate bins dominated by noise | Noise dominated (total time) | Noise dominated (detector-on time) | Marked lightcurve |
|---|---|---|---|---|---|---|---|
| A | 7138 | 5136 | 990 | 990 | 13.87% | 19.28% | 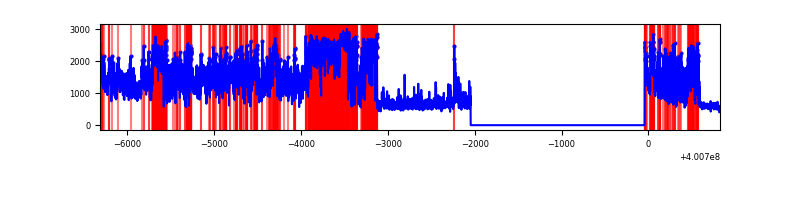 |
| B | 7137 | 5134 | 4 | 4 | 0.06% | 0.08% | 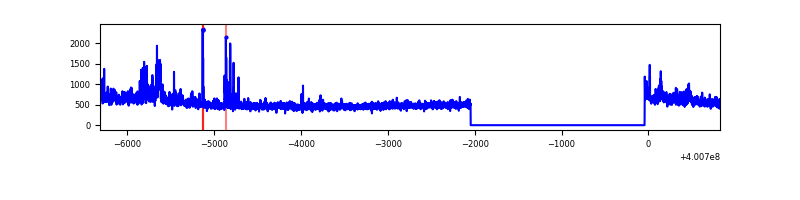 |
| C | 7137 | 5134 | 43 | 43 | 0.60% | 0.84% | 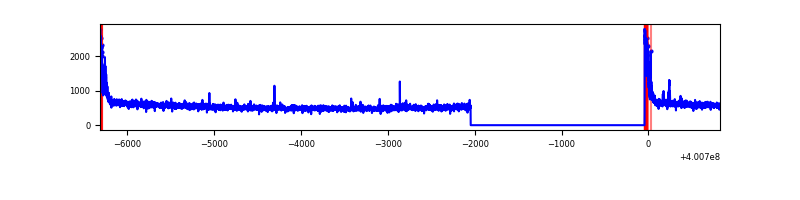 |
| D | 7137 | 5134 | 53 | 53 | 0.74% | 1.03% | 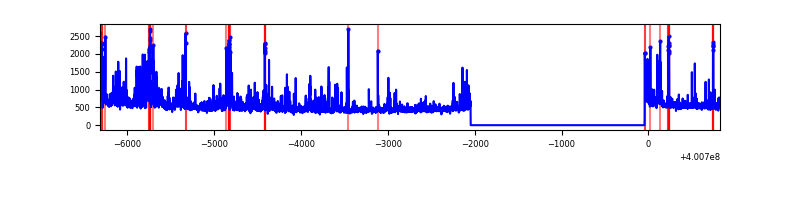 |
Top three noisy pixels from each quadrant. If the there are fewer than three noisy pixels in the level2.evt file, extra rows are filled as -1
| Pixel properties | Quadrant properties | ||||||
|---|---|---|---|---|---|---|---|
| Quadrant | DetID | PixID | Counts | Sigma | Mean | Median | Sigma |
| A | 15 | 222 | 4326425 | 35752.22 | 602 | 590 | 121.0 |
| A | 10 | 83 | 301843 | 2489.8 | 602 | 590 | 121.0 |
| A | 9 | 143 | 81693 | 670.3 | 602 | 590 | 121.0 |
| B | 0 | 189 | 108528 | 894.15 | 645 | 628 | 120.7 |
| B | 4 | 232 | 80267 | 659.95 | 645 | 628 | 120.7 |
| B | 0 | 230 | 36643 | 298.45 | 645 | 628 | 120.7 |
| C | 15 | 214 | 235500 | 1606.86 | 637 | 643 | 146.2 |
| C | 0 | 10 | 181609 | 1238.15 | 637 | 643 | 146.2 |
| C | 12 | 250 | 11286 | 72.82 | 637 | 643 | 146.2 |
| D | 12 | 233 | 254660 | 1677.5 | 631 | 616 | 151.4 |
| D | 2 | 153 | 116842 | 767.46 | 631 | 616 | 151.4 |
| D | 2 | 250 | 73522 | 481.41 | 631 | 616 | 151.4 |
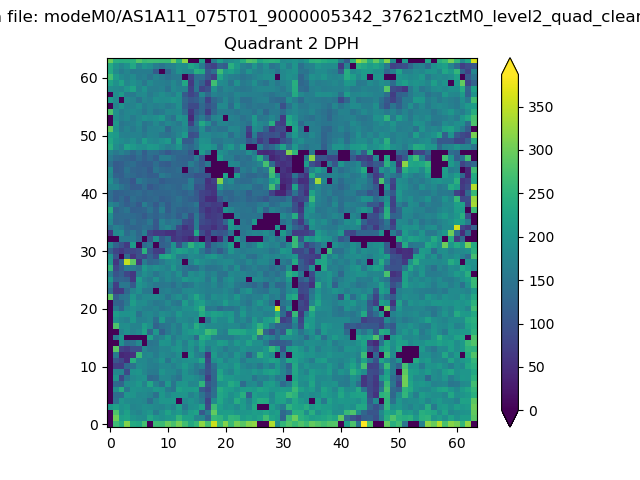
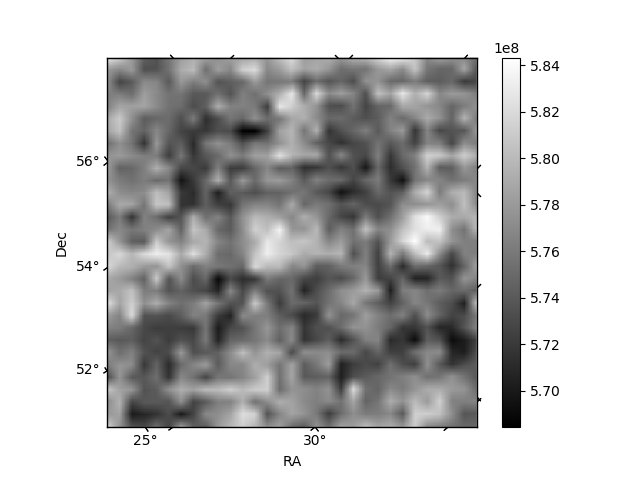
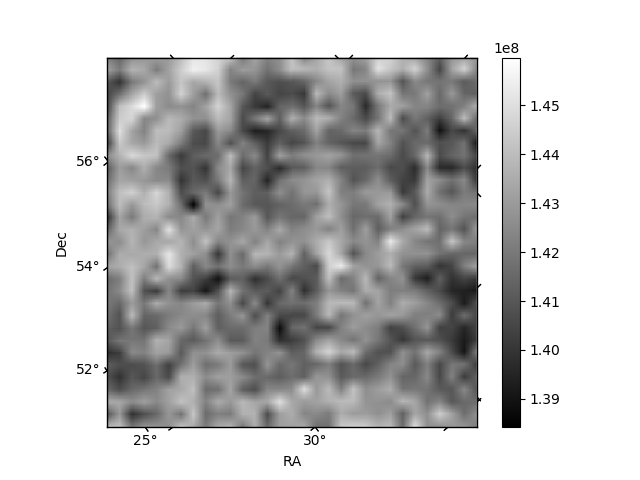
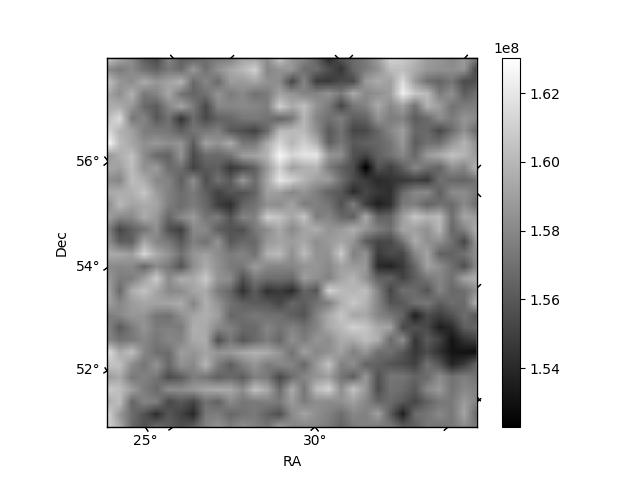
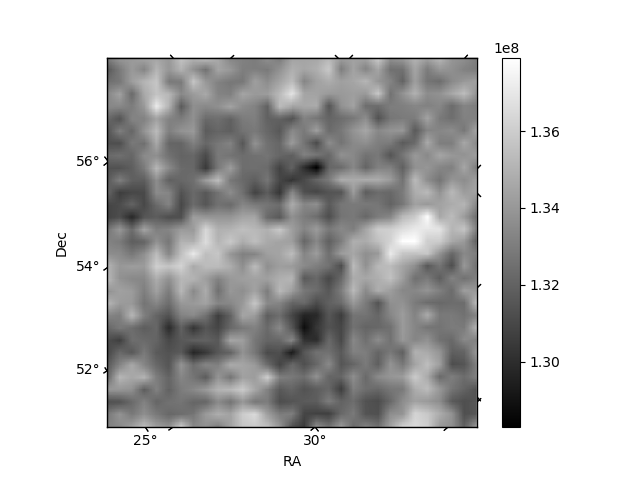
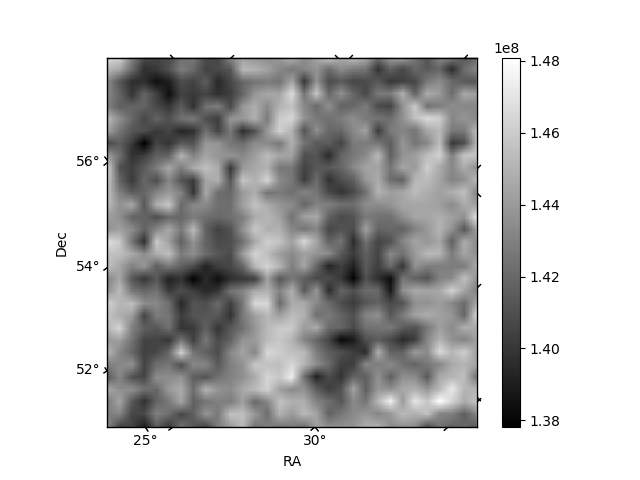
Histogram calculated using DETX and DETY for each event in the final _common_clean file
| Quadrant A | 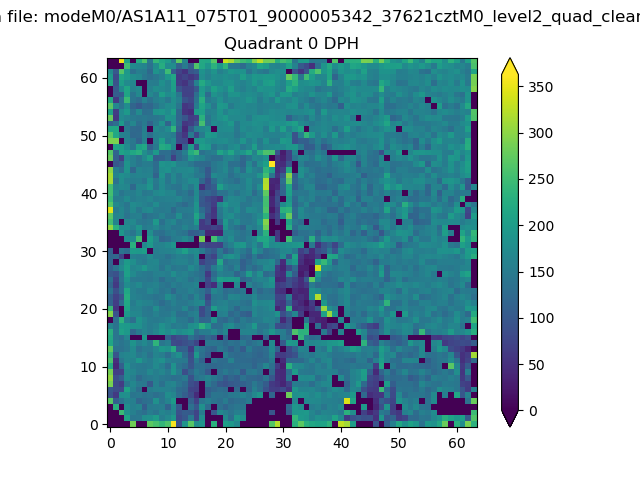 |
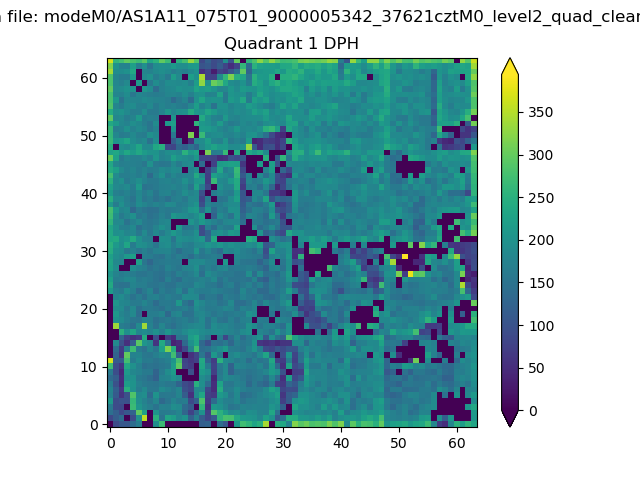 |
Quadrant B |
|---|---|---|---|
| Quadrant D | 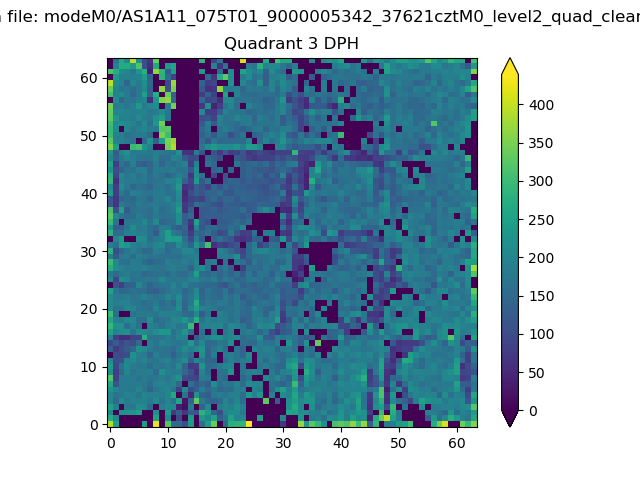 |
 |
Quadrant C |
| Plot type | Count rate plots | Images |
|---|---|---|
| Comparison with Poisson distribution Blue bars denote a histogram of data divided into 1 sec bins. Red curve is a Poisson curve with rate = median count rate of data. |
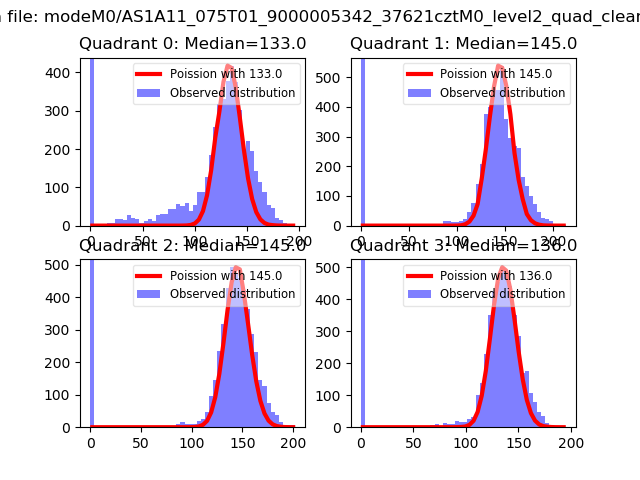 |
 |
| Quadrant-wise count rates Data is divided into 100 sec bins |
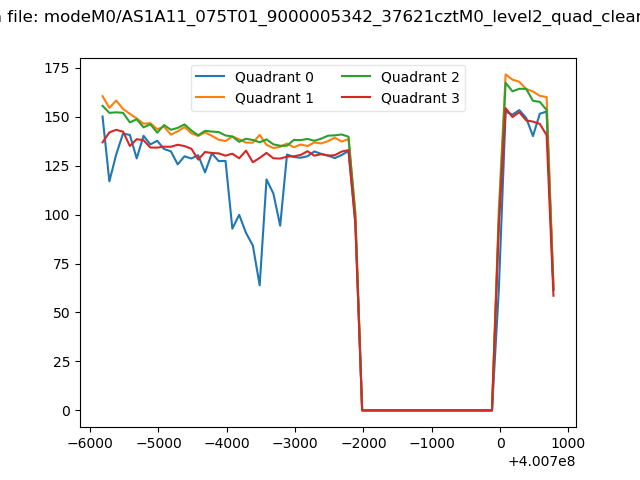 |
|
| Module-wise count rates for Quadrant A Data is divided into 100 sec bins |
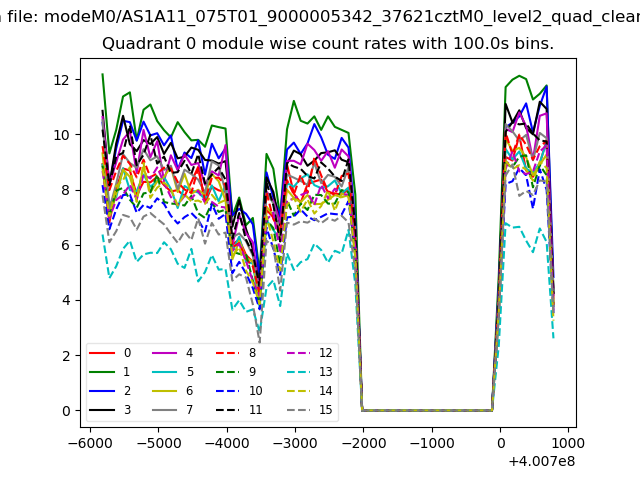 |
 |
| Module-wise count rates for Quadrant B Data is divided into 100 sec bins |
 |
 |
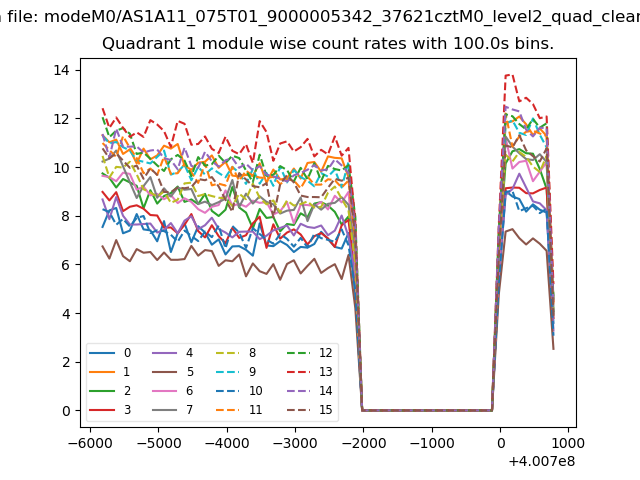
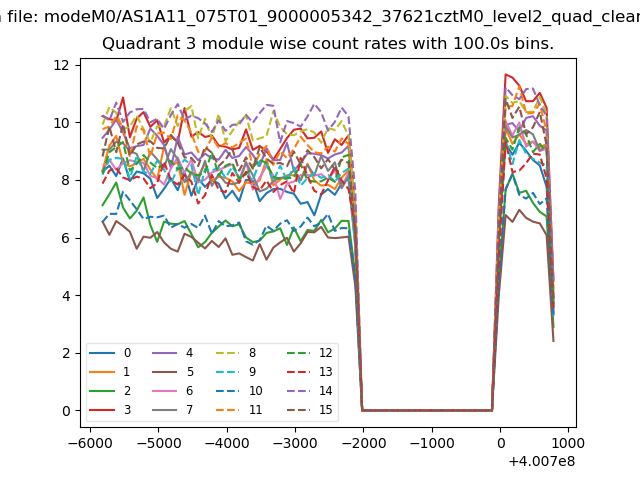
| Module-wise count rates for Quadrant C Data is divided into 100 sec bins |
 |
 |
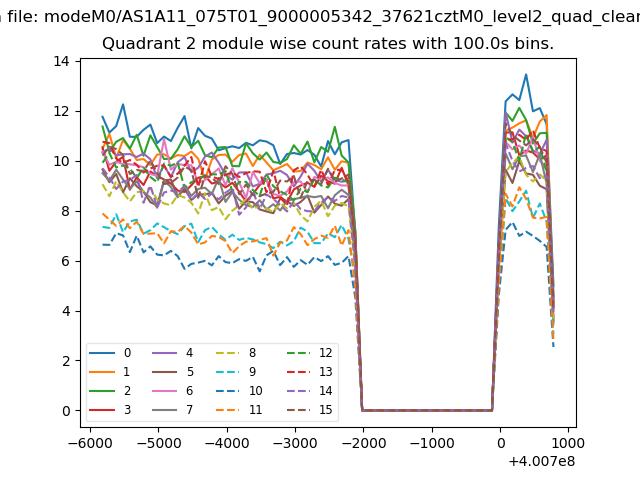
| Module-wise count rates for Quadrant D Data is divided into 100 sec bins |
 |
 |
| Parameter | Plot |
|---|---|
| CZT HV Monitor | 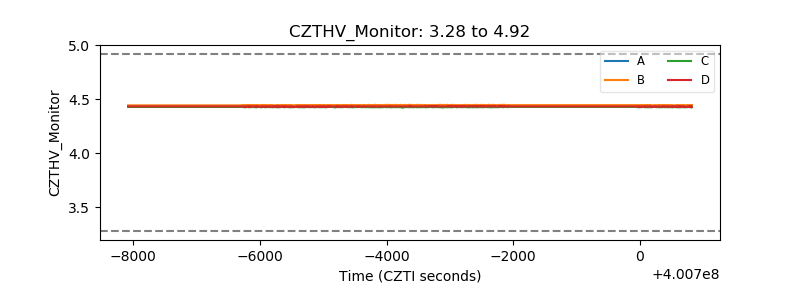 |
| D_VDD | 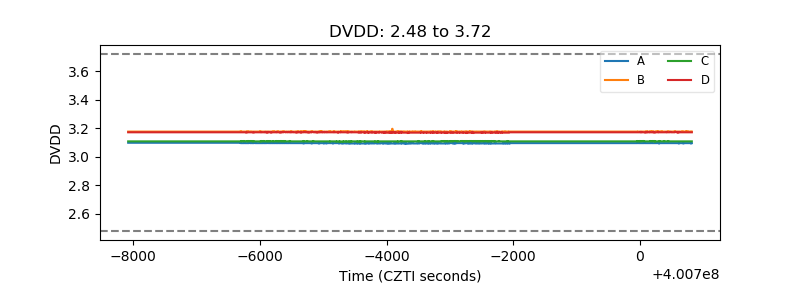 |
| Temperature 1 | 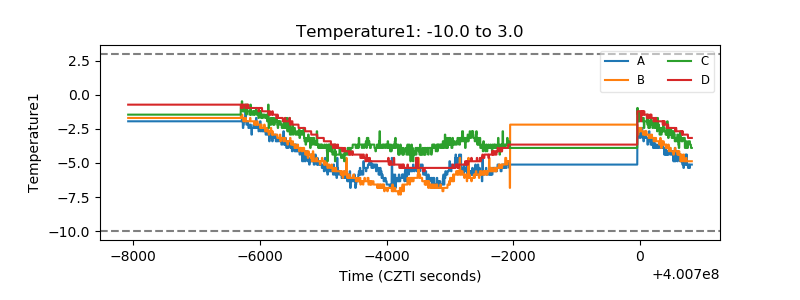 |
| Veto HV Monitor |  |
| Veto LLD | 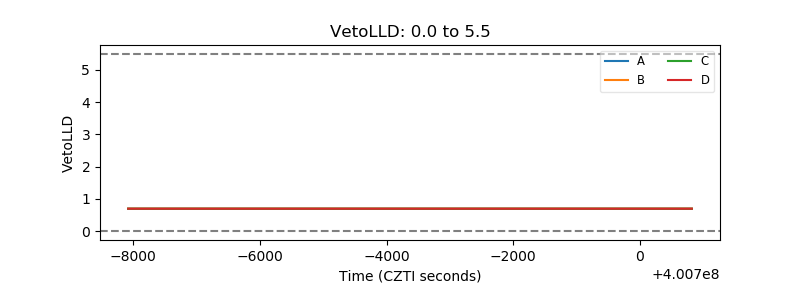 |
| Alpha Counter | 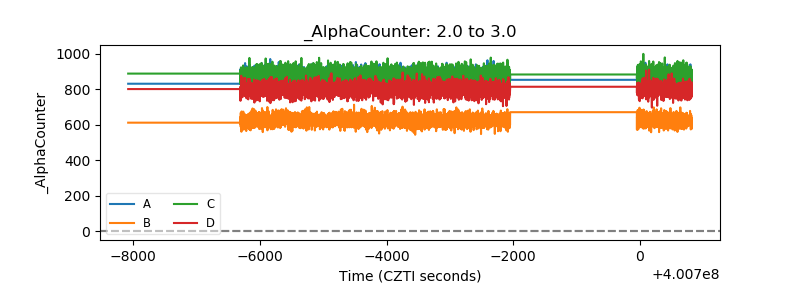 |
| _CPM_Rate | 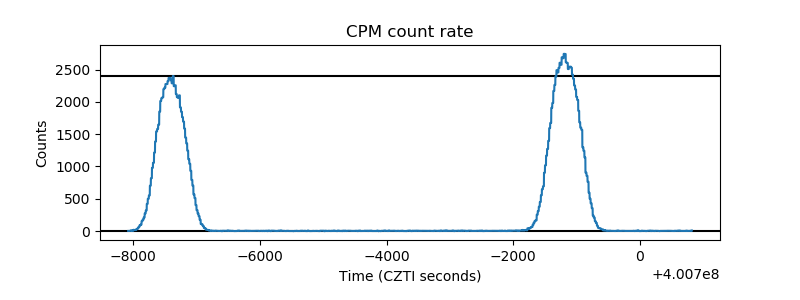 |
| CZT Counter | 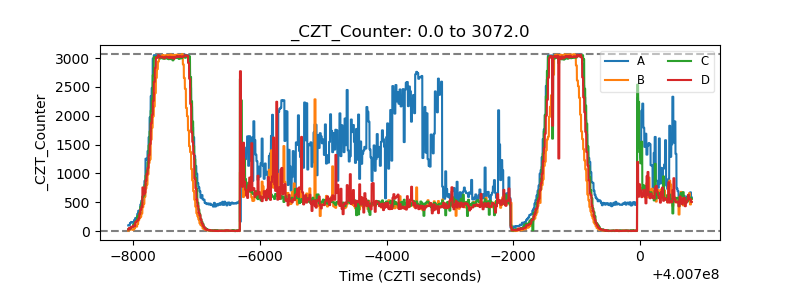 |
| +2.5 Volts monitor | 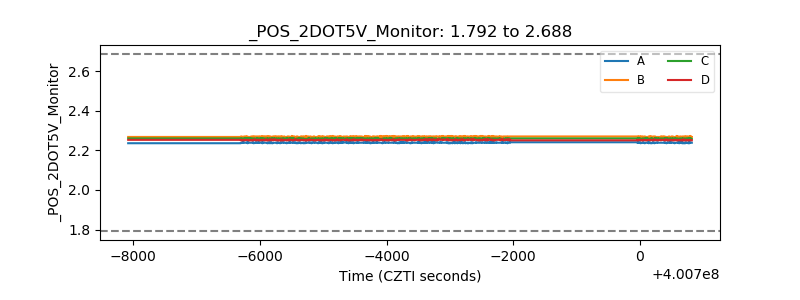 |
| +5 Volts monitor | 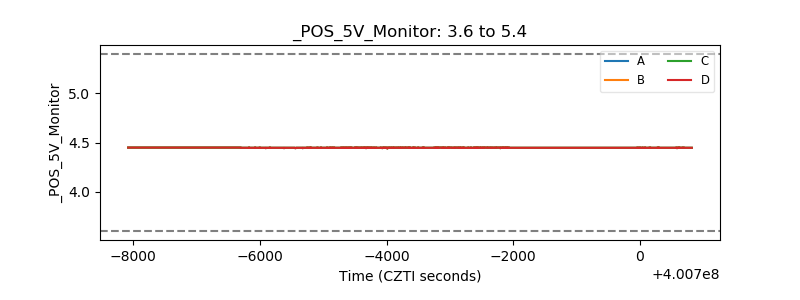 |
| _ROLL_ROT | 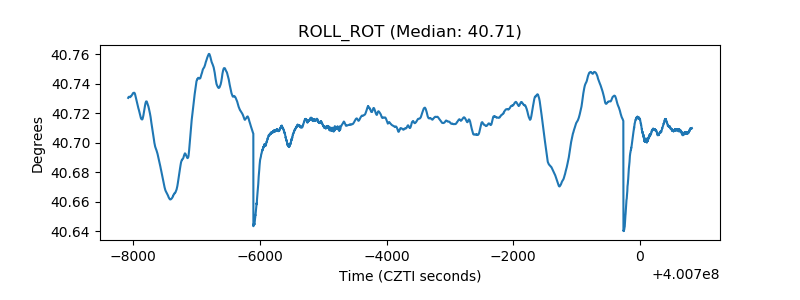 |
| _Roll_DEC | 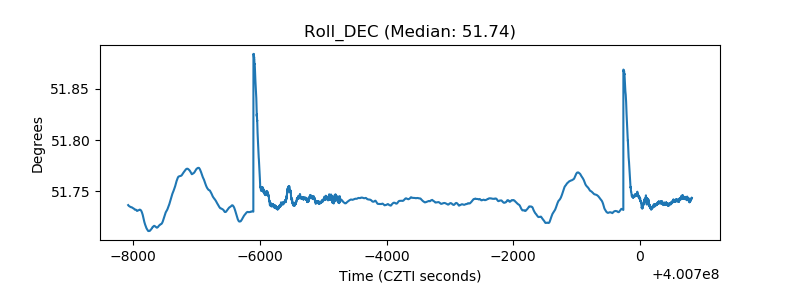 |
| _Roll_RA | 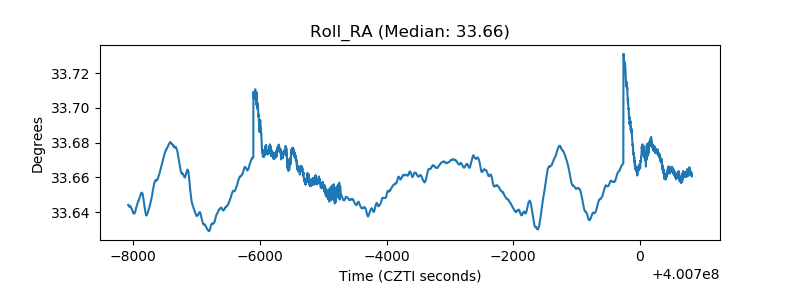 |
| Veto Counter | 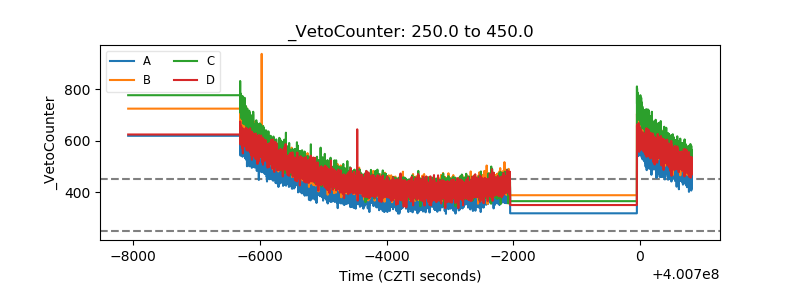 |