| Param | Original file | Final file |
|---|---|---|
| Filename | modeM0/AS1A11_075T01_9000005342_37623cztM0_level2.evt | modeM0/AS1A11_075T01_9000005342_37623cztM0_level2_quad_clean.evt |
| Size (bytes) | 451,261,440 | 95,270,400 |
| Size | 430.4 MB | 90.9 MB |
| Events in quadrant A | 3,270,498 | 617,676 |
| Events in quadrant B | 3,334,191 | 640,719 |
| Events in quadrant C | 2,961,285 | 650,279 |
| Events in quadrant D | 3,729,036 | 593,529 |
| Mode SS | |||
|---|---|---|---|
| Quadrant | BADHDUFLAG | Total packets | Discarded packets |
| A | 0 | 114 | 0 |
| B | 0 | 114 | 0 |
| C | 0 | 114 | 0 |
| D | 0 | 114 | 0 |
| Mode M0 | |||
|---|---|---|---|
| Quadrant | BADHDUFLAG | Total packets | Discarded packets |
| A | 0 | 13265 | 3 |
| B | 0 | 13359 | 2 |
| C | 0 | 11939 | 2 |
| D | 0 | 14903 | 2 |
| Mode M9 | |||
|---|---|---|---|
| Quadrant | BADHDUFLAG | Total packets | Discarded packets |
| A | 0 | 42 | 0 |
| B | 0 | 42 | 0 |
| C | 0 | 42 | 0 |
| D | 0 | 42 | 0 |
| Quadrant | Total seconds | Saturated seconds | Saturation percentage |
|---|---|---|---|
| A | 5470 | 24 | 0.438757% |
| B | 5470 | 139 | 2.541133% |
| C | 5470 | 34 | 0.621572% |
| D | 5470 | 280 | 5.118830% |
Noise dominated data is calculated using 1-second bins in cleaned event files. If a bin has >2000 counts, and if more than 50% of those come from <1% of pixels, then it is considered to be noise-dominated and hence unusable.
| Quadrant | # 1 sec bins | Bins with >0 counts | Bins with >2000 counts | High rate bins dominated by noise | Noise dominated (total time) | Noise dominated (detector-on time) | Marked lightcurve |
|---|---|---|---|---|---|---|---|
| A | 9687 | 5472 | 19 | 19 | 0.20% | 0.35% | 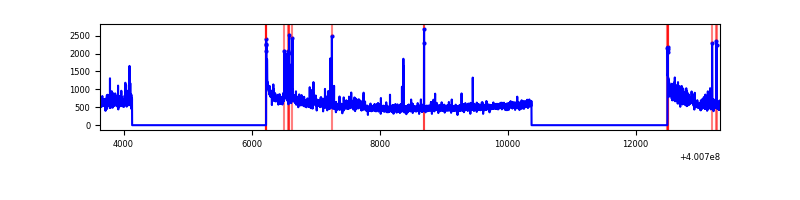 |
| B | 9687 | 5470 | 101 | 101 | 1.04% | 1.85% | 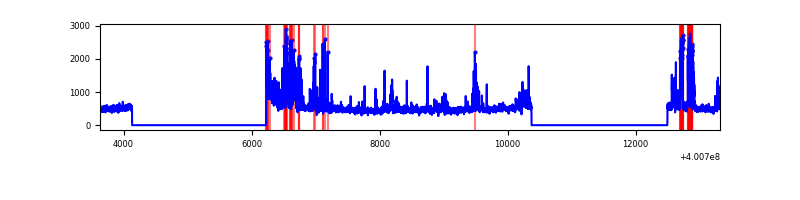 |
| C | 9687 | 5470 | 28 | 28 | 0.29% | 0.51% | 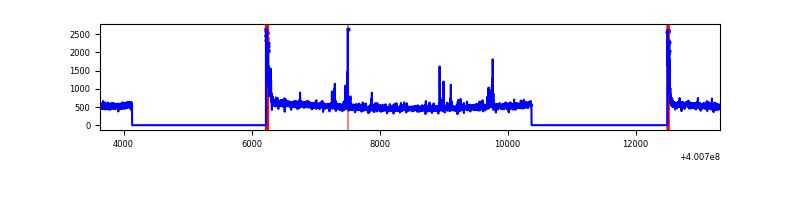 |
| D | 9687 | 5470 | 281 | 281 | 2.90% | 5.14% | 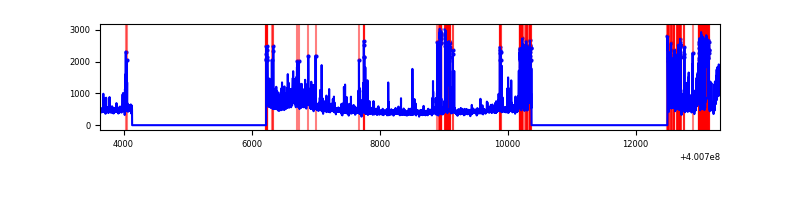 |
Top three noisy pixels from each quadrant. If the there are fewer than three noisy pixels in the level2.evt file, extra rows are filled as -1
| Pixel properties | Quadrant properties | ||||||
|---|---|---|---|---|---|---|---|
| Quadrant | DetID | PixID | Counts | Sigma | Mean | Median | Sigma |
| A | 15 | 222 | 371696 | 2861.91 | 646 | 636 | 129.7 |
| A | 10 | 83 | 315249 | 2426.55 | 646 | 636 | 129.7 |
| A | 9 | 143 | 43708 | 332.21 | 646 | 636 | 129.7 |
| B | 5 | 172 | 295938 | 2431.48 | 650 | 635 | 121.4 |
| B | 5 | 255 | 201550 | 1654.3 | 650 | 635 | 121.4 |
| B | 4 | 232 | 97108 | 794.34 | 650 | 635 | 121.4 |
| C | 15 | 214 | 251091 | 1677.03 | 649 | 656 | 149.3 |
| C | 0 | 10 | 123817 | 824.75 | 649 | 656 | 149.3 |
| C | 14 | 254 | 26762 | 174.82 | 649 | 656 | 149.3 |
| D | 2 | 249 | 489751 | 3293.35 | 625 | 611 | 148.5 |
| D | 13 | 171 | 198510 | 1332.44 | 625 | 611 | 148.5 |
| D | 2 | 250 | 176661 | 1185.33 | 625 | 611 | 148.5 |
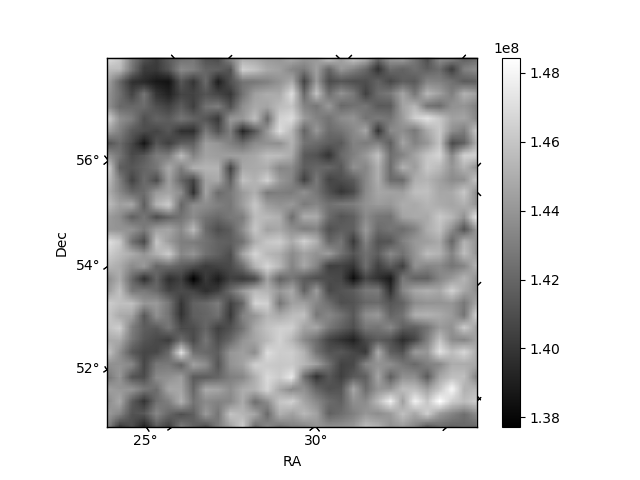
Histogram calculated using DETX and DETY for each event in the final _common_clean file
| Quadrant A | 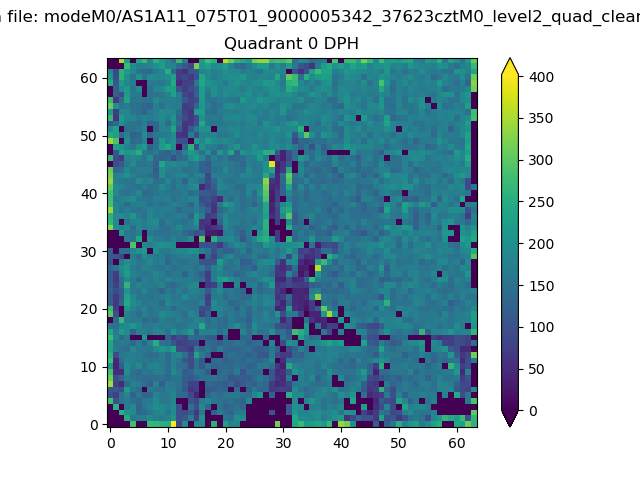 |
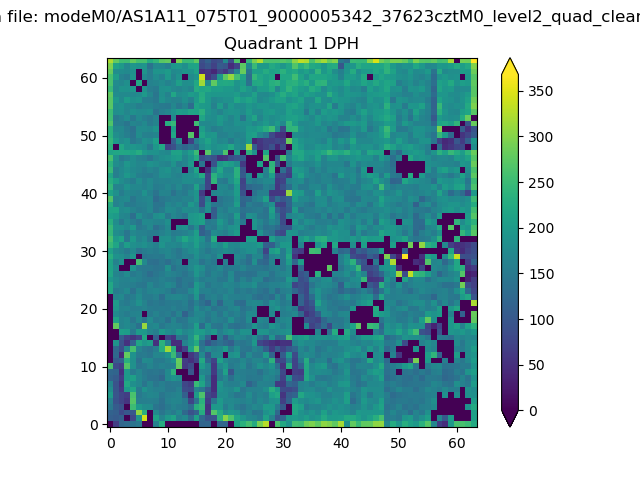 |
Quadrant B |
|---|---|---|---|
| Quadrant D | 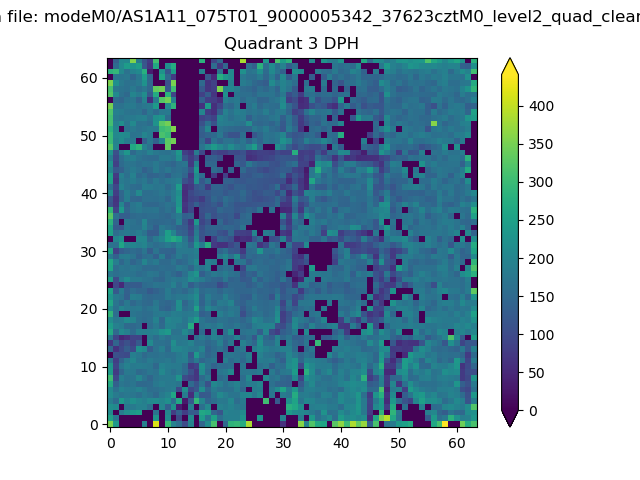 |
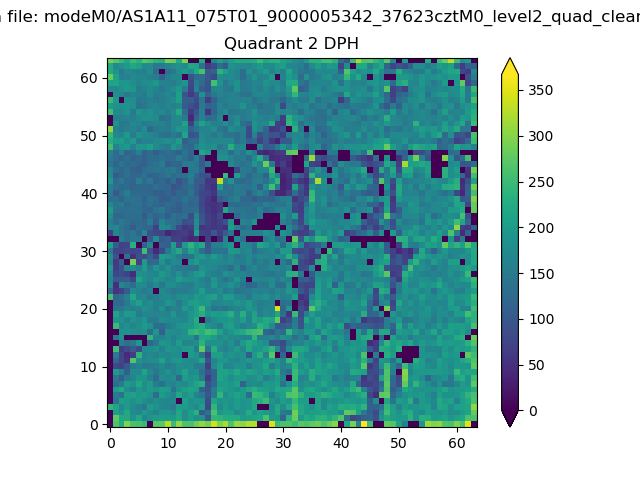 |
Quadrant C |
| Plot type | Count rate plots | Images |
|---|---|---|
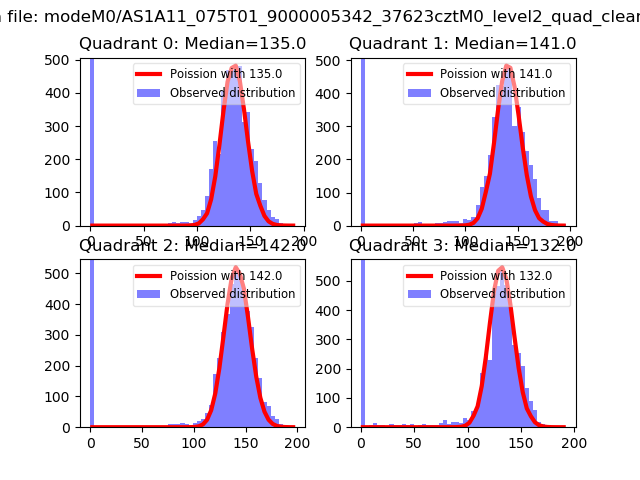
| Comparison with Poisson distribution Blue bars denote a histogram of data divided into 1 sec bins. Red curve is a Poisson curve with rate = median count rate of data. |
 |
 |
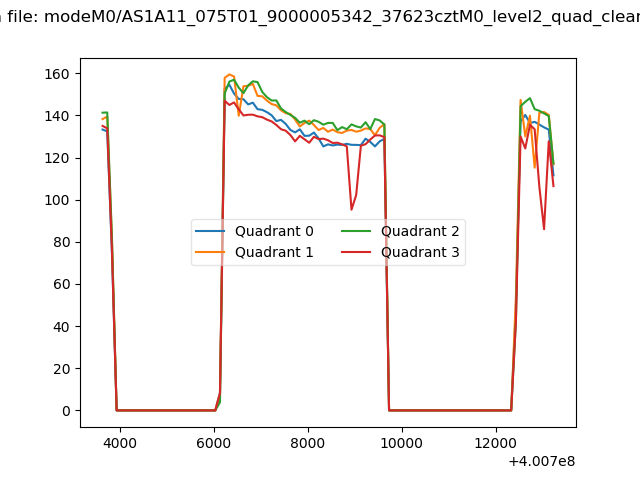
| Quadrant-wise count rates Data is divided into 100 sec bins |
 |
|
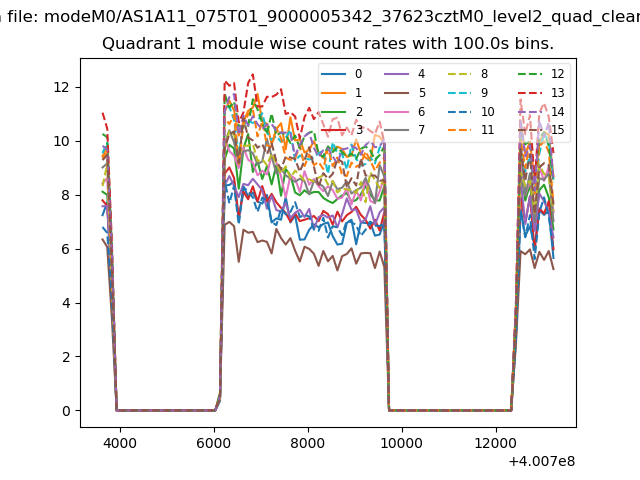
| Module-wise count rates for Quadrant A Data is divided into 100 sec bins |
 |
 |
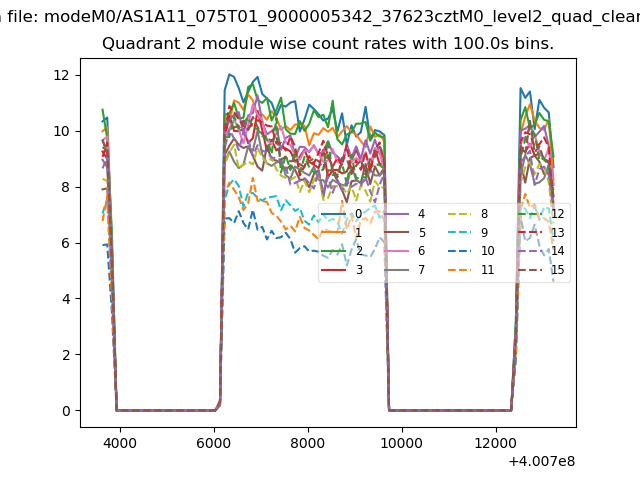
| Module-wise count rates for Quadrant B Data is divided into 100 sec bins |
 |
 |
| Module-wise count rates for Quadrant C Data is divided into 100 sec bins |
 |
 |
| Module-wise count rates for Quadrant D Data is divided into 100 sec bins |
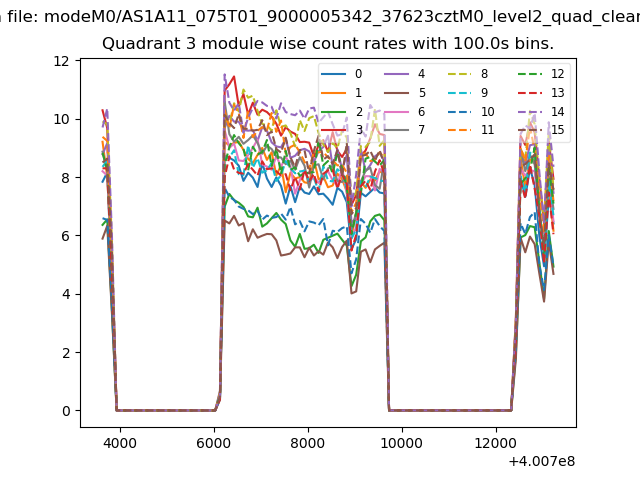 |
 |
| Parameter | Plot |
|---|---|
| CZT HV Monitor | 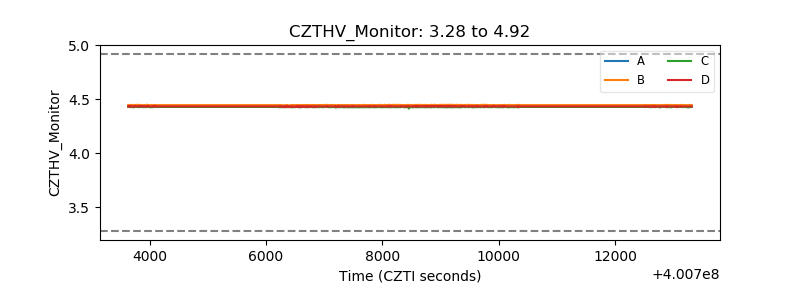 |
| D_VDD | 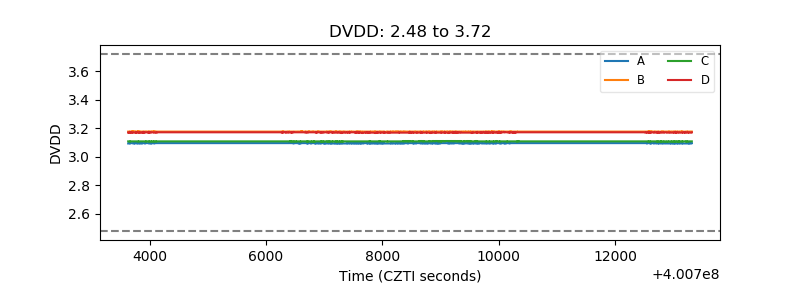 |
| Temperature 1 | 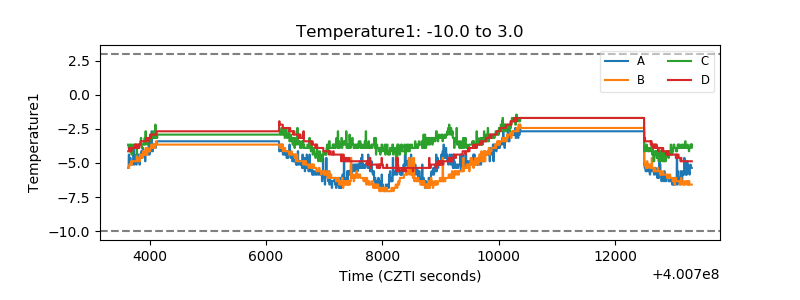 |
| Veto HV Monitor | 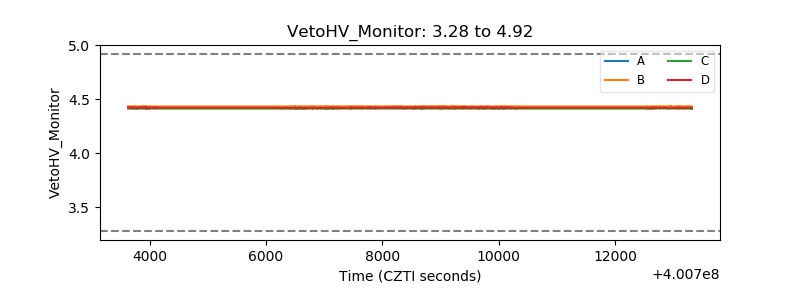 |
| Veto LLD | 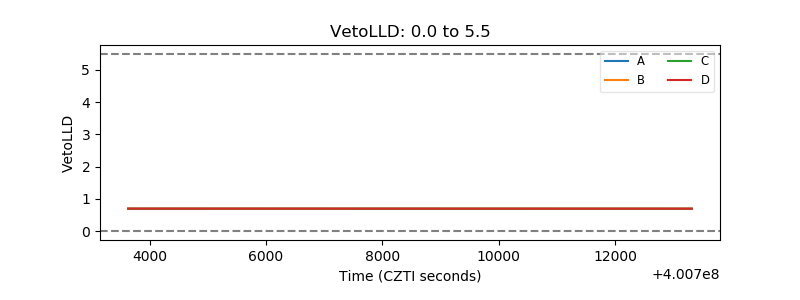 |
| Alpha Counter | 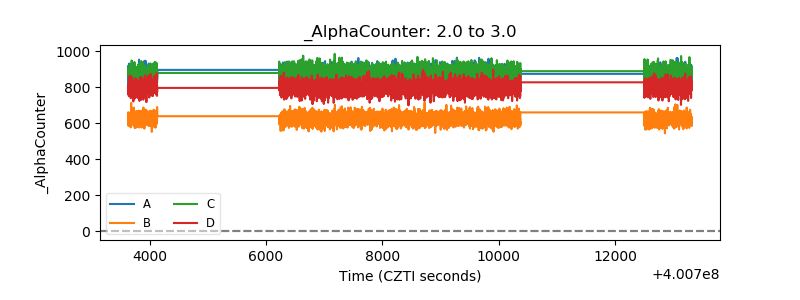 |
| _CPM_Rate | 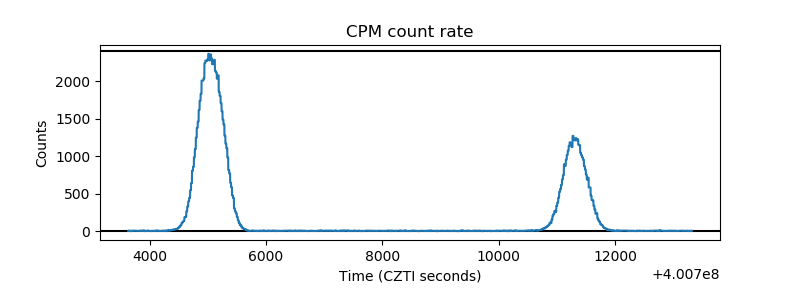 |
| CZT Counter | 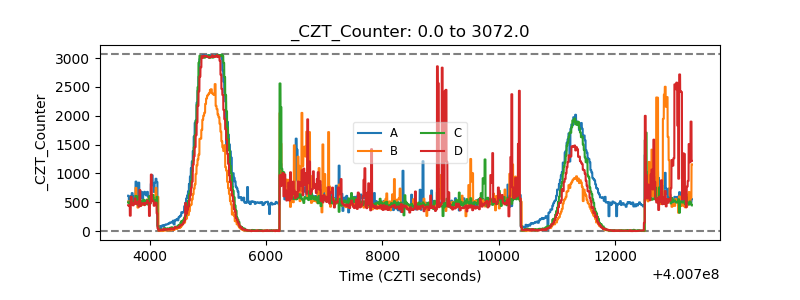 |
| +2.5 Volts monitor | 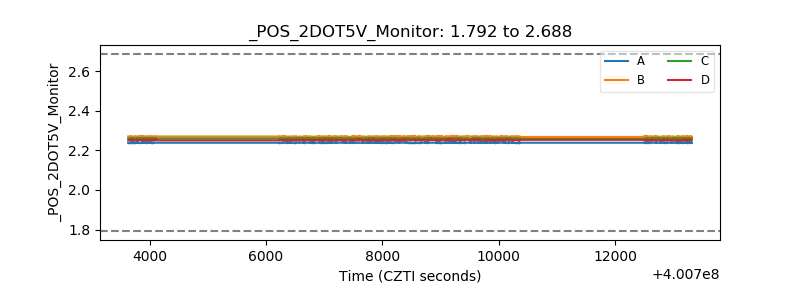 |
| +5 Volts monitor | 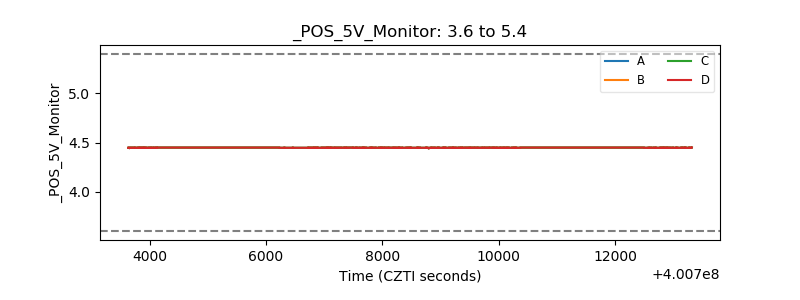 |
| _ROLL_ROT | 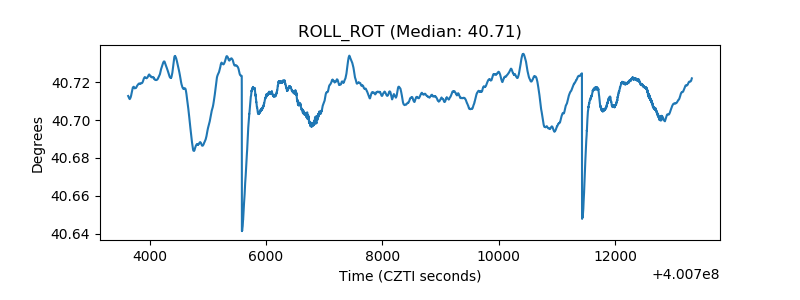 |
| _Roll_DEC | 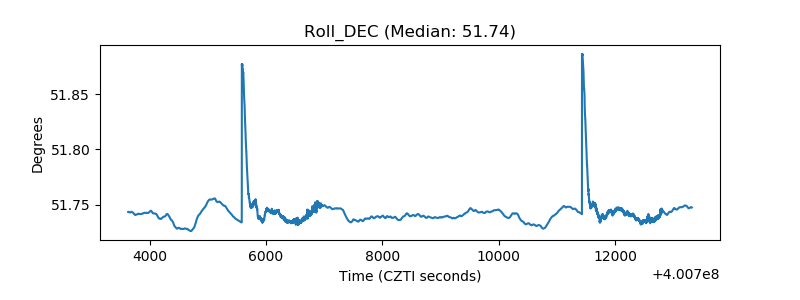 |
| _Roll_RA | 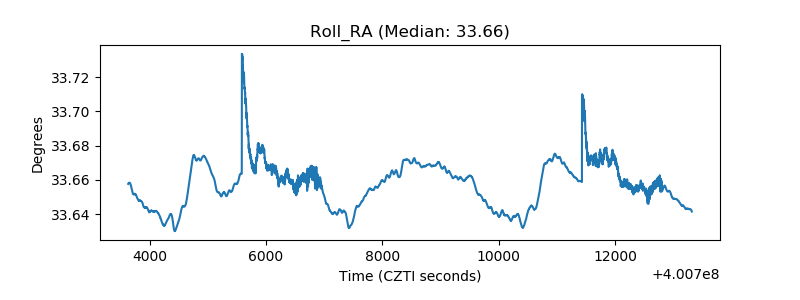 |
| Veto Counter | 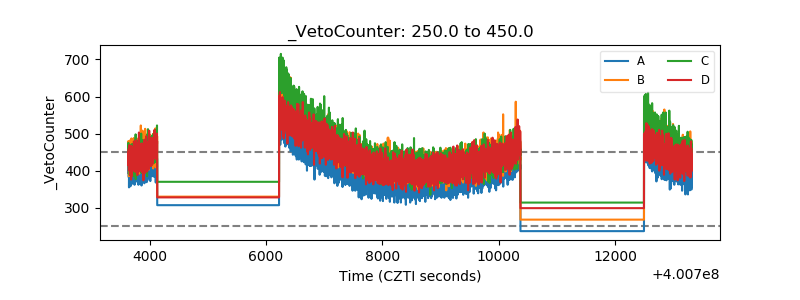 |