| Param | Original file | Final file |
|---|---|---|
| Filename | modeM0/AS1A11_075T01_9000005342_37625cztM0_level2.evt | modeM0/AS1A11_075T01_9000005342_37625cztM0_level2_quad_clean.evt |
| Size (bytes) | 479,044,800 | 69,537,600 |
| Size | 456.9 MB | 66.3 MB |
| Events in quadrant A | 3,762,355 | 412,659 |
| Events in quadrant B | 3,200,581 | 434,371 |
| Events in quadrant C | 3,021,860 | 439,158 |
| Events in quadrant D | 4,119,948 | 404,353 |
| Mode SS | |||
|---|---|---|---|
| Quadrant | BADHDUFLAG | Total packets | Discarded packets |
| A | 0 | 120 | 0 |
| B | 0 | 120 | 0 |
| C | 0 | 120 | 0 |
| D | 0 | 120 | 0 |
| Mode M0 | |||
|---|---|---|---|
| Quadrant | BADHDUFLAG | Total packets | Discarded packets |
| A | 0 | 15115 | 3 |
| B | 0 | 13472 | 2 |
| C | 0 | 12586 | 2 |
| D | 0 | 16537 | 2 |
| Mode M9 | |||
|---|---|---|---|
| Quadrant | BADHDUFLAG | Total packets | Discarded packets |
| A | 0 | 40 | 0 |
| B | 0 | 40 | 0 |
| C | 0 | 40 | 0 |
| D | 0 | 40 | 0 |
| Quadrant | Total seconds | Saturated seconds | Saturation percentage |
|---|---|---|---|
| A | 5946 | 255 | 4.288597% |
| B | 5946 | 164 | 2.758157% |
| C | 5946 | 34 | 0.571813% |
| D | 5946 | 385 | 6.474941% |
Noise dominated data is calculated using 1-second bins in cleaned event files. If a bin has >2000 counts, and if more than 50% of those come from <1% of pixels, then it is considered to be noise-dominated and hence unusable.
| Quadrant | # 1 sec bins | Bins with >0 counts | Bins with >2000 counts | High rate bins dominated by noise | Noise dominated (total time) | Noise dominated (detector-on time) | Marked lightcurve |
|---|---|---|---|---|---|---|---|
| A | 9830 | 5948 | 224 | 224 | 2.28% | 3.77% | 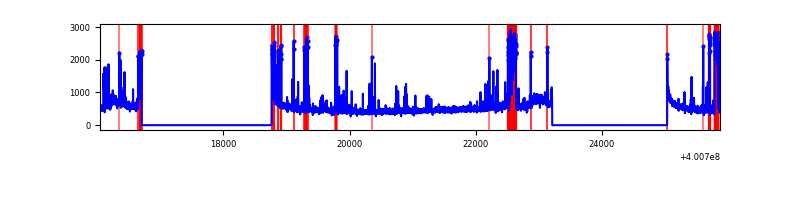 |
| B | 9829 | 5945 | 87 | 87 | 0.89% | 1.46% | 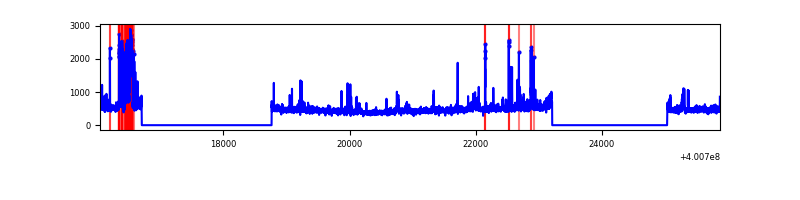 |
| C | 9830 | 5947 | 34 | 34 | 0.35% | 0.57% | 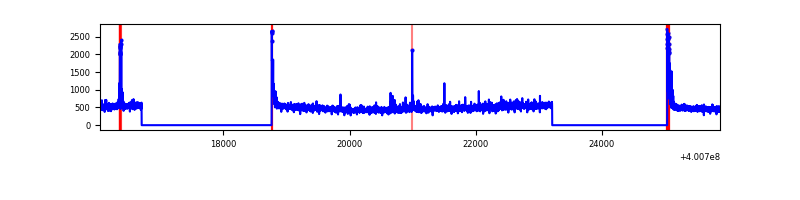 |
| D | 9830 | 5947 | 364 | 364 | 3.70% | 6.12% | 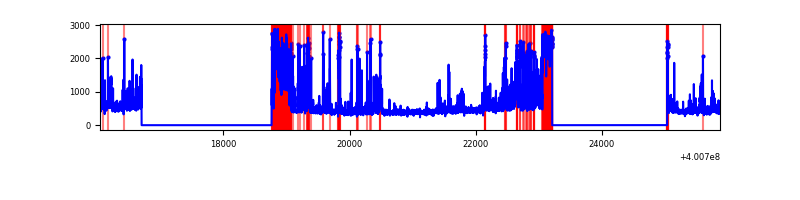 |
Top three noisy pixels from each quadrant. If the there are fewer than three noisy pixels in the level2.evt file, extra rows are filled as -1
| Pixel properties | Quadrant properties | ||||||
|---|---|---|---|---|---|---|---|
| Quadrant | DetID | PixID | Counts | Sigma | Mean | Median | Sigma |
| A | 15 | 222 | 536016 | 4036.98 | 656 | 643 | 132.6 |
| A | 10 | 83 | 320200 | 2409.62 | 656 | 643 | 132.6 |
| A | 13 | 248 | 247941 | 1864.75 | 656 | 643 | 132.6 |
| B | 5 | 172 | 329158 | 2592.22 | 661 | 643 | 126.7 |
| B | 0 | 189 | 62499 | 488.09 | 661 | 643 | 126.7 |
| B | 4 | 232 | 54511 | 425.06 | 661 | 643 | 126.7 |
| C | 15 | 214 | 270098 | 1765.69 | 658 | 663 | 152.6 |
| C | 0 | 10 | 117396 | 764.99 | 658 | 663 | 152.6 |
| C | 14 | 254 | 61051 | 395.74 | 658 | 663 | 152.6 |
| D | 12 | 233 | 438463 | 2865.32 | 630 | 612 | 152.8 |
| D | 12 | 227 | 419767 | 2742.97 | 630 | 612 | 152.8 |
| D | 2 | 249 | 283885 | 1853.75 | 630 | 612 | 152.8 |
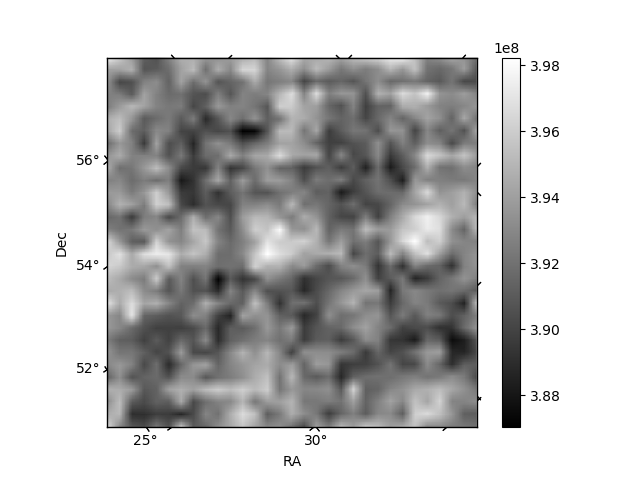
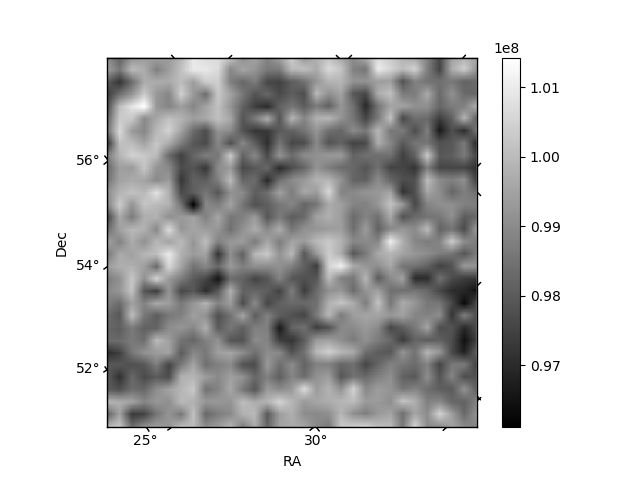
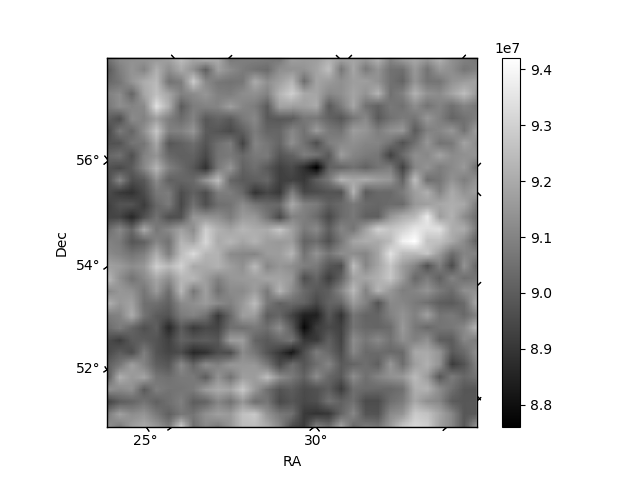
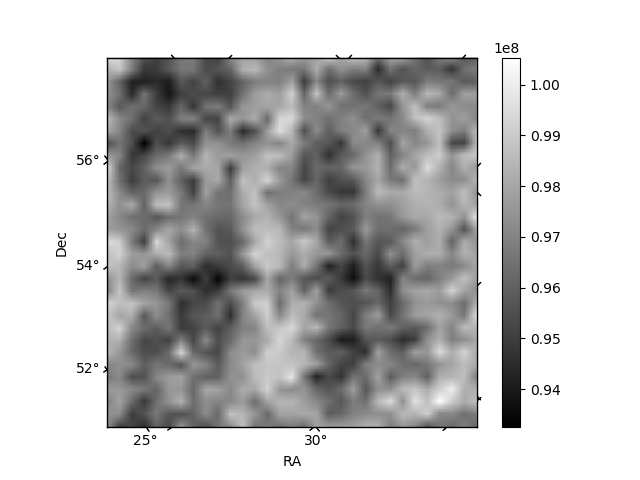
Histogram calculated using DETX and DETY for each event in the final _common_clean file
| Quadrant A | 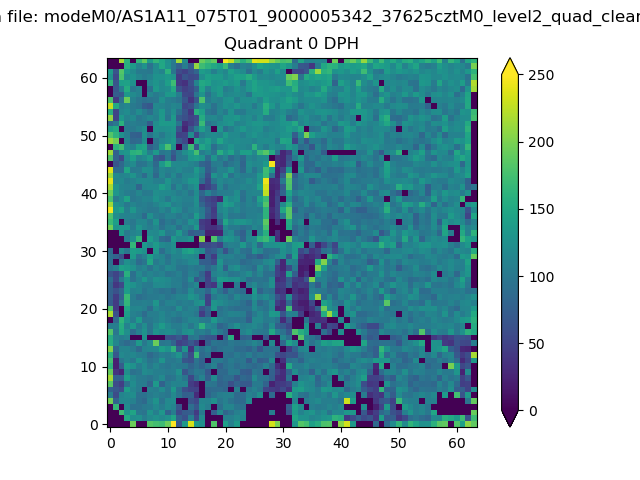 |
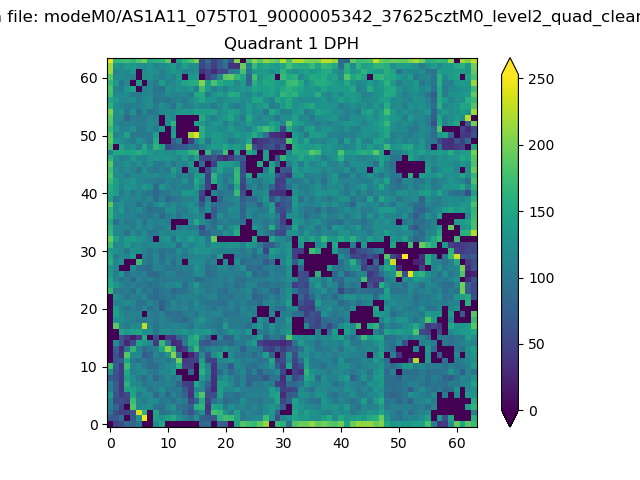 |
Quadrant B |
|---|---|---|---|
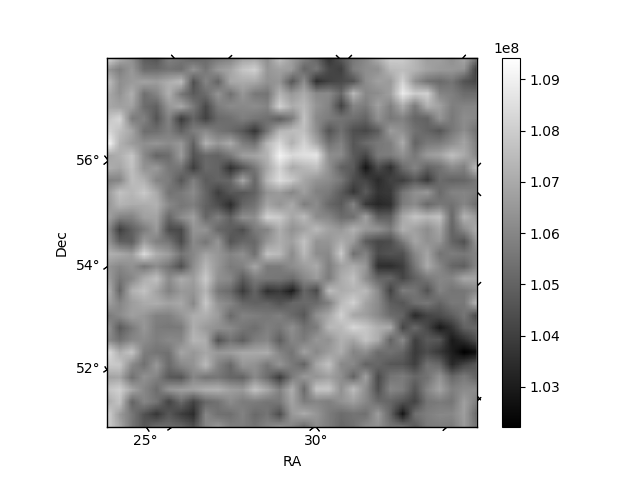
| Quadrant D | 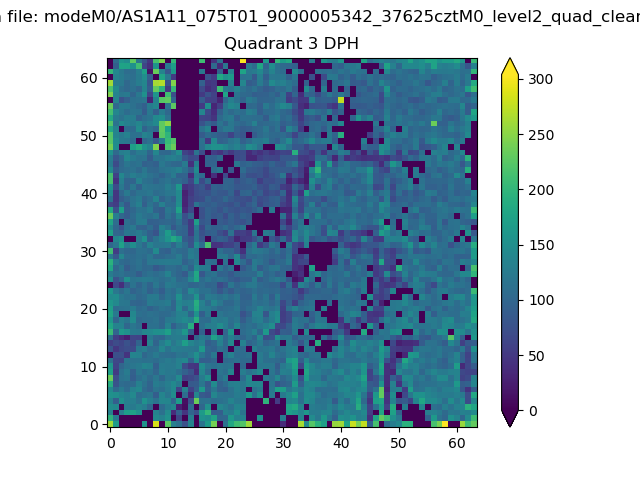 |
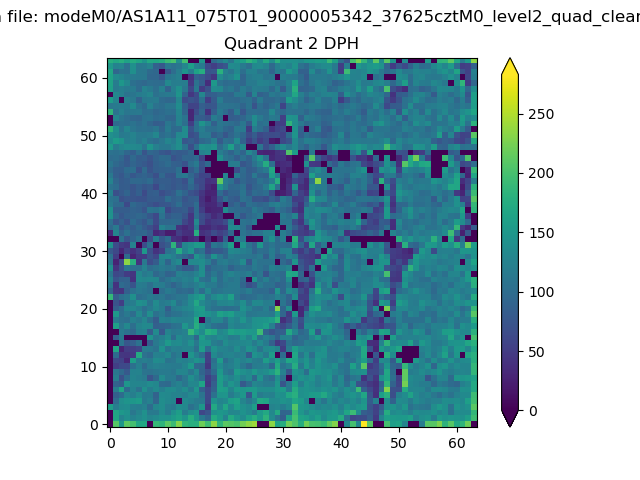 |
Quadrant C |
| Plot type | Count rate plots | Images |
|---|---|---|
| Comparison with Poisson distribution Blue bars denote a histogram of data divided into 1 sec bins. Red curve is a Poisson curve with rate = median count rate of data. |
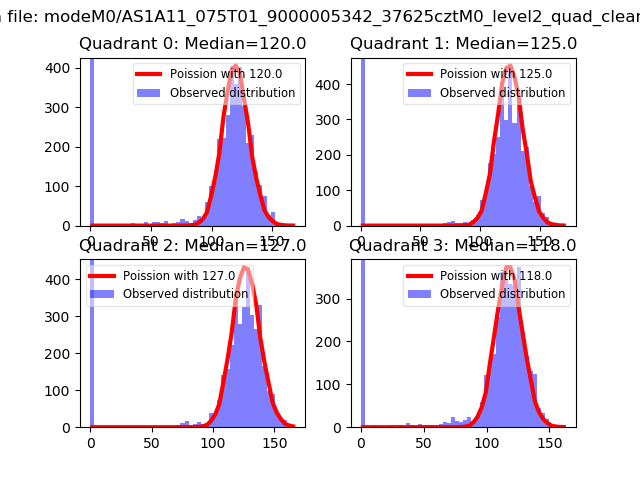 |
 |
| Quadrant-wise count rates Data is divided into 100 sec bins |
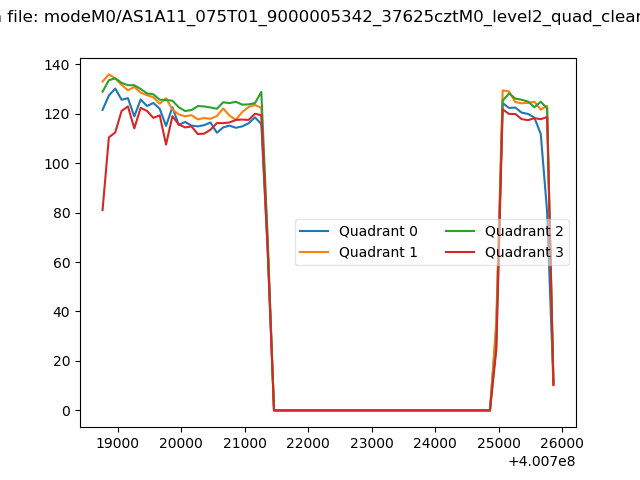 |
|
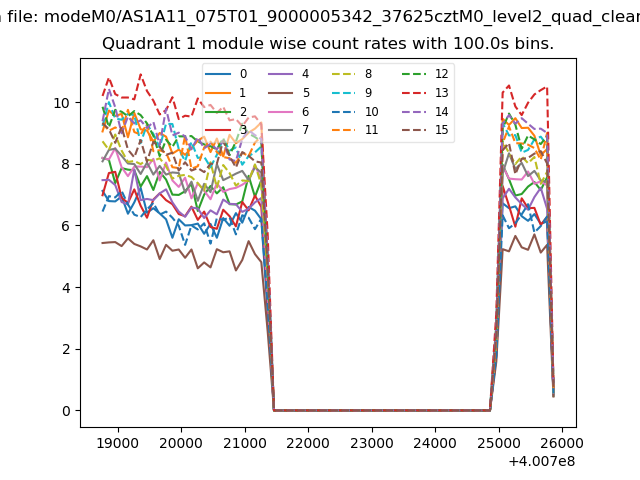
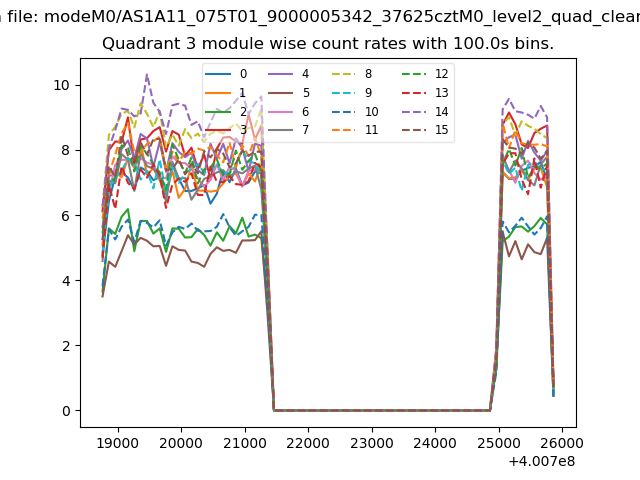
| Module-wise count rates for Quadrant A Data is divided into 100 sec bins |
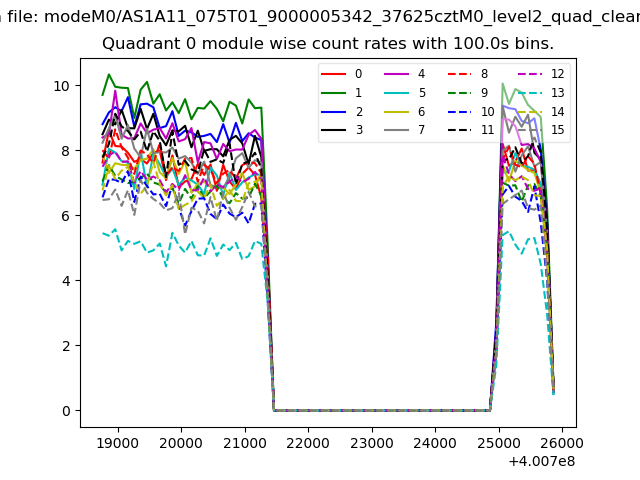 |
 |
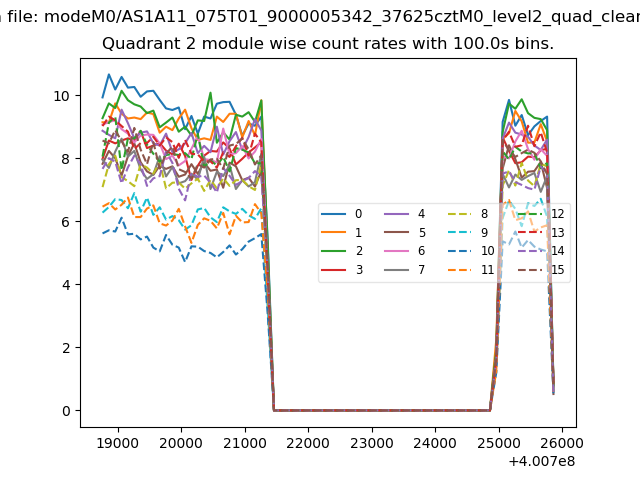
| Module-wise count rates for Quadrant B Data is divided into 100 sec bins |
 |
 |
| Module-wise count rates for Quadrant C Data is divided into 100 sec bins |
 |
 |
| Module-wise count rates for Quadrant D Data is divided into 100 sec bins |
 |
 |
| Parameter | Plot |
|---|---|
| CZT HV Monitor | 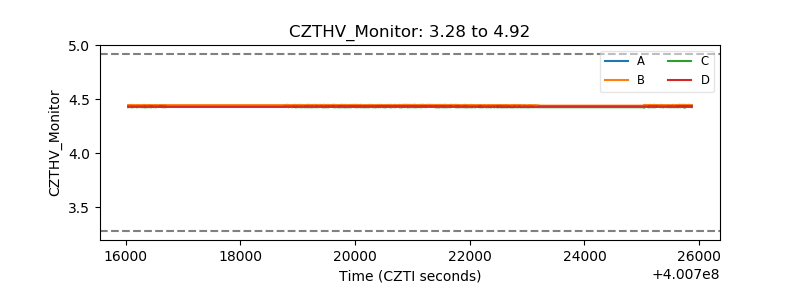 |
| D_VDD | 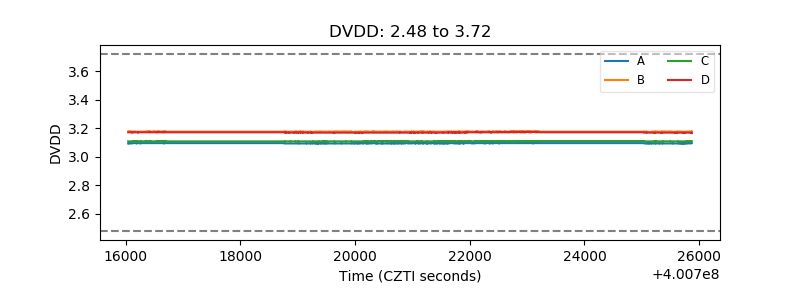 |
| Temperature 1 | 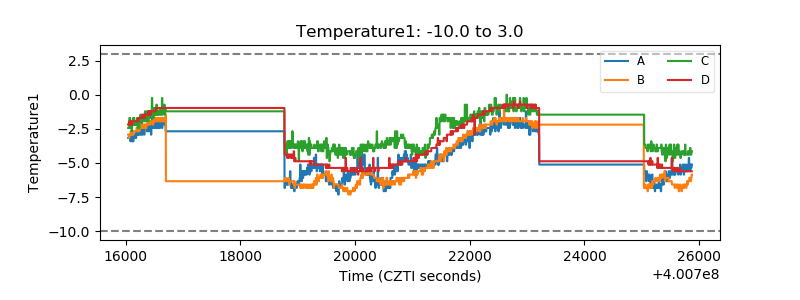 |
| Veto HV Monitor | 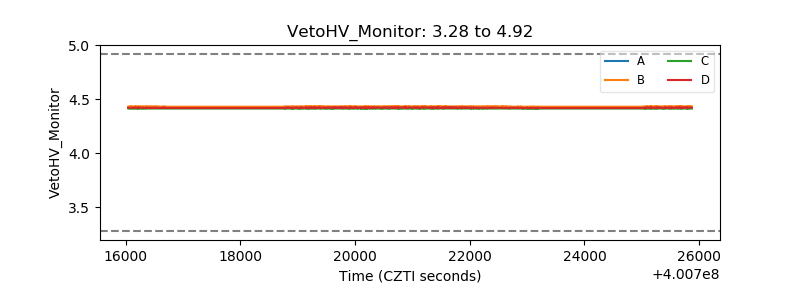 |
| Veto LLD | 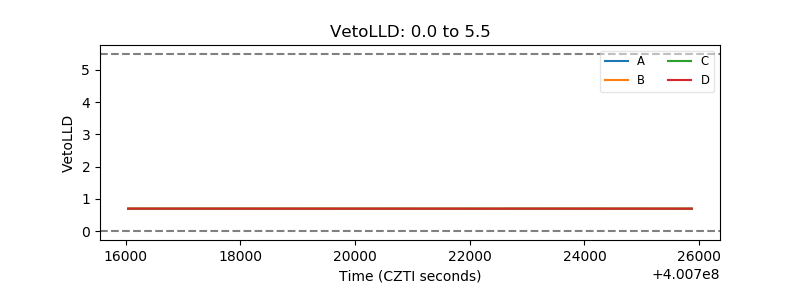 |
| Alpha Counter | 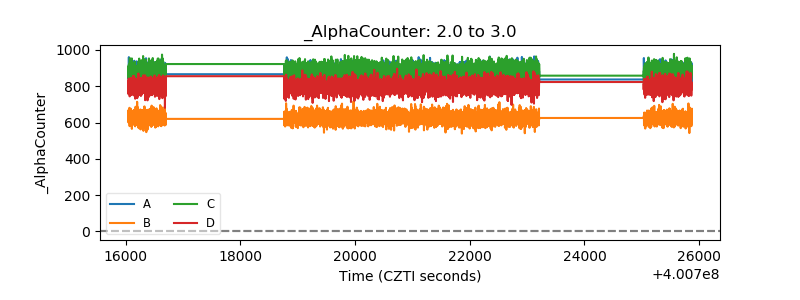 |
| _CPM_Rate | 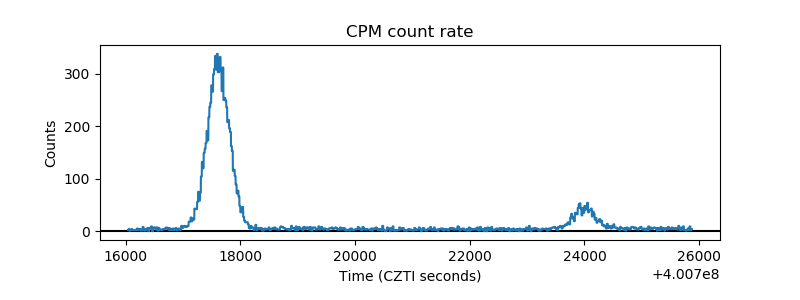 |
| CZT Counter | 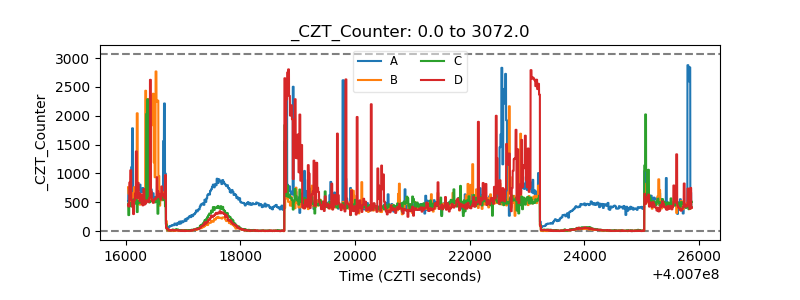 |
| +2.5 Volts monitor | 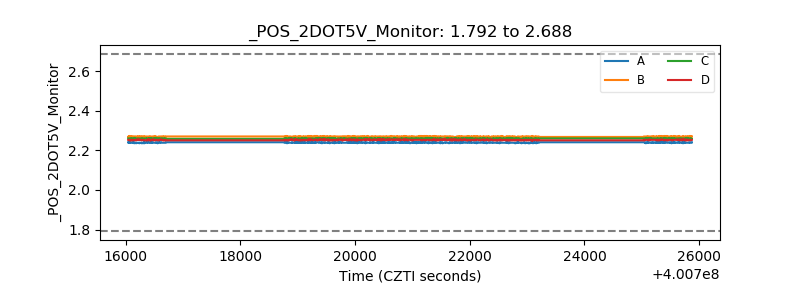 |
| +5 Volts monitor | 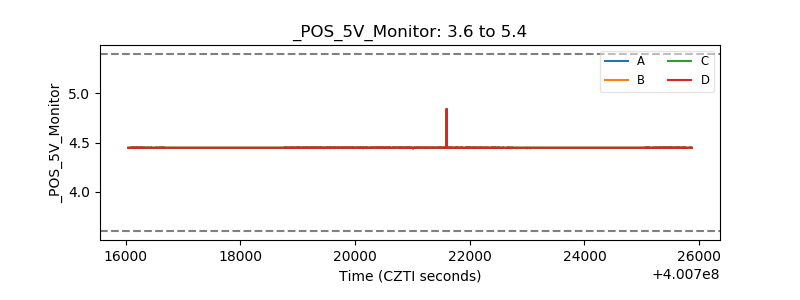 |
| _ROLL_ROT | 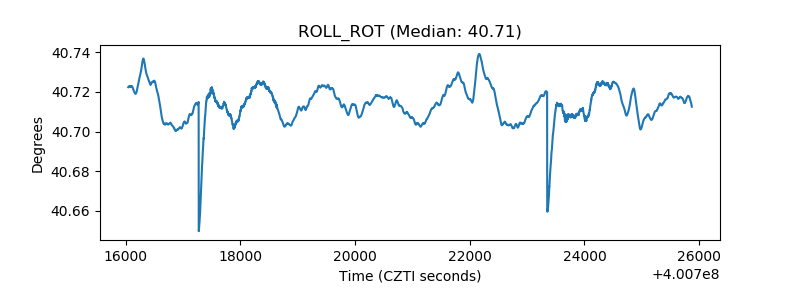 |
| _Roll_DEC | 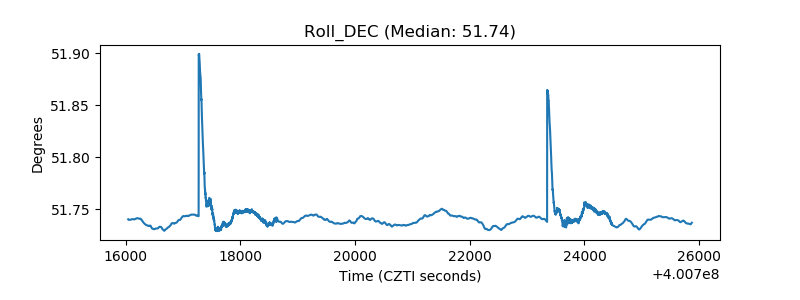 |
| _Roll_RA | 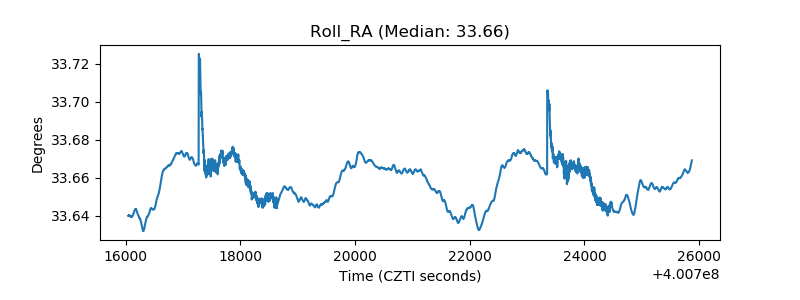 |
| Veto Counter | 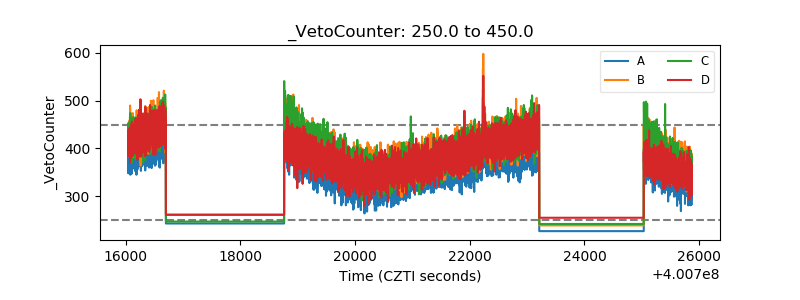 |