| Param | Original file | Final file |
|---|---|---|
| Filename | modeM0/AS1A11_075T01_9000005342_37626cztM0_level2.evt | modeM0/AS1A11_075T01_9000005342_37626cztM0_level2_quad_clean.evt |
| Size (bytes) | 626,198,400 | 68,993,280 |
| Size | 597.2 MB | 65.8 MB |
| Events in quadrant A | 7,864,064 | 402,195 |
| Events in quadrant B | 3,148,805 | 444,562 |
| Events in quadrant C | 2,853,503 | 450,067 |
| Events in quadrant D | 4,709,226 | 389,761 |
| Mode SS | |||
|---|---|---|---|
| Quadrant | BADHDUFLAG | Total packets | Discarded packets |
| A | 0 | 118 | 0 |
| B | 0 | 118 | 0 |
| C | 0 | 118 | 0 |
| D | 0 | 118 | 0 |
| Mode M0 | |||
|---|---|---|---|
| Quadrant | BADHDUFLAG | Total packets | Discarded packets |
| A | 0 | 27342 | 3 |
| B | 0 | 13230 | 2 |
| C | 0 | 12059 | 2 |
| D | 0 | 18291 | 2 |
| Mode M9 | |||
|---|---|---|---|
| Quadrant | BADHDUFLAG | Total packets | Discarded packets |
| A | 0 | 34 | 0 |
| B | 0 | 34 | 0 |
| C | 0 | 34 | 0 |
| D | 0 | 34 | 0 |
| Quadrant | Total seconds | Saturated seconds | Saturation percentage |
|---|---|---|---|
| A | 5750 | 1428 | 24.834783% |
| B | 5750 | 83 | 1.443478% |
| C | 5750 | 26 | 0.452174% |
| D | 5750 | 826 | 14.365217% |
Noise dominated data is calculated using 1-second bins in cleaned event files. If a bin has >2000 counts, and if more than 50% of those come from <1% of pixels, then it is considered to be noise-dominated and hence unusable.
| Quadrant | # 1 sec bins | Bins with >0 counts | Bins with >2000 counts | High rate bins dominated by noise | Noise dominated (total time) | Noise dominated (detector-on time) | Marked lightcurve |
|---|---|---|---|---|---|---|---|
| A | 9066 | 5752 | 1314 | 1314 | 14.49% | 22.84% | 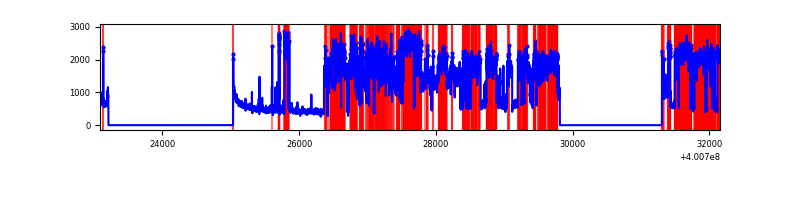 |
| B | 9066 | 5750 | 46 | 46 | 0.51% | 0.80% | 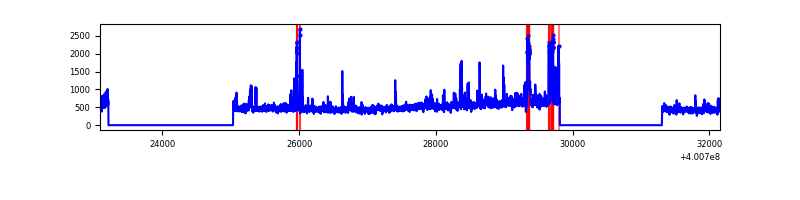 |
| C | 9066 | 5750 | 27 | 27 | 0.30% | 0.47% | 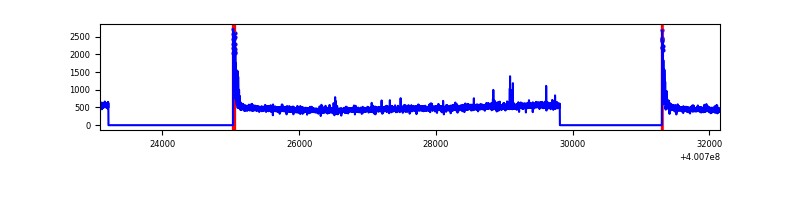 |
| D | 9066 | 5751 | 755 | 755 | 8.33% | 13.13% | 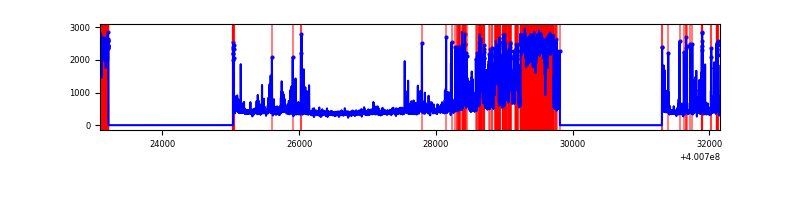 |
Top three noisy pixels from each quadrant. If the there are fewer than three noisy pixels in the level2.evt file, extra rows are filled as -1
| Pixel properties | Quadrant properties | ||||||
|---|---|---|---|---|---|---|---|
| Quadrant | DetID | PixID | Counts | Sigma | Mean | Median | Sigma |
| A | 15 | 222 | 5125336 | 41929.83 | 603 | 590 | 122.2 |
| A | 10 | 83 | 315574 | 2577.15 | 603 | 590 | 122.2 |
| A | 9 | 143 | 48131 | 388.97 | 603 | 590 | 122.2 |
| B | 5 | 172 | 231452 | 1847.83 | 641 | 624 | 124.9 |
| B | 4 | 80 | 191195 | 1525.57 | 641 | 624 | 124.9 |
| B | 0 | 230 | 37655 | 296.44 | 641 | 624 | 124.9 |
| C | 15 | 214 | 264615 | 1799.63 | 628 | 630 | 146.7 |
| C | 0 | 10 | 122207 | 828.81 | 628 | 630 | 146.7 |
| C | 14 | 254 | 13562 | 88.16 | 628 | 630 | 146.7 |
| D | 12 | 233 | 1616013 | 11655.7 | 573 | 555 | 138.6 |
| D | 2 | 249 | 319590 | 2301.87 | 573 | 555 | 138.6 |
| D | 2 | 250 | 139799 | 1004.66 | 573 | 555 | 138.6 |
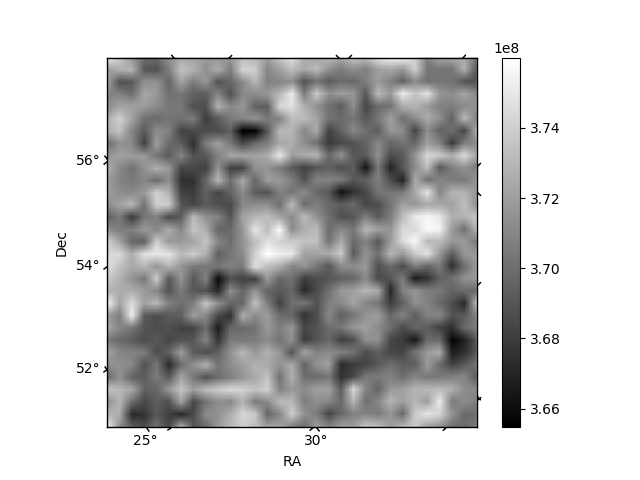
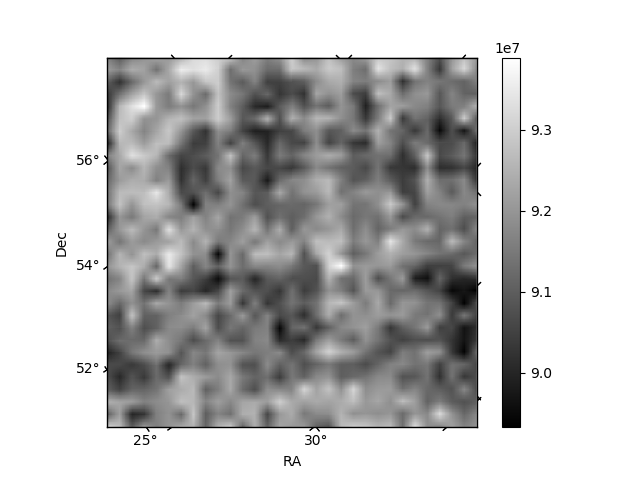
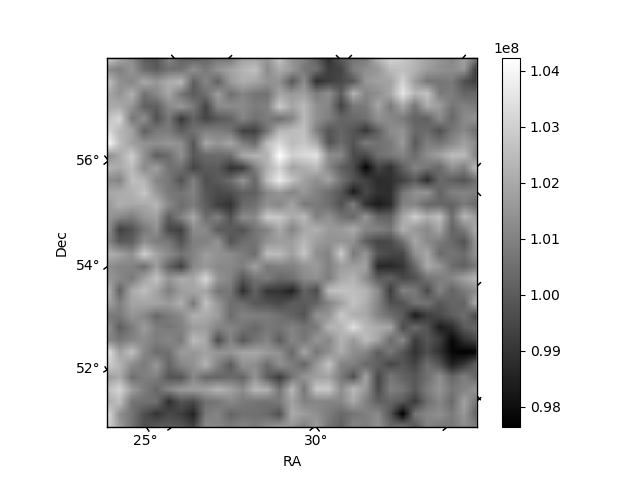
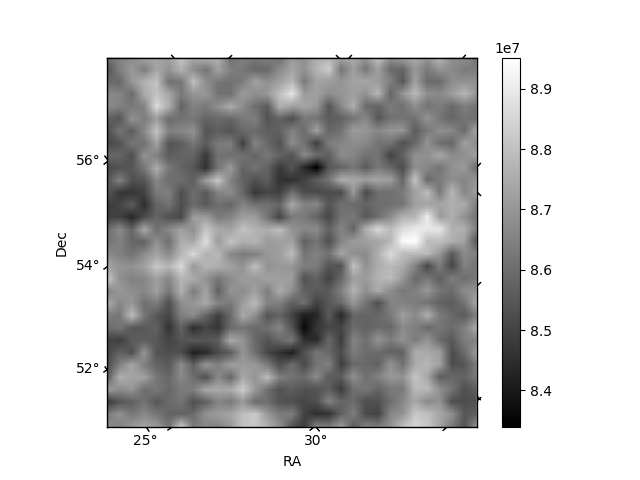
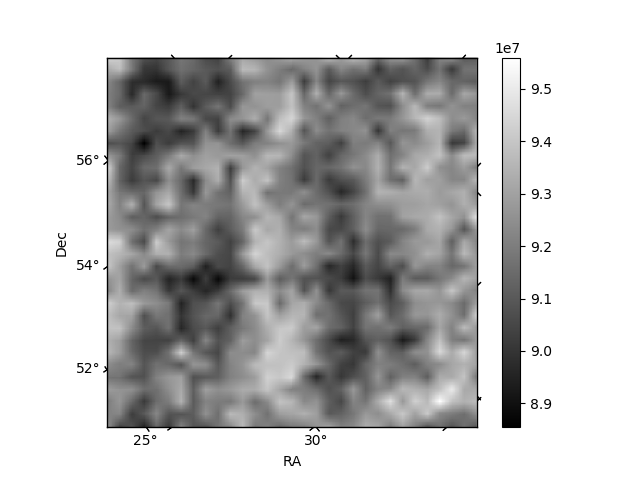
Histogram calculated using DETX and DETY for each event in the final _common_clean file
| Quadrant A | 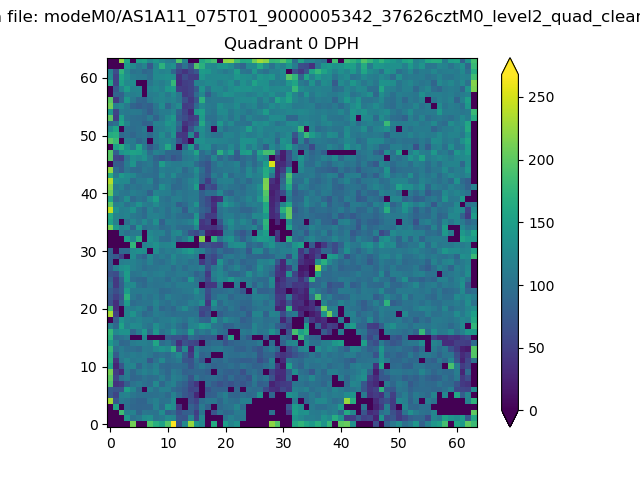 |
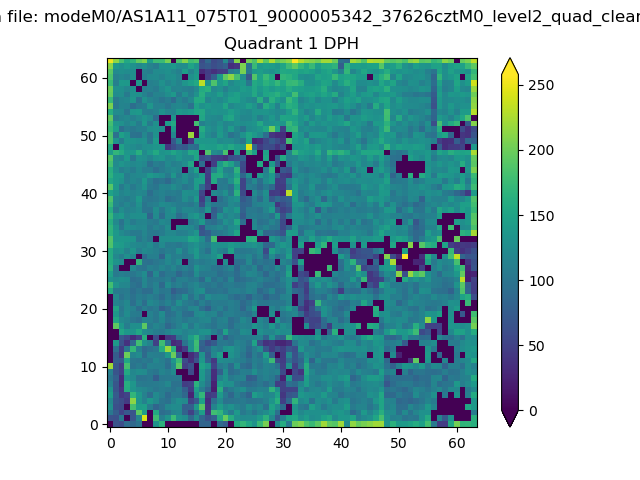 |
Quadrant B |
|---|---|---|---|
| Quadrant D | 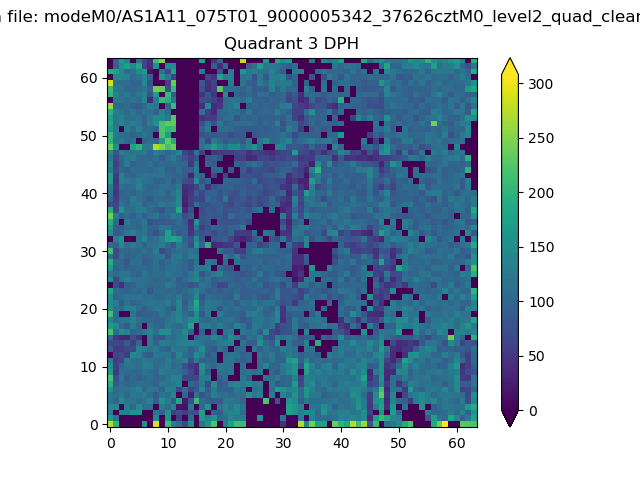 |
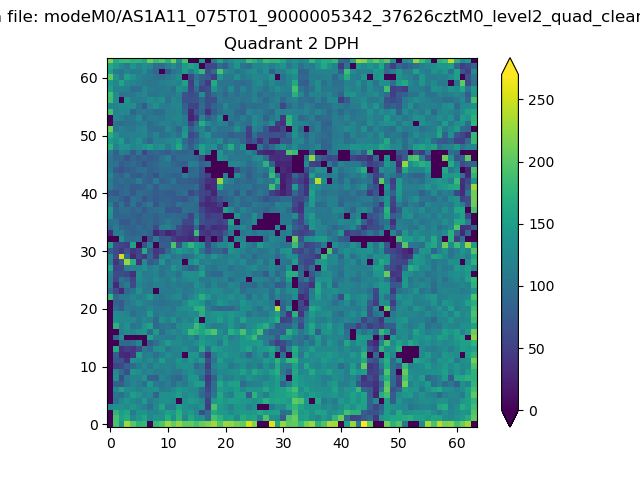 |
Quadrant C |
| Plot type | Count rate plots | Images |
|---|---|---|
| Comparison with Poisson distribution Blue bars denote a histogram of data divided into 1 sec bins. Red curve is a Poisson curve with rate = median count rate of data. |
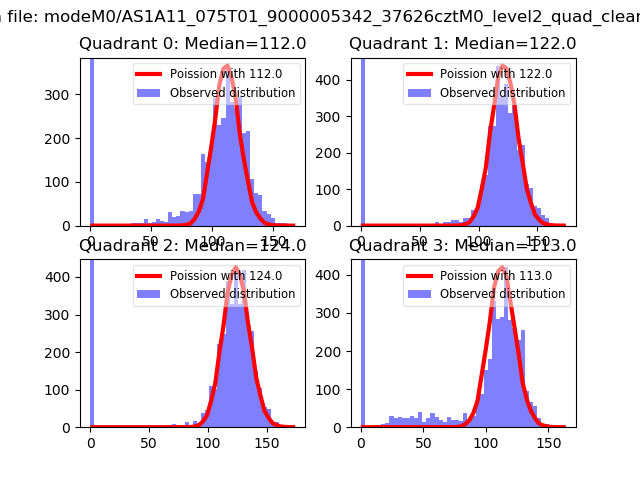 |
 |
| Quadrant-wise count rates Data is divided into 100 sec bins |
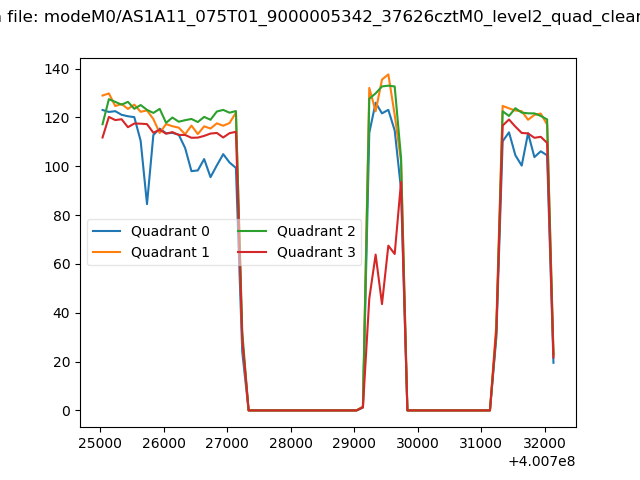 |
|
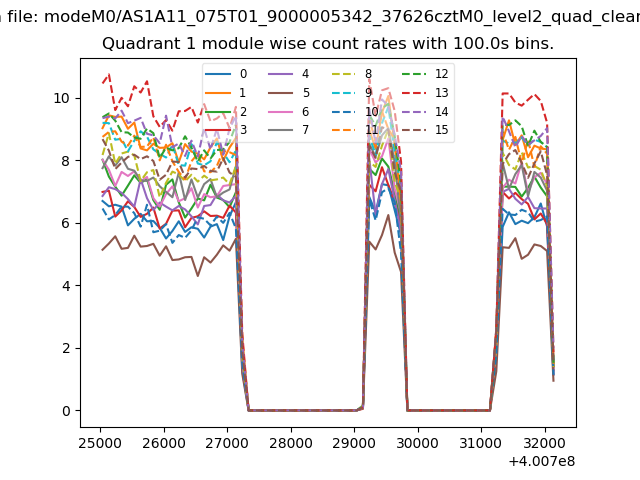
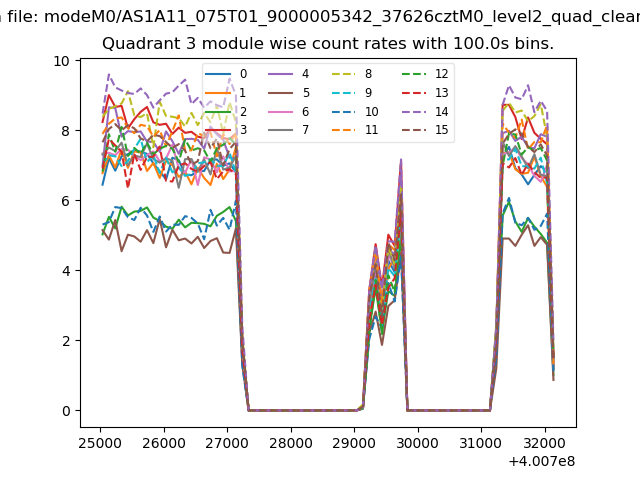
| Module-wise count rates for Quadrant A Data is divided into 100 sec bins |
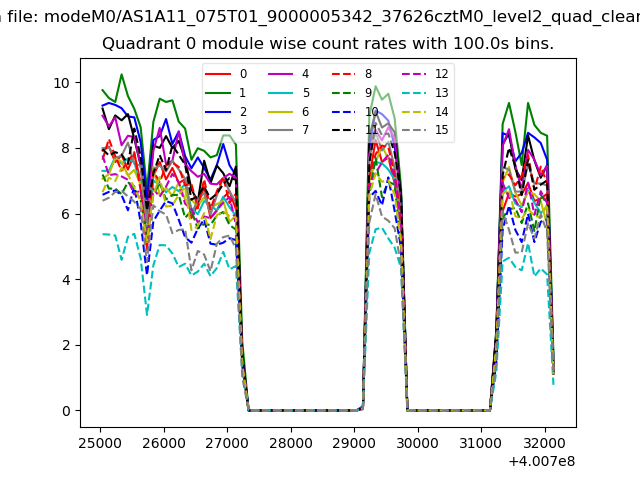 |
 |
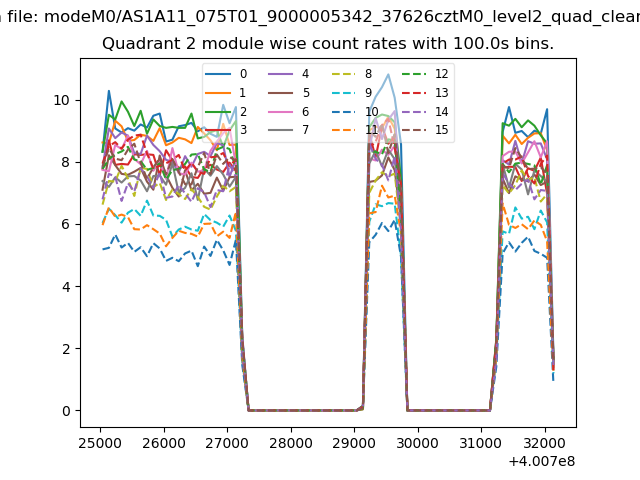
| Module-wise count rates for Quadrant B Data is divided into 100 sec bins |
 |
 |
| Module-wise count rates for Quadrant C Data is divided into 100 sec bins |
 |
 |
| Module-wise count rates for Quadrant D Data is divided into 100 sec bins |
 |
 |
| Parameter | Plot |
|---|---|
| CZT HV Monitor | 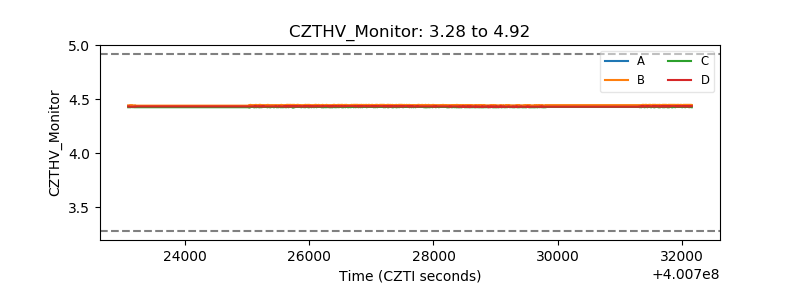 |
| D_VDD | 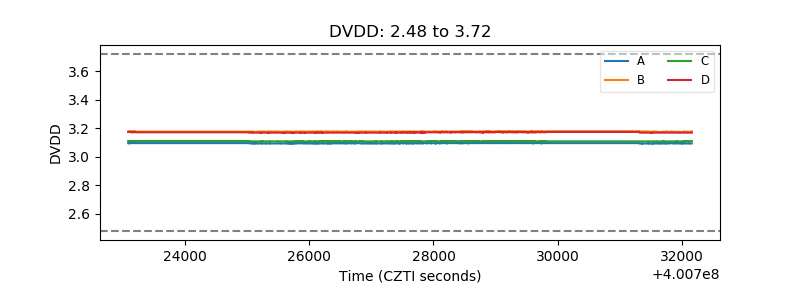 |
| Temperature 1 | 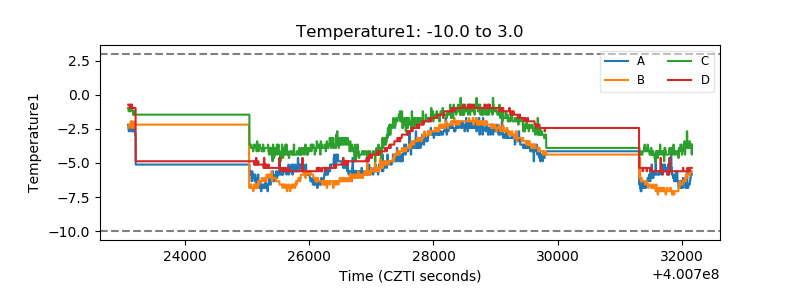 |
| Veto HV Monitor | 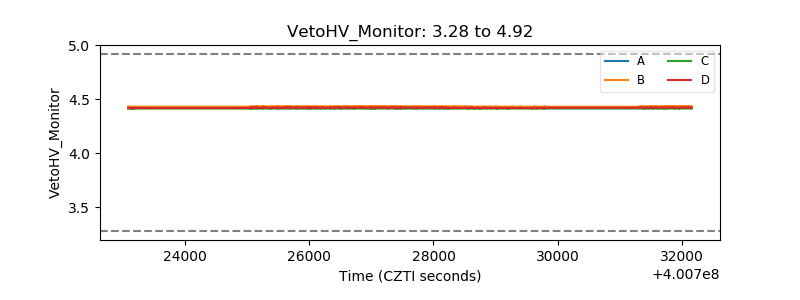 |
| Veto LLD | 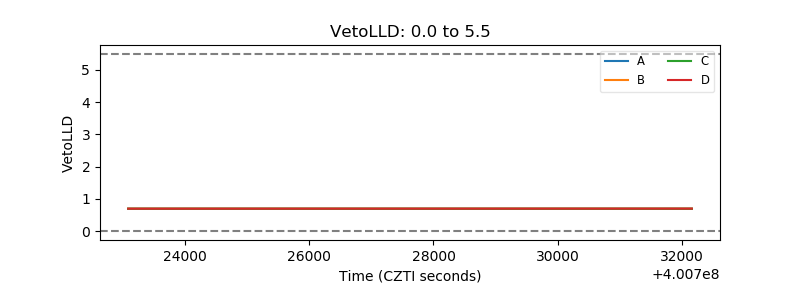 |
| Alpha Counter | 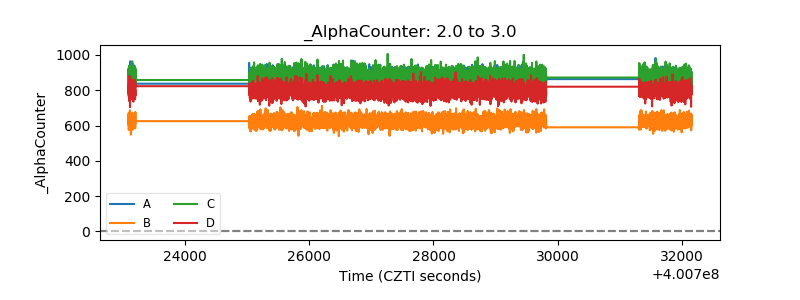 |
| _CPM_Rate | 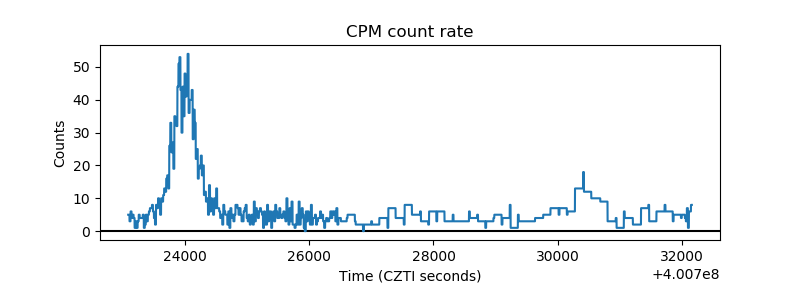 |
| CZT Counter | 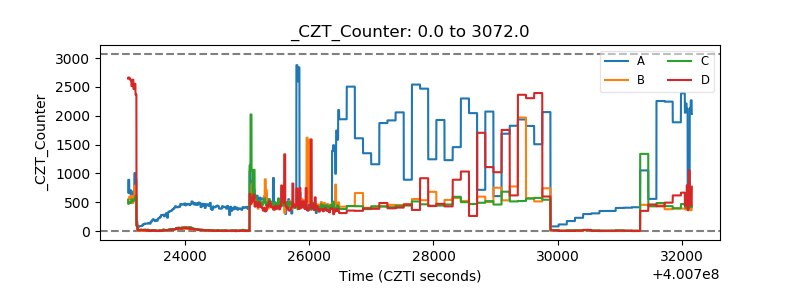 |
| +2.5 Volts monitor | 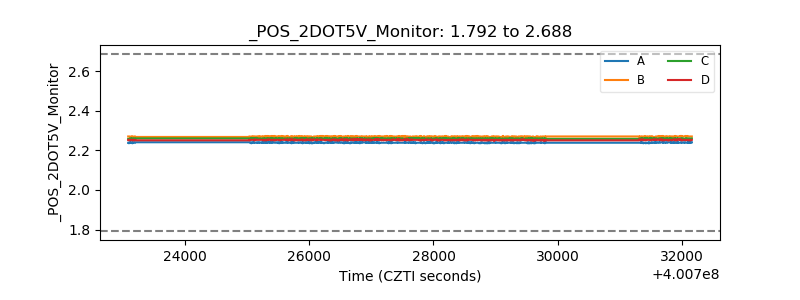 |
| +5 Volts monitor | 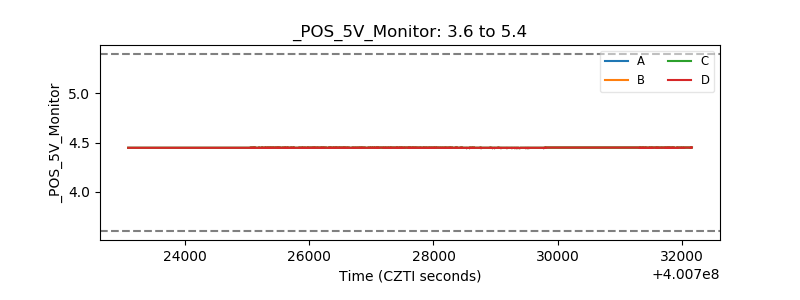 |
| _ROLL_ROT | 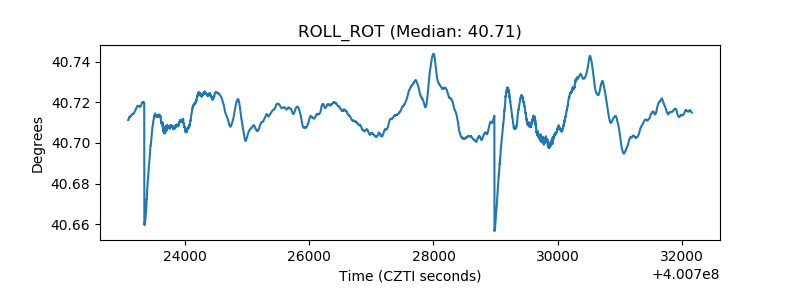 |
| _Roll_DEC | 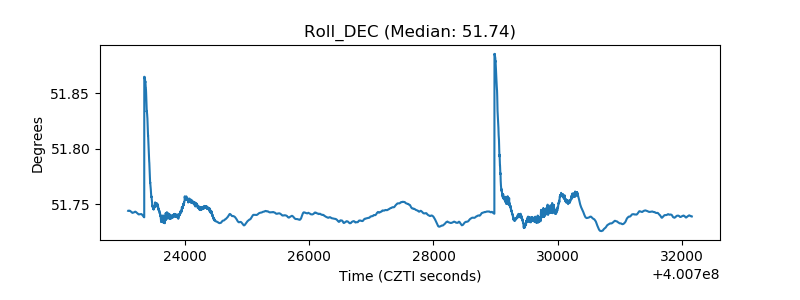 |
| _Roll_RA | 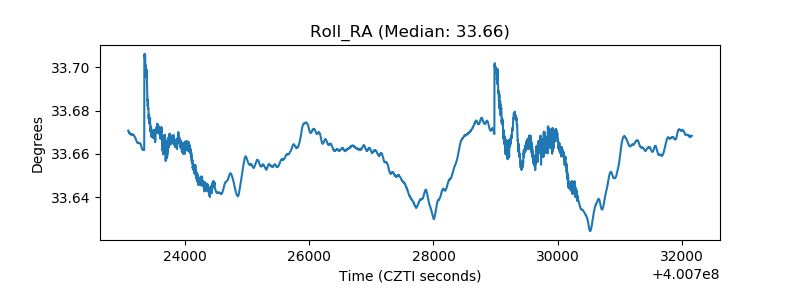 |
| Veto Counter | 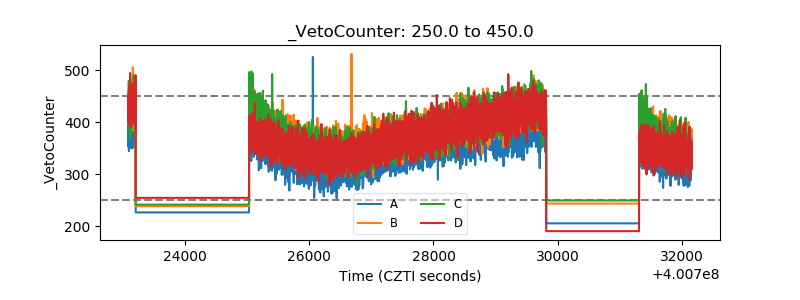 |