| Param | Original file | Final file |
|---|---|---|
| Filename | modeM0/AS1A11_075T01_9000005342_37627cztM0_level2.evt | modeM0/AS1A11_075T01_9000005342_37627cztM0_level2_quad_clean.evt |
| Size (bytes) | 659,332,800 | 83,736,000 |
| Size | 628.8 MB | 79.9 MB |
| Events in quadrant A | 7,222,372 | 512,886 |
| Events in quadrant B | 3,346,214 | 547,460 |
| Events in quadrant C | 3,198,944 | 551,736 |
| Events in quadrant D | 5,766,085 | 474,897 |
| Mode SS | |||
|---|---|---|---|
| Quadrant | BADHDUFLAG | Total packets | Discarded packets |
| A | 0 | 134 | 0 |
| B | 0 | 134 | 0 |
| C | 0 | 134 | 0 |
| D | 0 | 134 | 0 |
| Mode M0 | |||
|---|---|---|---|
| Quadrant | BADHDUFLAG | Total packets | Discarded packets |
| A | 0 | 25704 | 3 |
| B | 0 | 14346 | 2 |
| C | 0 | 13447 | 2 |
| D | 0 | 21694 | 2 |
| Mode M9 | |||
|---|---|---|---|
| Quadrant | BADHDUFLAG | Total packets | Discarded packets |
| A | 0 | 28 | 0 |
| B | 0 | 28 | 0 |
| C | 0 | 28 | 0 |
| D | 0 | 28 | 0 |
| Quadrant | Total seconds | Saturated seconds | Saturation percentage |
|---|---|---|---|
| A | 6419 | 970 | 15.111388% |
| B | 6419 | 93 | 1.448824% |
| C | 6419 | 20 | 0.311575% |
| D | 6419 | 843 | 13.132887% |
Noise dominated data is calculated using 1-second bins in cleaned event files. If a bin has >2000 counts, and if more than 50% of those come from <1% of pixels, then it is considered to be noise-dominated and hence unusable.
| Quadrant | # 1 sec bins | Bins with >0 counts | Bins with >2000 counts | High rate bins dominated by noise | Noise dominated (total time) | Noise dominated (detector-on time) | Marked lightcurve |
|---|---|---|---|---|---|---|---|
| A | 9254 | 6421 | 926 | 926 | 10.01% | 14.42% | 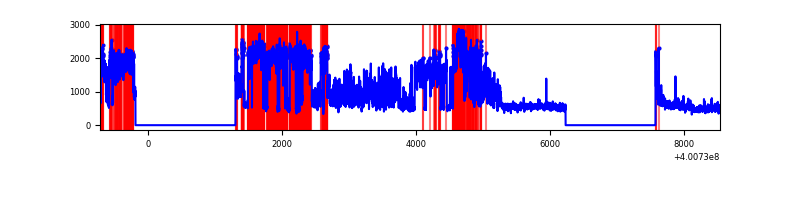 |
| B | 9254 | 6419 | 53 | 53 | 0.57% | 0.83% | 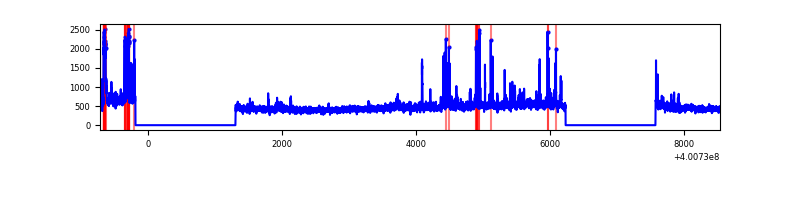 |
| C | 9254 | 6419 | 15 | 15 | 0.16% | 0.23% | 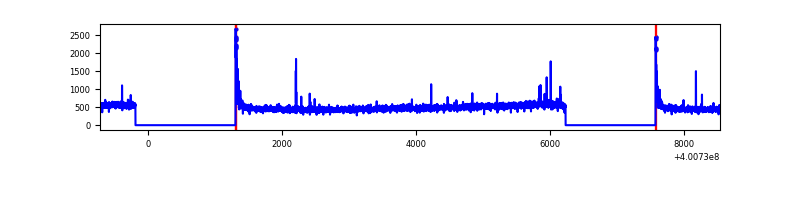 |
| D | 9254 | 6419 | 767 | 767 | 8.29% | 11.95% | 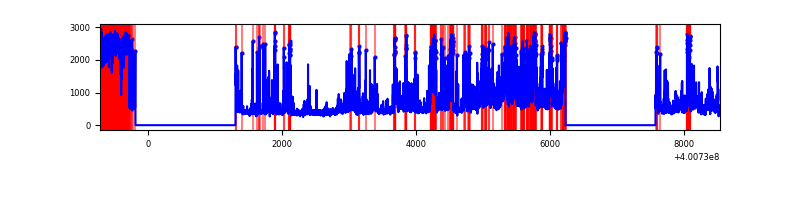 |
Top three noisy pixels from each quadrant. If the there are fewer than three noisy pixels in the level2.evt file, extra rows are filled as -1
| Pixel properties | Quadrant properties | ||||||
|---|---|---|---|---|---|---|---|
| Quadrant | DetID | PixID | Counts | Sigma | Mean | Median | Sigma |
| A | 15 | 222 | 4099336 | 28573.84 | 705 | 689 | 143.4 |
| A | 10 | 83 | 347725 | 2419.37 | 705 | 689 | 143.4 |
| A | 9 | 143 | 19725 | 132.71 | 705 | 689 | 143.4 |
| B | 5 | 172 | 222324 | 1591.74 | 724 | 704 | 139.2 |
| B | 15 | 85 | 83392 | 593.89 | 724 | 704 | 139.2 |
| B | 0 | 213 | 39681 | 279.94 | 724 | 704 | 139.2 |
| C | 15 | 214 | 295193 | 1776.25 | 714 | 717 | 165.8 |
| C | 0 | 10 | 87017 | 520.55 | 714 | 717 | 165.8 |
| C | 14 | 254 | 18158 | 105.2 | 714 | 717 | 165.8 |
| D | 12 | 233 | 1073406 | 6630.65 | 667 | 649 | 161.8 |
| D | 12 | 227 | 861589 | 5321.42 | 667 | 649 | 161.8 |
| D | 2 | 249 | 631943 | 3901.99 | 667 | 649 | 161.8 |
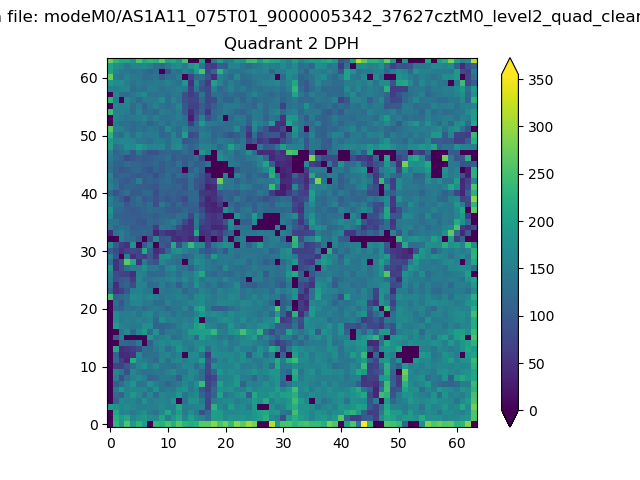
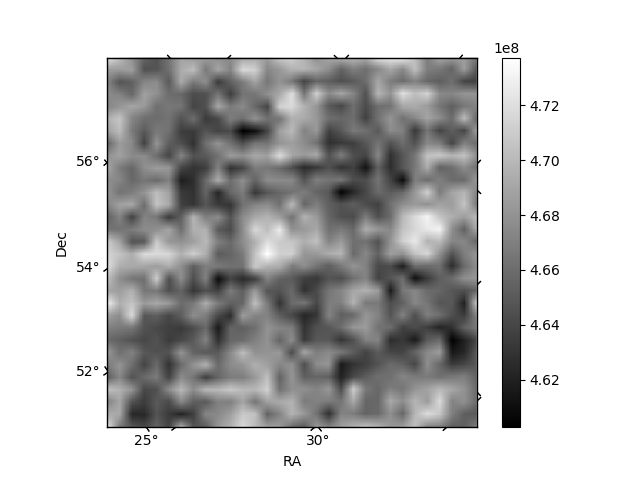
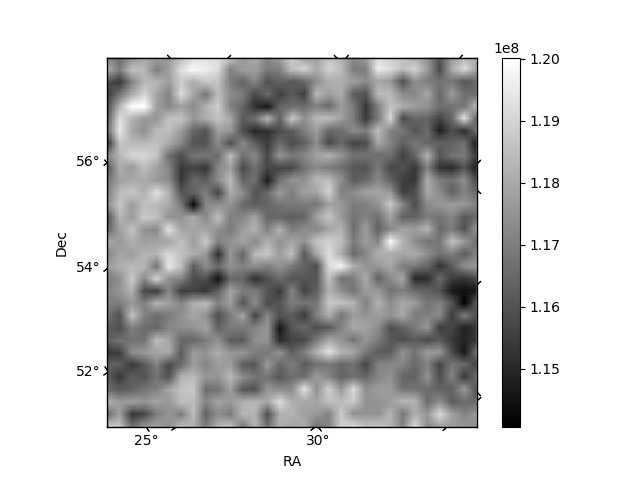
Histogram calculated using DETX and DETY for each event in the final _common_clean file
| Quadrant A | 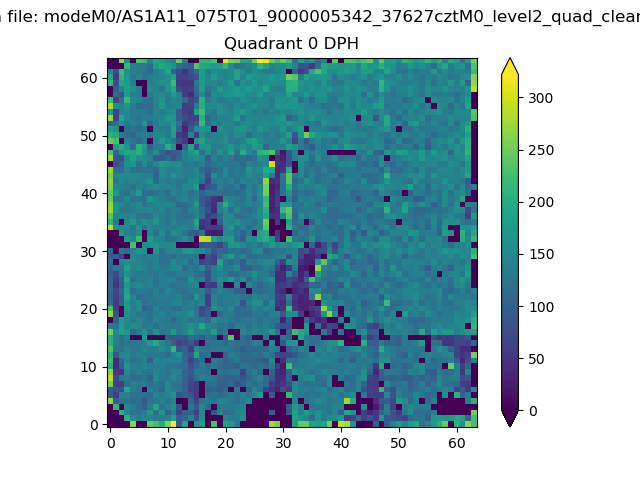 |
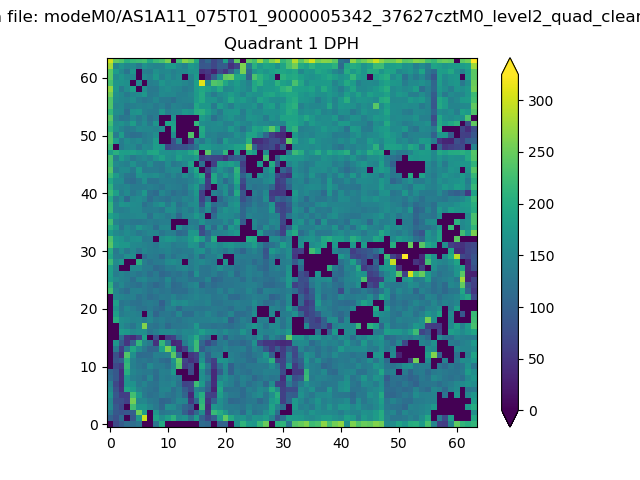 |
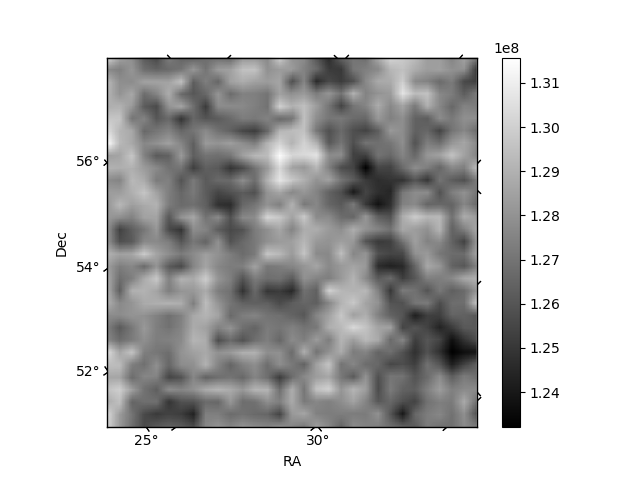
Quadrant B |
|---|---|---|---|
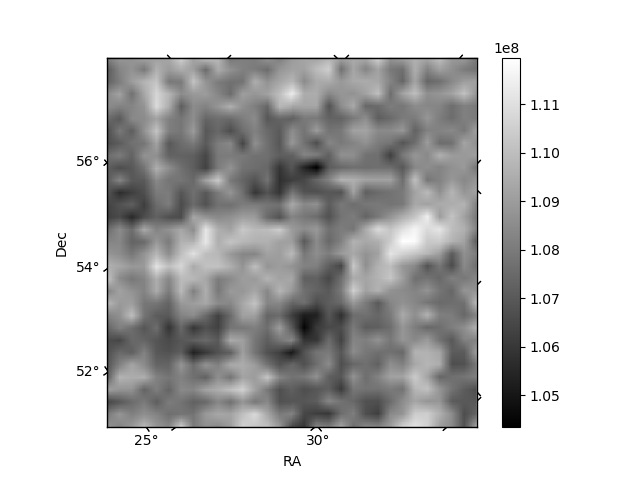
| Quadrant D | 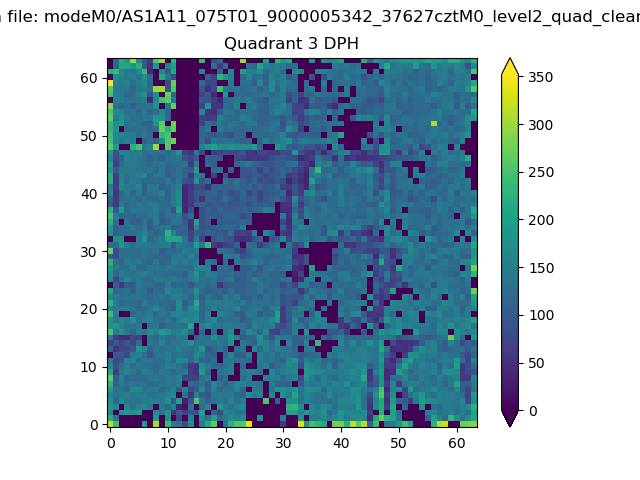 |
 |
Quadrant C |
| Plot type | Count rate plots | Images |
|---|---|---|
| Comparison with Poisson distribution Blue bars denote a histogram of data divided into 1 sec bins. Red curve is a Poisson curve with rate = median count rate of data. |
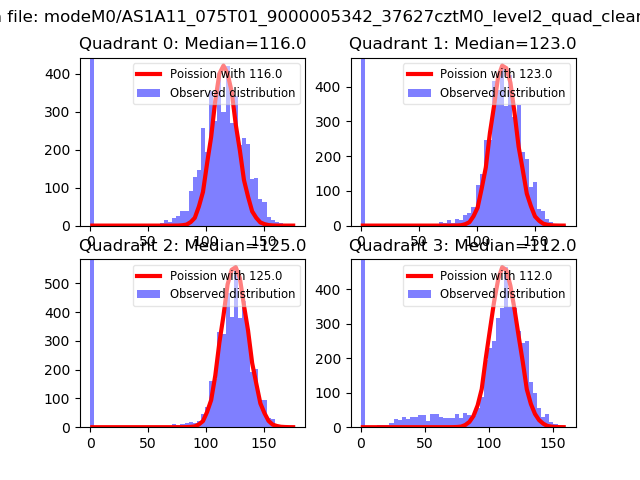 |
 |
| Quadrant-wise count rates Data is divided into 100 sec bins |
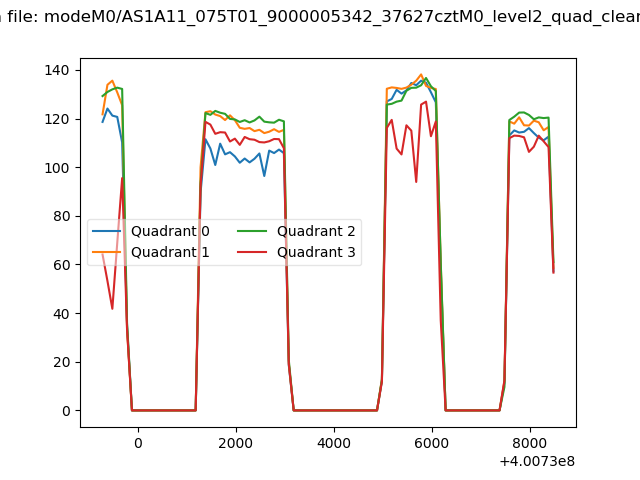 |
|
| Module-wise count rates for Quadrant A Data is divided into 100 sec bins |
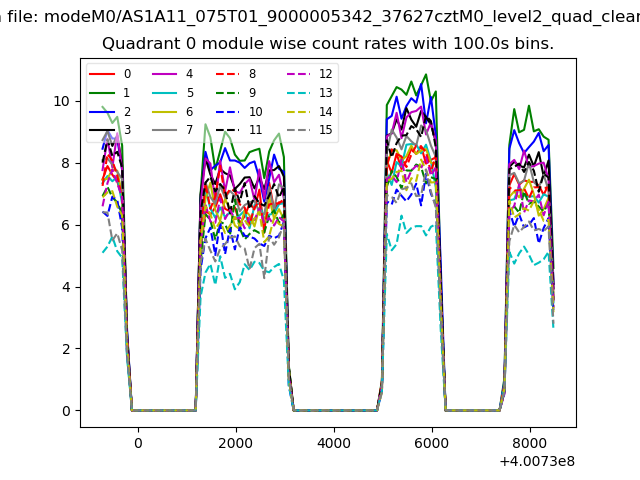 |
 |
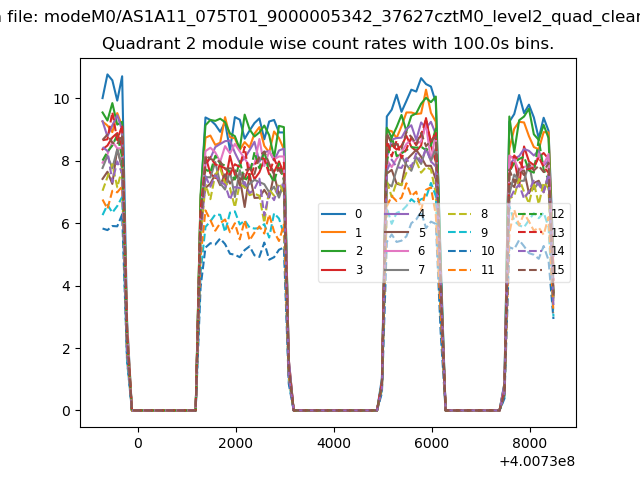
| Module-wise count rates for Quadrant B Data is divided into 100 sec bins |
 |
 |
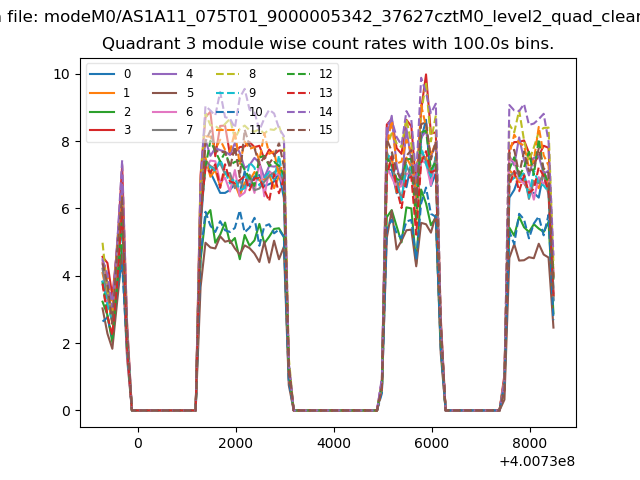
| Module-wise count rates for Quadrant C Data is divided into 100 sec bins |
 |
 |
| Module-wise count rates for Quadrant D Data is divided into 100 sec bins |
 |
 |
| Parameter | Plot |
|---|---|
| CZT HV Monitor | 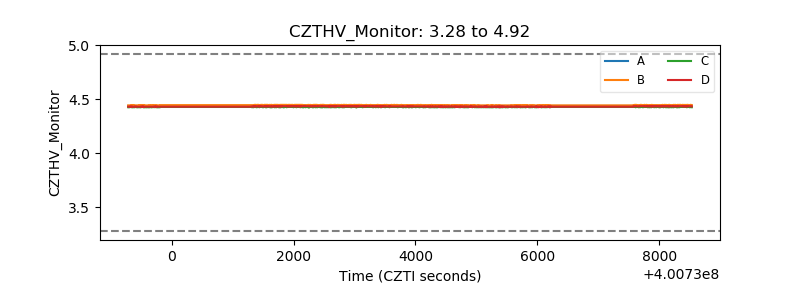 |
| D_VDD | 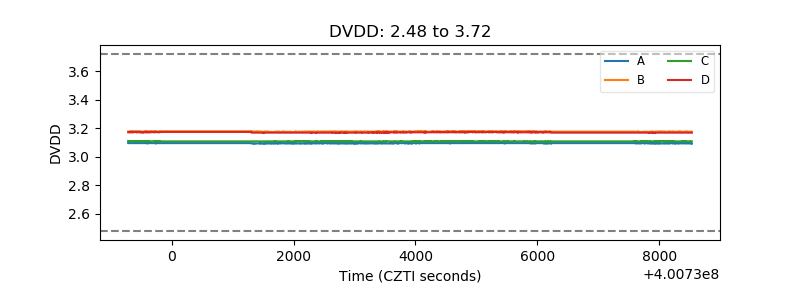 |
| Temperature 1 | 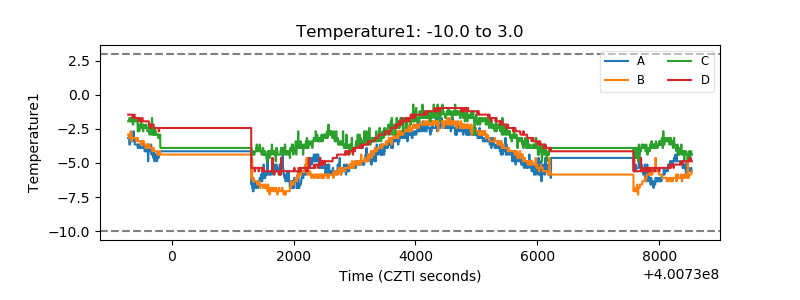 |
| Veto HV Monitor | 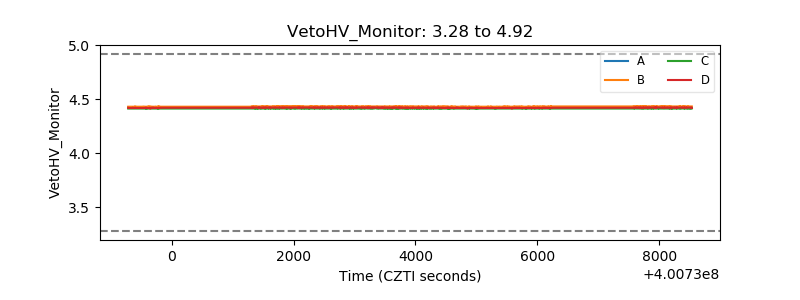 |
| Veto LLD | 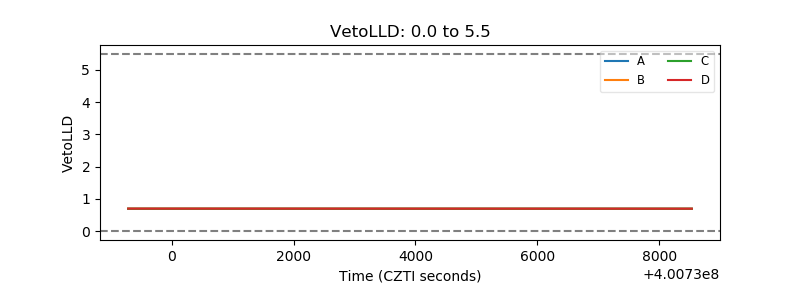 |
| Alpha Counter | 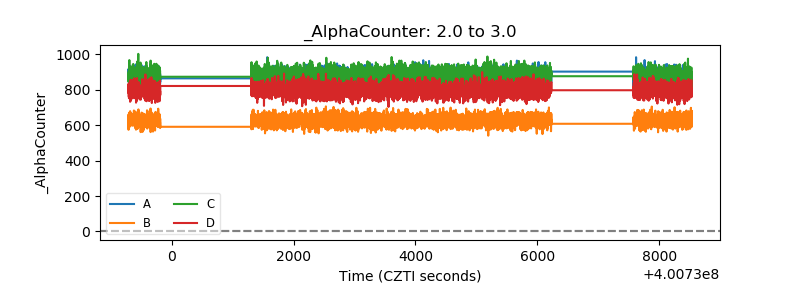 |
| _CPM_Rate | 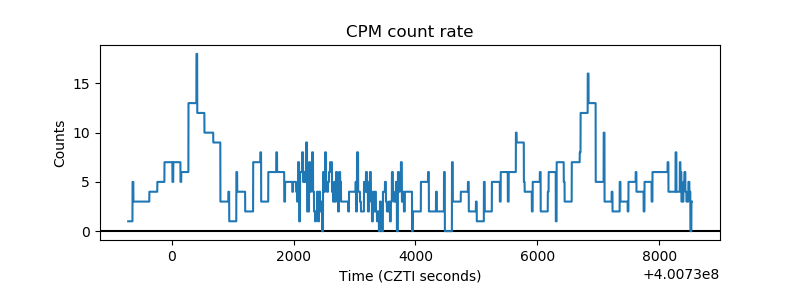 |
| CZT Counter | 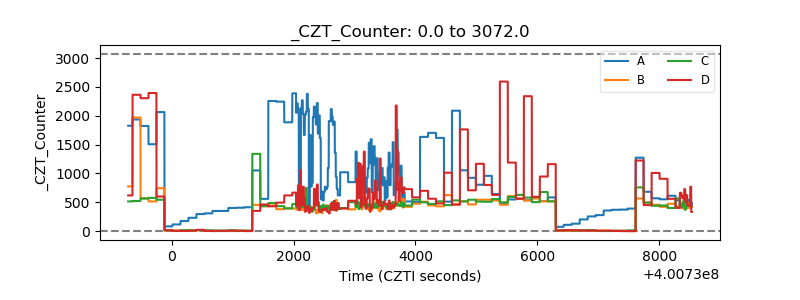 |
| +2.5 Volts monitor | 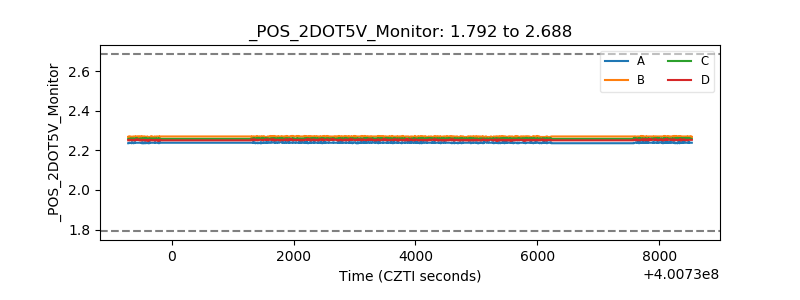 |
| +5 Volts monitor | 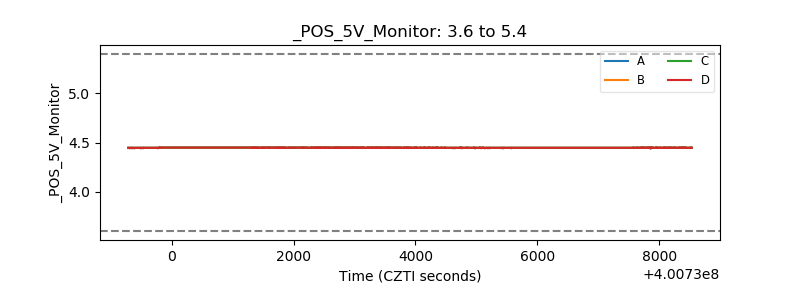 |
| _ROLL_ROT | 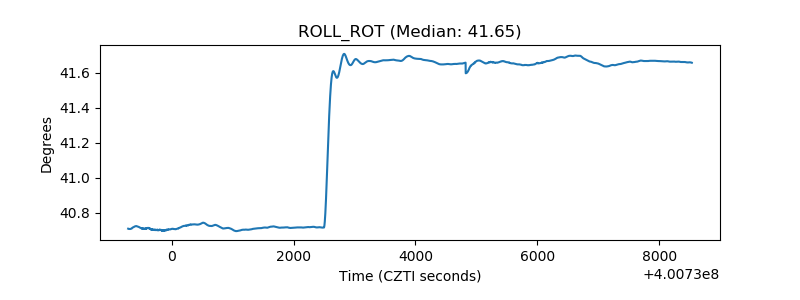 |
| _Roll_DEC | 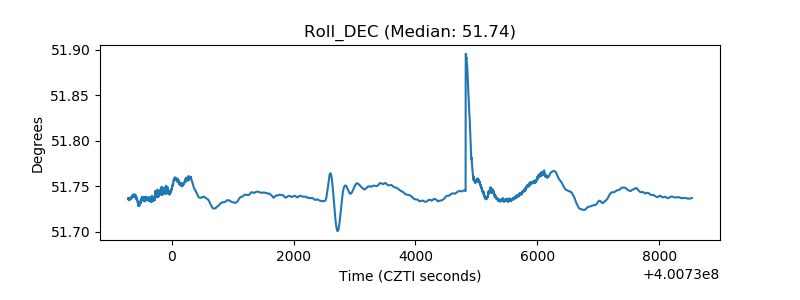 |
| _Roll_RA | 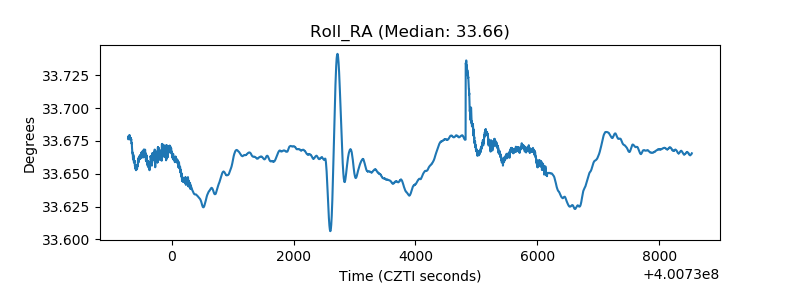 |
| Veto Counter | 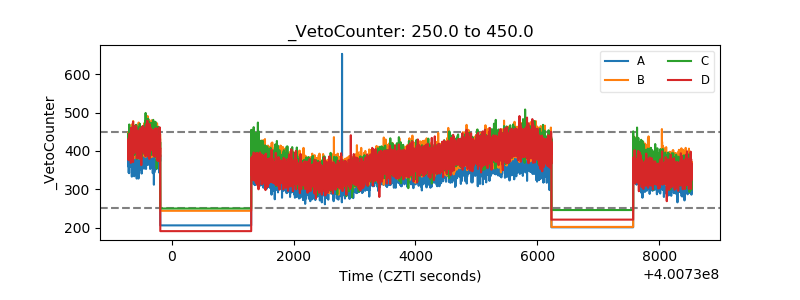 |