| Param | Original file | Final file |
|---|---|---|
| Filename | modeM0/AS1A11_075T01_9000005342_37628cztM0_level2.evt | modeM0/AS1A11_075T01_9000005342_37628cztM0_level2_quad_clean.evt |
| Size (bytes) | 529,770,240 | 75,781,440 |
| Size | 505.2 MB | 72.3 MB |
| Events in quadrant A | 3,849,355 | 466,546 |
| Events in quadrant B | 3,342,768 | 475,981 |
| Events in quadrant C | 2,942,211 | 488,193 |
| Events in quadrant D | 5,505,352 | 447,256 |
| Mode SS | |||
|---|---|---|---|
| Quadrant | BADHDUFLAG | Total packets | Discarded packets |
| A | 0 | 122 | 0 |
| B | 0 | 122 | 0 |
| C | 0 | 122 | 0 |
| D | 0 | 122 | 0 |
| Mode M0 | |||
|---|---|---|---|
| Quadrant | BADHDUFLAG | Total packets | Discarded packets |
| A | 0 | 15345 | 3 |
| B | 0 | 13795 | 2 |
| C | 0 | 12413 | 2 |
| D | 0 | 20510 | 2 |
| Mode M9 | |||
|---|---|---|---|
| Quadrant | BADHDUFLAG | Total packets | Discarded packets |
| A | 0 | 13 | 0 |
| B | 0 | 13 | 0 |
| C | 0 | 13 | 0 |
| D | 0 | 14 | 0 |
| Quadrant | Total seconds | Saturated seconds | Saturation percentage |
|---|---|---|---|
| A | 5963 | 53 | 0.888814% |
| B | 5963 | 146 | 2.448432% |
| C | 5963 | 11 | 0.184471% |
| D | 5963 | 846 | 14.187490% |
Noise dominated data is calculated using 1-second bins in cleaned event files. If a bin has >2000 counts, and if more than 50% of those come from <1% of pixels, then it is considered to be noise-dominated and hence unusable.
| Quadrant | # 1 sec bins | Bins with >0 counts | Bins with >2000 counts | High rate bins dominated by noise | Noise dominated (total time) | Noise dominated (detector-on time) | Marked lightcurve |
|---|---|---|---|---|---|---|---|
| A | 7276 | 5964 | 34 | 34 | 0.47% | 0.57% | 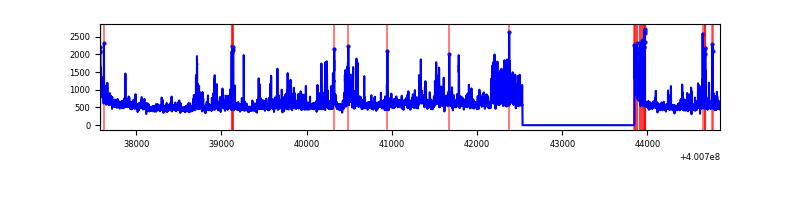 |
| B | 7275 | 5962 | 101 | 101 | 1.39% | 1.69% | 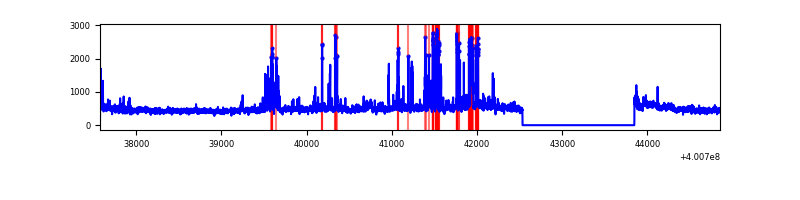 |
| C | 7275 | 5962 | 9 | 9 | 0.12% | 0.15% | 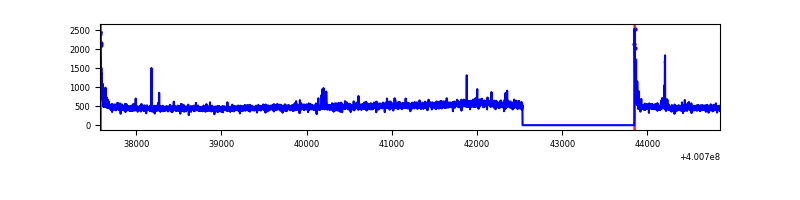 |
| D | 7275 | 5962 | 819 | 819 | 11.26% | 13.74% | 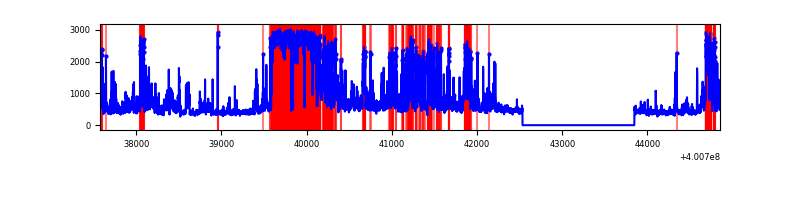 |
Top three noisy pixels from each quadrant. If the there are fewer than three noisy pixels in the level2.evt file, extra rows are filled as -1
| Pixel properties | Quadrant properties | ||||||
|---|---|---|---|---|---|---|---|
| Quadrant | DetID | PixID | Counts | Sigma | Mean | Median | Sigma |
| A | 15 | 222 | 816286 | 5984.96 | 670 | 656 | 136.3 |
| A | 10 | 83 | 333708 | 2443.88 | 670 | 656 | 136.3 |
| A | 9 | 143 | 63010 | 457.54 | 670 | 656 | 136.3 |
| B | 5 | 172 | 302874 | 2341.0 | 664 | 644 | 129.1 |
| B | 5 | 255 | 158208 | 1220.45 | 664 | 644 | 129.1 |
| B | 0 | 189 | 124359 | 958.26 | 664 | 644 | 129.1 |
| C | 15 | 214 | 273397 | 1775.7 | 658 | 661 | 153.6 |
| C | 0 | 10 | 67300 | 433.87 | 658 | 661 | 153.6 |
| C | 12 | 250 | 29614 | 188.5 | 658 | 661 | 153.6 |
| D | 12 | 227 | 2120671 | 14302.09 | 608 | 592 | 148.2 |
| D | 2 | 249 | 498280 | 3357.41 | 608 | 592 | 148.2 |
| D | 12 | 233 | 198015 | 1331.82 | 608 | 592 | 148.2 |
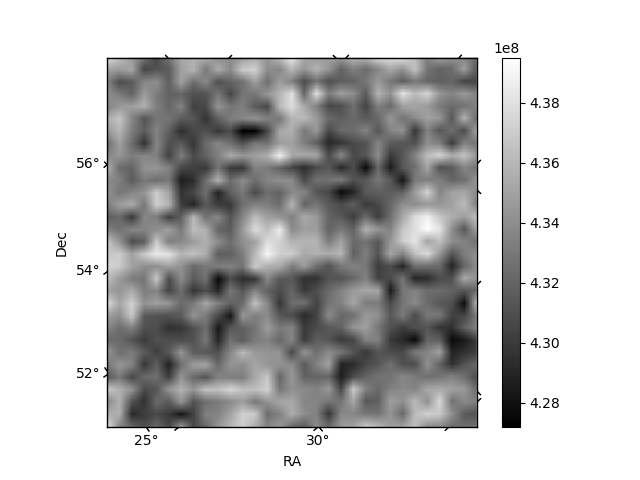
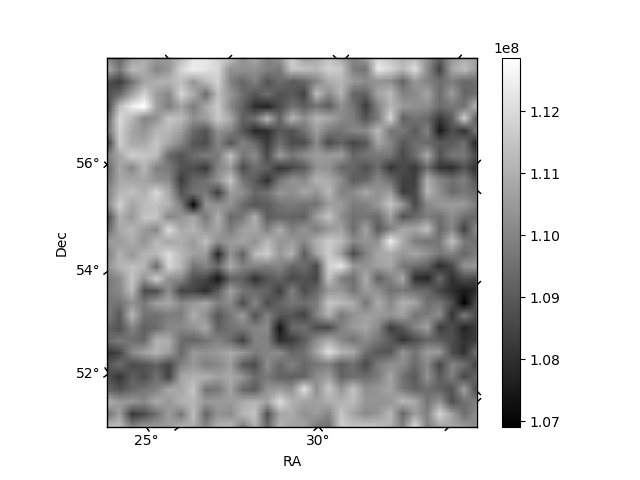
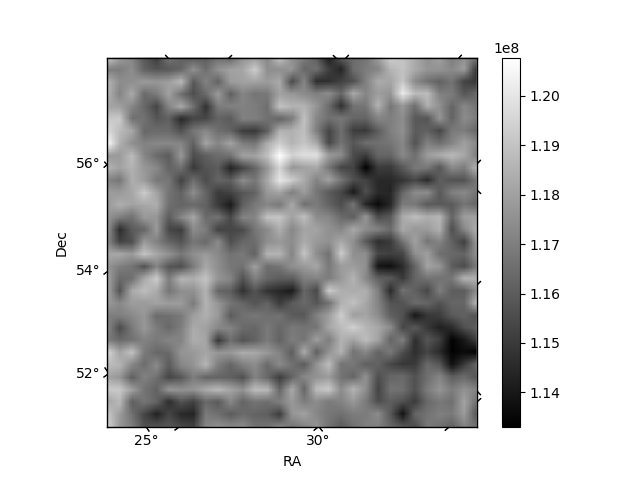
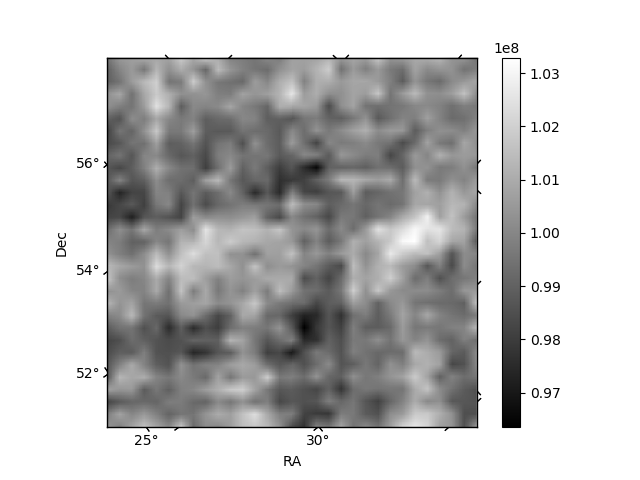
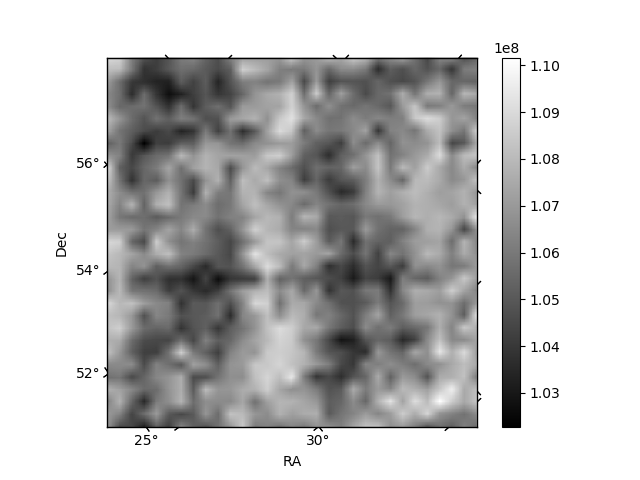
Histogram calculated using DETX and DETY for each event in the final _common_clean file
| Quadrant A | 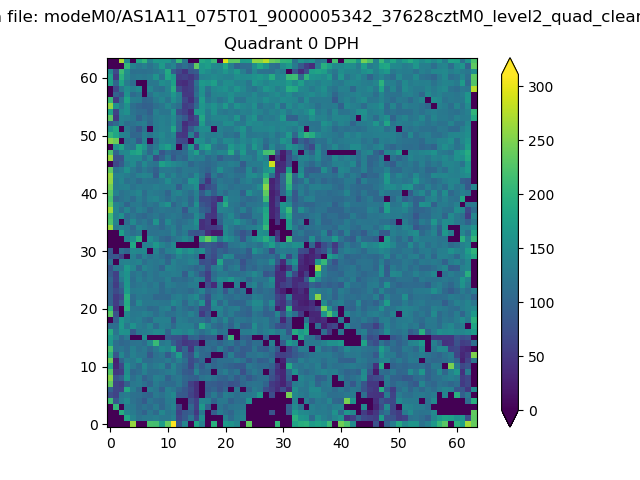 |
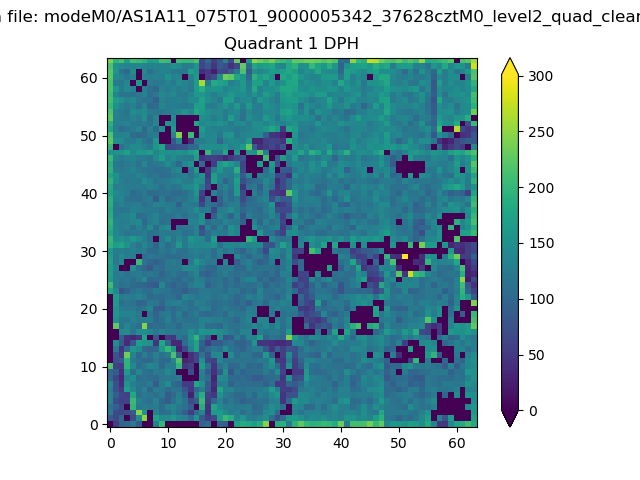 |
Quadrant B |
|---|---|---|---|
| Quadrant D | 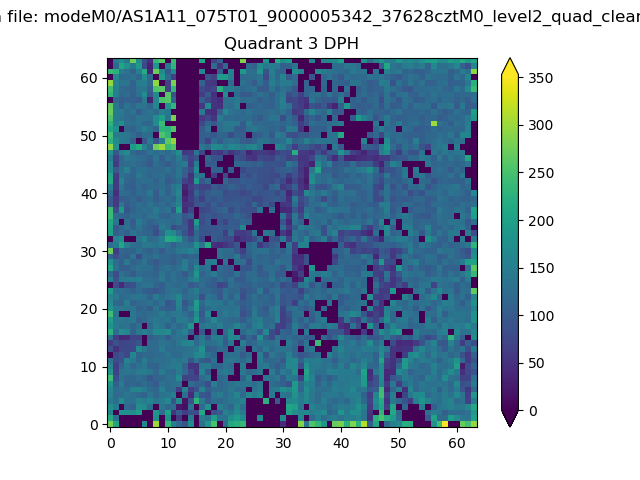 |
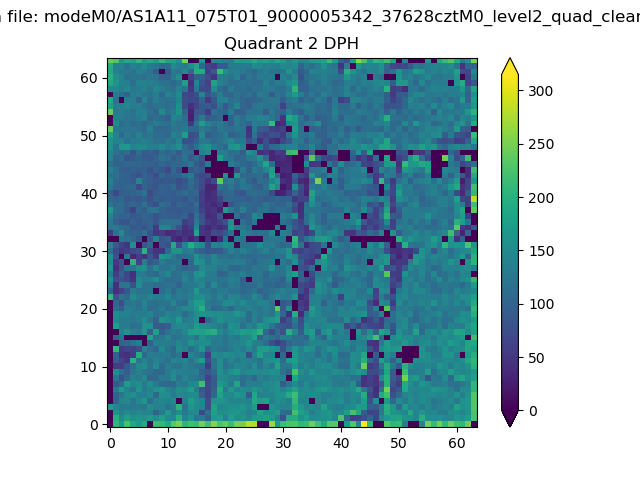 |
Quadrant C |
| Plot type | Count rate plots | Images |
|---|---|---|
| Comparison with Poisson distribution Blue bars denote a histogram of data divided into 1 sec bins. Red curve is a Poisson curve with rate = median count rate of data. |
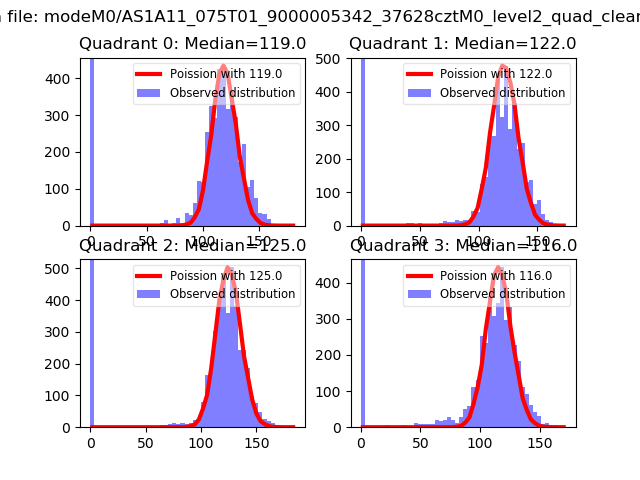 |
 |
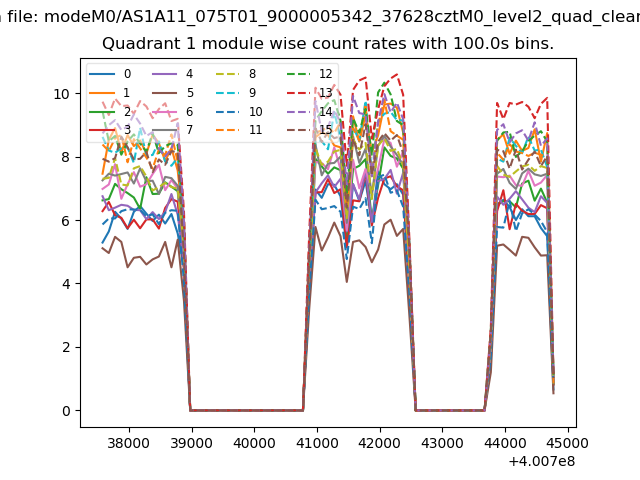
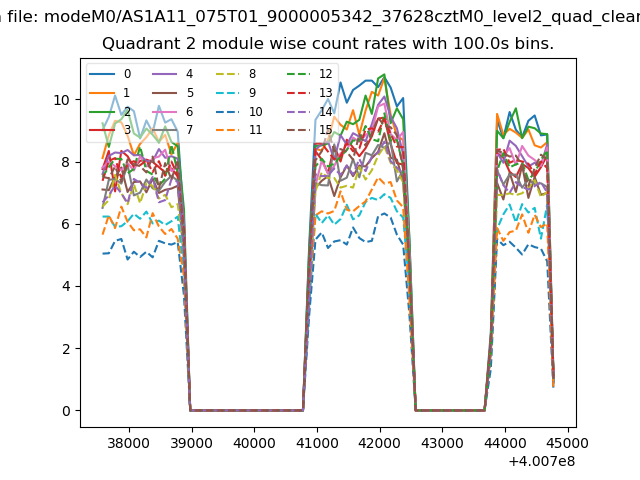
| Quadrant-wise count rates Data is divided into 100 sec bins |
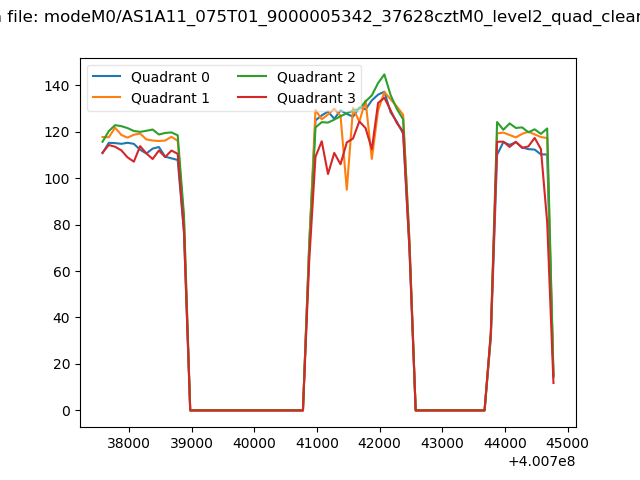 |
|
| Module-wise count rates for Quadrant A Data is divided into 100 sec bins |
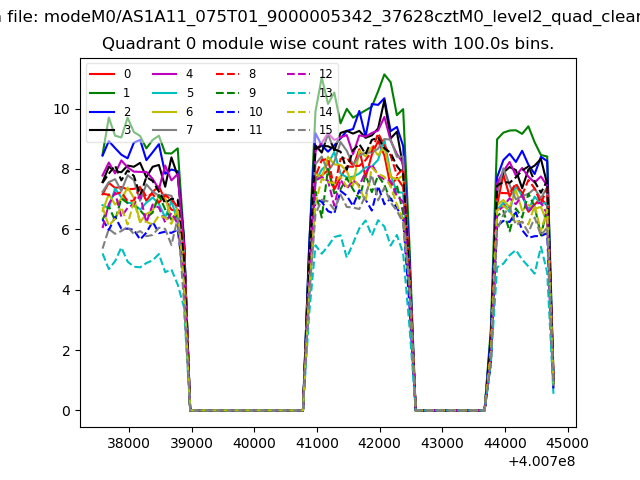 |
 |
| Module-wise count rates for Quadrant B Data is divided into 100 sec bins |
 |
 |
| Module-wise count rates for Quadrant C Data is divided into 100 sec bins |
 |
 |
| Module-wise count rates for Quadrant D Data is divided into 100 sec bins |
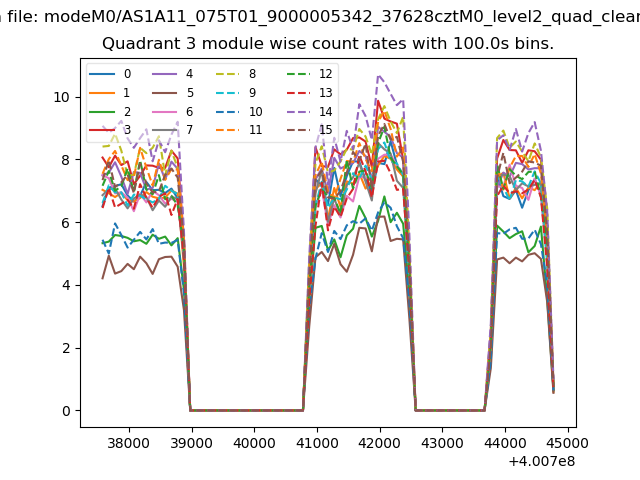 |
 |
| Parameter | Plot |
|---|---|
| CZT HV Monitor | 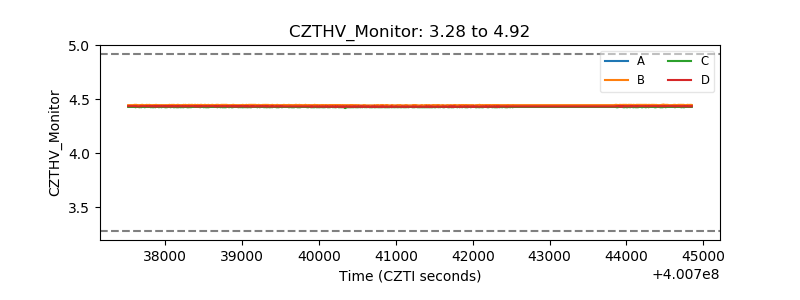 |
| D_VDD | 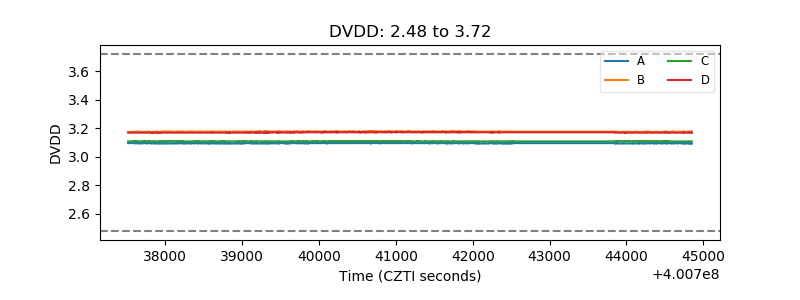 |
| Temperature 1 | 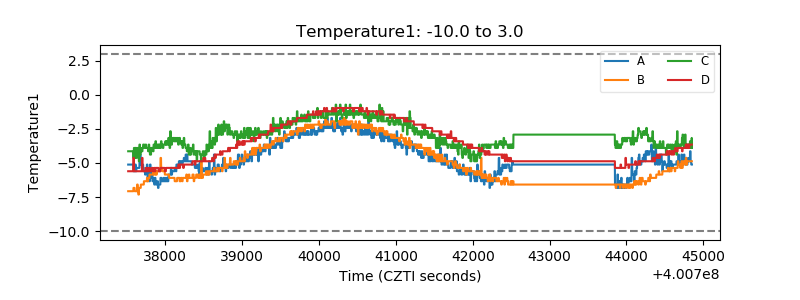 |
| Veto HV Monitor | 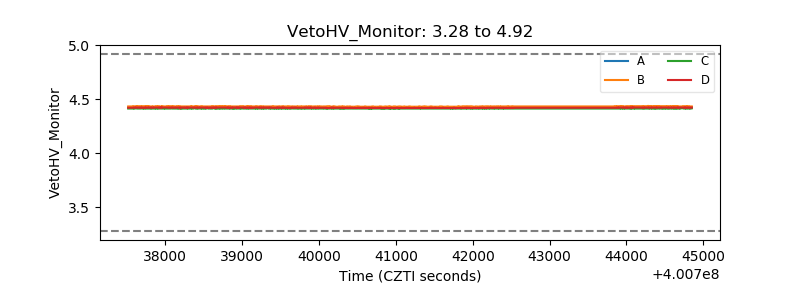 |
| Veto LLD | 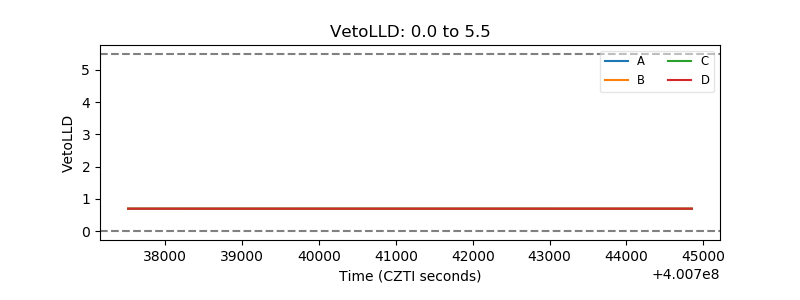 |
| Alpha Counter | 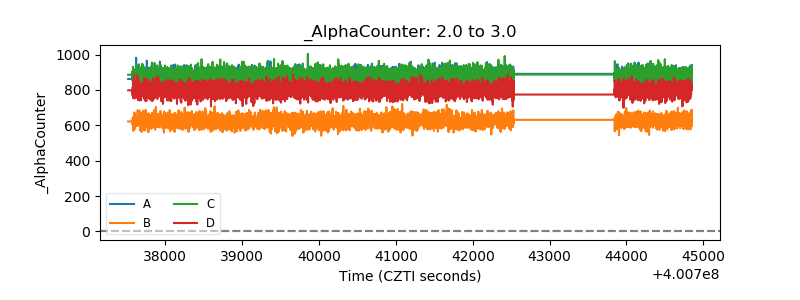 |
| _CPM_Rate | 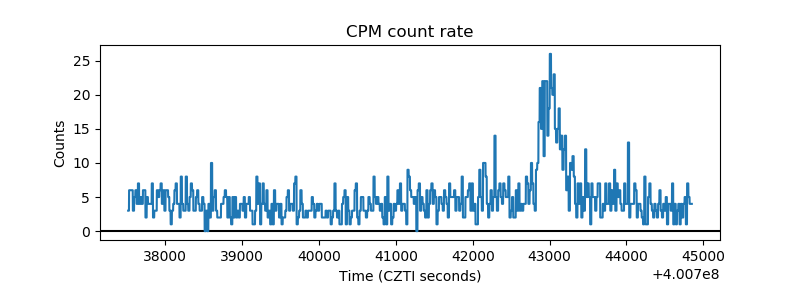 |
| CZT Counter | 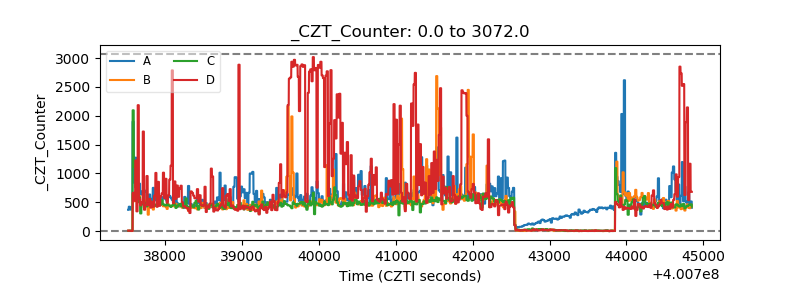 |
| +2.5 Volts monitor | 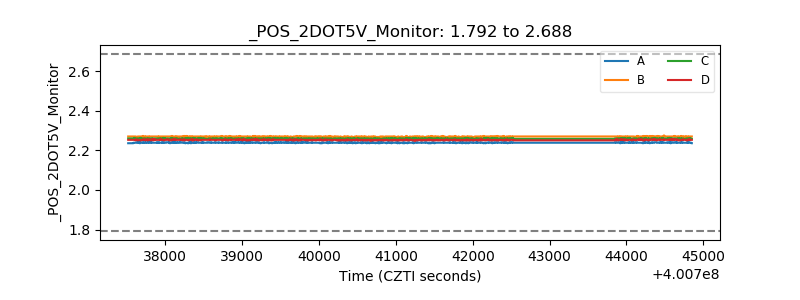 |
| +5 Volts monitor | 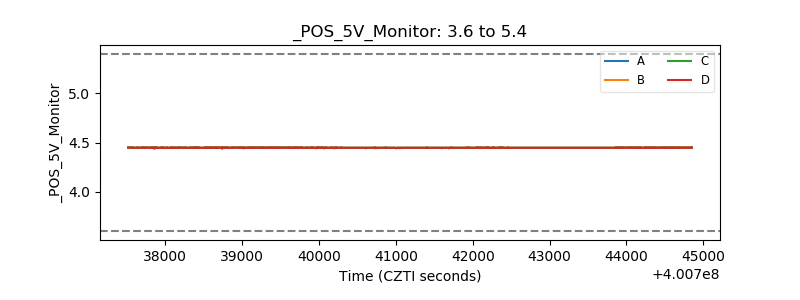 |
| _ROLL_ROT | 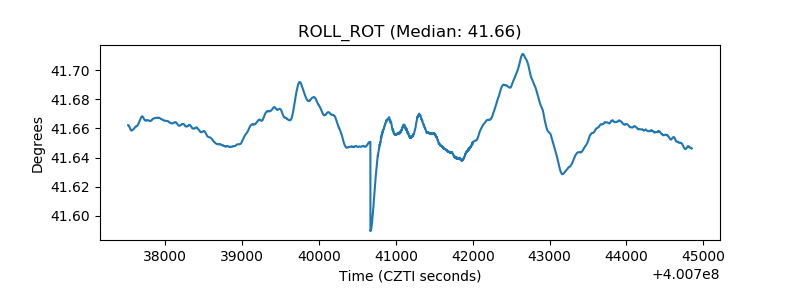 |
| _Roll_DEC | 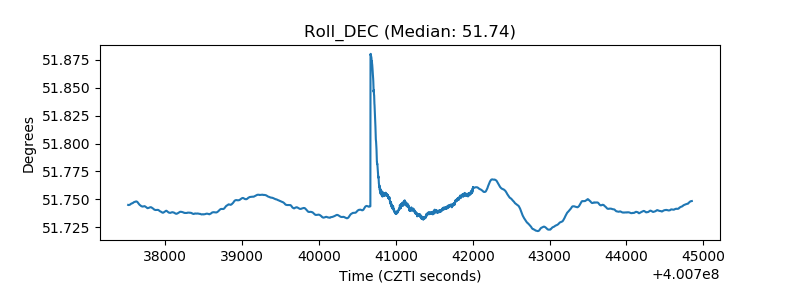 |
| _Roll_RA | 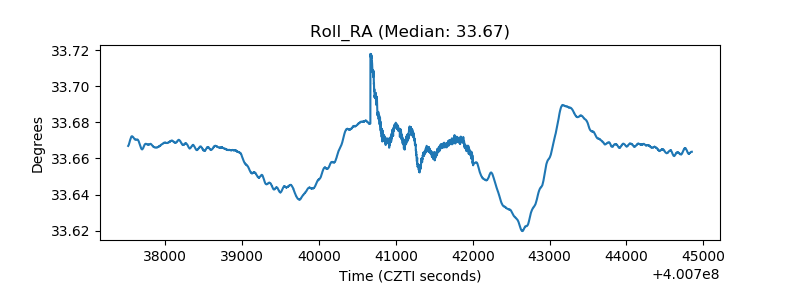 |
| Veto Counter | 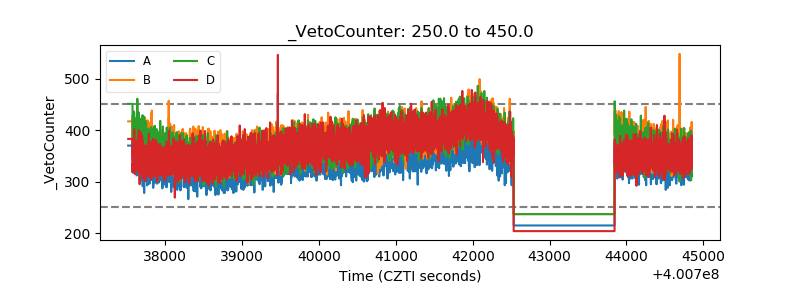 |