| Param | Original file | Final file |
|---|---|---|
| Filename | modeM0/AS1A11_075T01_9000005342_37631cztM0_level2.evt | modeM0/AS1A11_075T01_9000005342_37631cztM0_level2_quad_clean.evt |
| Size (bytes) | 622,612,800 | 55,365,120 |
| Size | 593.8 MB | 52.8 MB |
| Events in quadrant A | 7,134,754 | 299,725 |
| Events in quadrant B | 3,332,399 | 339,747 |
| Events in quadrant C | 2,855,258 | 338,195 |
| Events in quadrant D | 5,153,512 | 305,469 |
| Mode SS | |||
|---|---|---|---|
| Quadrant | BADHDUFLAG | Total packets | Discarded packets |
| A | 0 | 114 | 0 |
| B | 0 | 114 | 0 |
| C | 0 | 114 | 0 |
| D | 0 | 114 | 0 |
| Mode M0 | |||
|---|---|---|---|
| Quadrant | BADHDUFLAG | Total packets | Discarded packets |
| A | 0 | 24908 | 3 |
| B | 0 | 13359 | 2 |
| C | 0 | 11687 | 2 |
| D | 0 | 19046 | 2 |
| Mode M9 | |||
|---|---|---|---|
| Quadrant | BADHDUFLAG | Total packets | Discarded packets |
| A | 0 | 27 | 0 |
| B | 0 | 27 | 0 |
| C | 0 | 27 | 0 |
| D | 0 | 28 | 0 |
| Quadrant | Total seconds | Saturated seconds | Saturation percentage |
|---|---|---|---|
| A | 5613 | 1752 | 31.213255% |
| B | 5613 | 148 | 2.636736% |
| C | 5613 | 29 | 0.516658% |
| D | 5613 | 704 | 12.542312% |
Noise dominated data is calculated using 1-second bins in cleaned event files. If a bin has >2000 counts, and if more than 50% of those come from <1% of pixels, then it is considered to be noise-dominated and hence unusable.
| Quadrant | # 1 sec bins | Bins with >0 counts | Bins with >2000 counts | High rate bins dominated by noise | Noise dominated (total time) | Noise dominated (detector-on time) | Marked lightcurve |
|---|---|---|---|---|---|---|---|
| A | 7196 | 5614 | 1609 | 1609 | 22.36% | 28.66% | 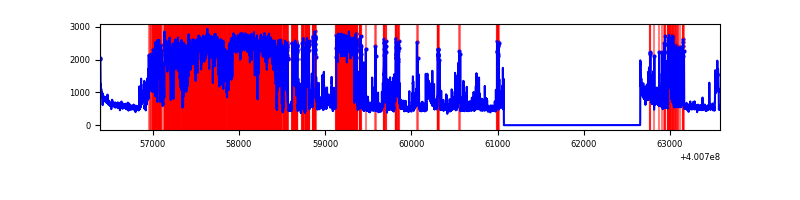 |
| B | 7195 | 5612 | 102 | 102 | 1.42% | 1.82% | 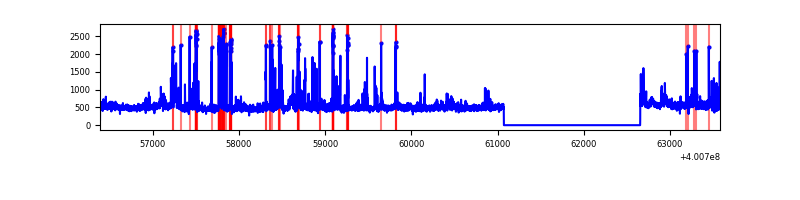 |
| C | 7195 | 5612 | 22 | 22 | 0.31% | 0.39% | 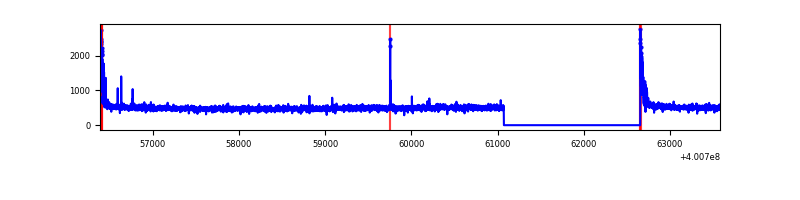 |
| D | 7195 | 5612 | 729 | 729 | 10.13% | 12.99% | 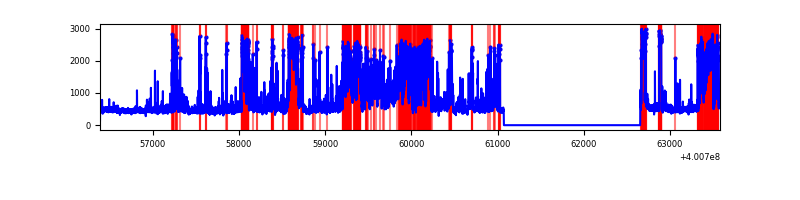 |
Top three noisy pixels from each quadrant. If the there are fewer than three noisy pixels in the level2.evt file, extra rows are filled as -1
| Pixel properties | Quadrant properties | ||||||
|---|---|---|---|---|---|---|---|
| Quadrant | DetID | PixID | Counts | Sigma | Mean | Median | Sigma |
| A | 15 | 222 | 4531630 | 39716.92 | 558 | 547 | 114.1 |
| A | 10 | 83 | 294878 | 2579.94 | 558 | 547 | 114.1 |
| A | 7 | 16 | 41833 | 361.89 | 558 | 547 | 114.1 |
| B | 5 | 172 | 364837 | 2926.15 | 644 | 627 | 124.5 |
| B | 15 | 85 | 119075 | 951.64 | 644 | 627 | 124.5 |
| B | 5 | 255 | 98035 | 782.6 | 644 | 627 | 124.5 |
| C | 15 | 214 | 259947 | 1754.09 | 634 | 638 | 147.8 |
| C | 0 | 10 | 103467 | 695.58 | 634 | 638 | 147.8 |
| C | 14 | 254 | 12249 | 78.54 | 634 | 638 | 147.8 |
| D | 2 | 249 | 1662875 | 11145.87 | 607 | 591 | 149.1 |
| D | 10 | 199 | 298109 | 1994.9 | 607 | 591 | 149.1 |
| D | 13 | 249 | 284826 | 1905.84 | 607 | 591 | 149.1 |
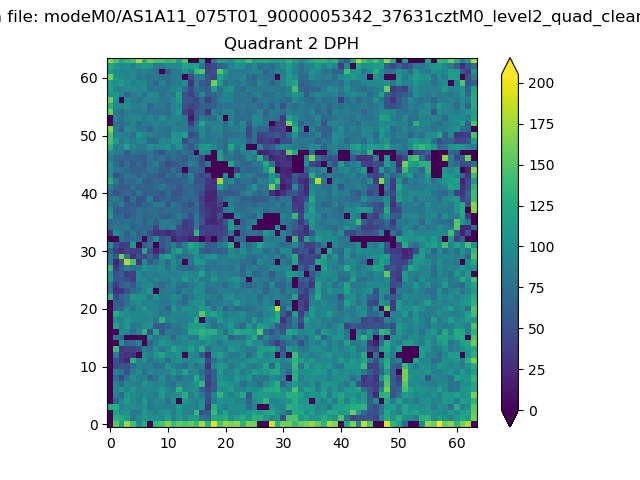
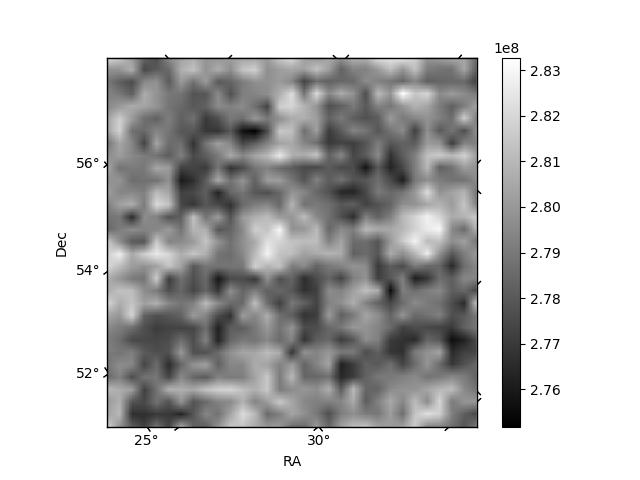
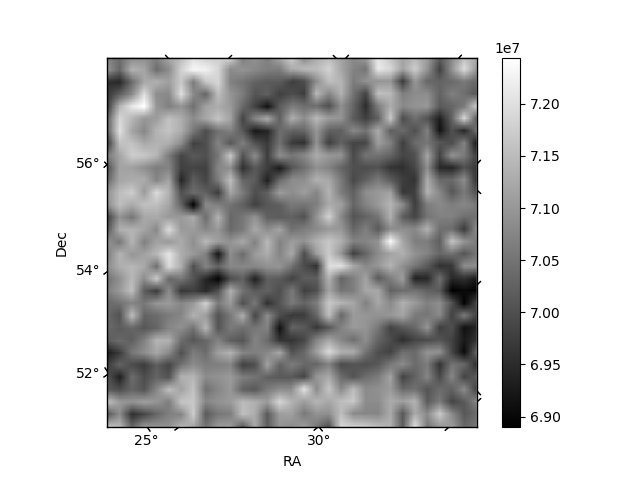
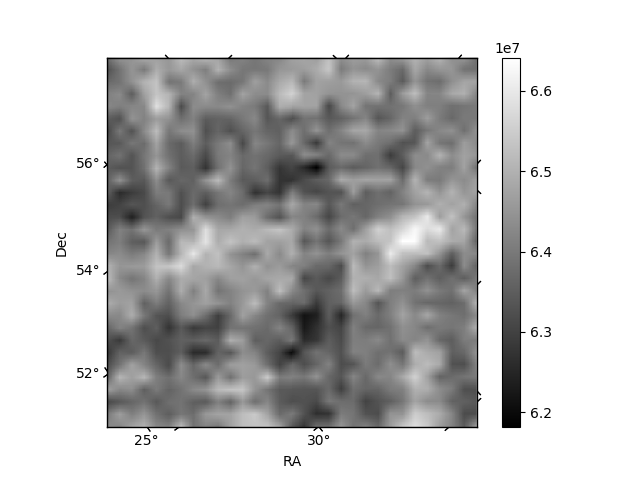
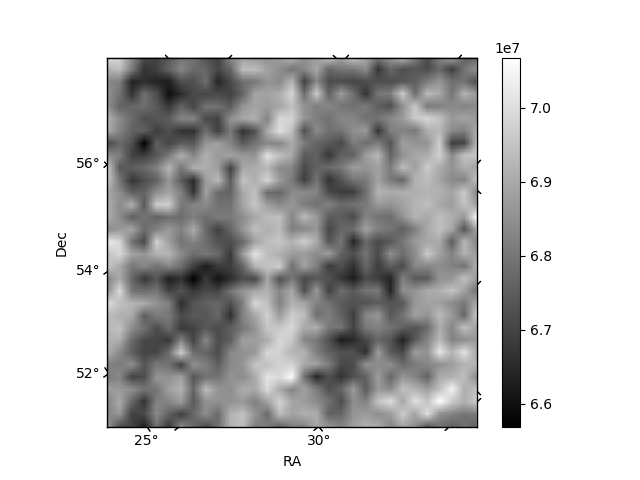
Histogram calculated using DETX and DETY for each event in the final _common_clean file
| Quadrant A | 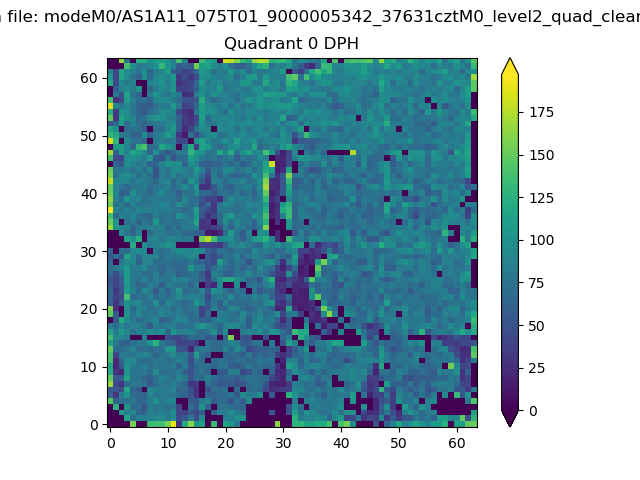 |
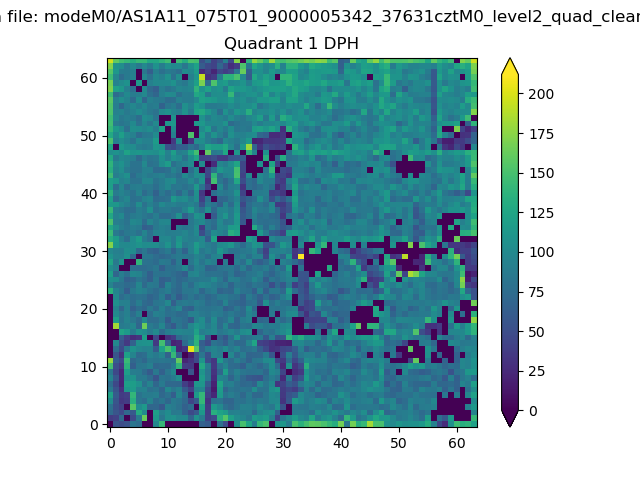 |
Quadrant B |
|---|---|---|---|
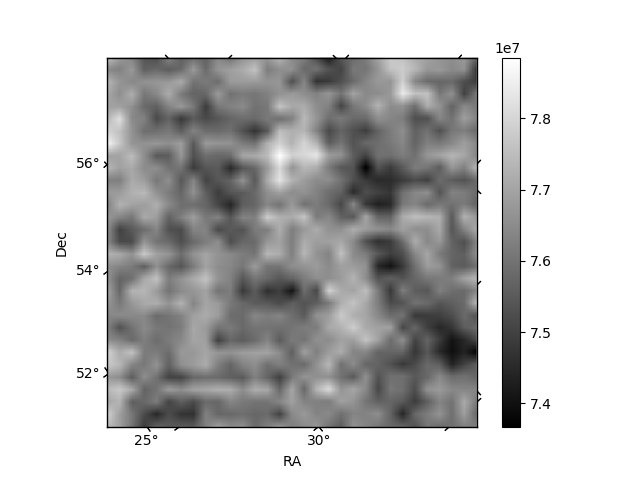
| Quadrant D | 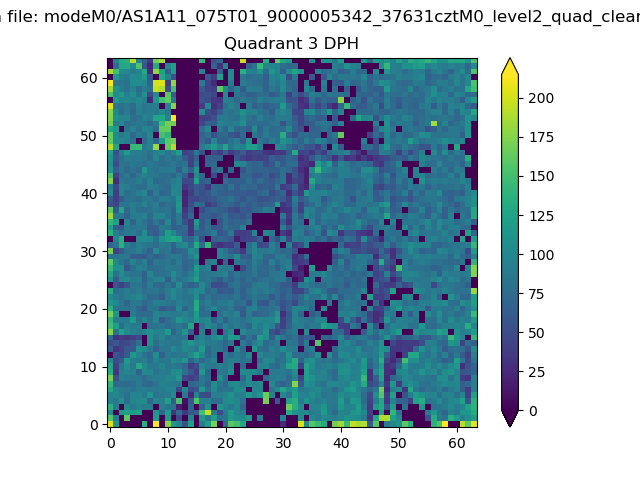 |
 |
Quadrant C |
| Plot type | Count rate plots | Images |
|---|---|---|
| Comparison with Poisson distribution Blue bars denote a histogram of data divided into 1 sec bins. Red curve is a Poisson curve with rate = median count rate of data. |
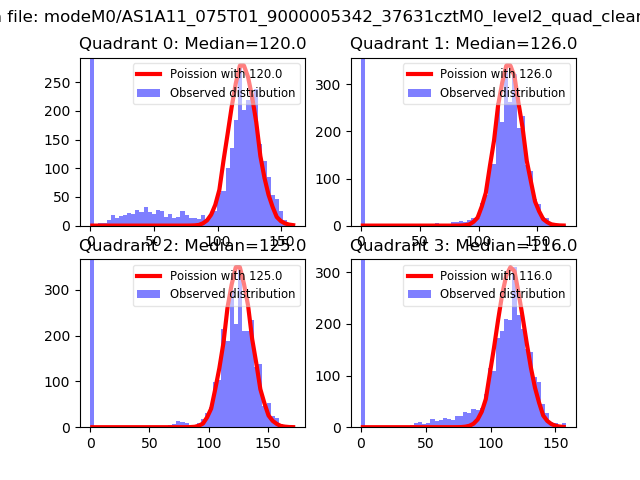 |
 |
| Quadrant-wise count rates Data is divided into 100 sec bins |
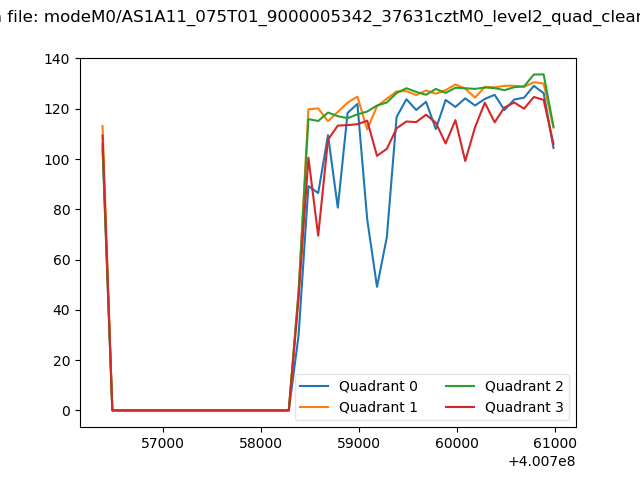 |
|
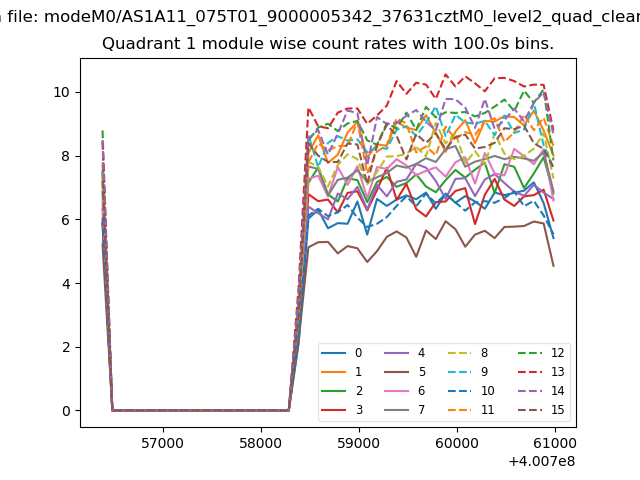
| Module-wise count rates for Quadrant A Data is divided into 100 sec bins |
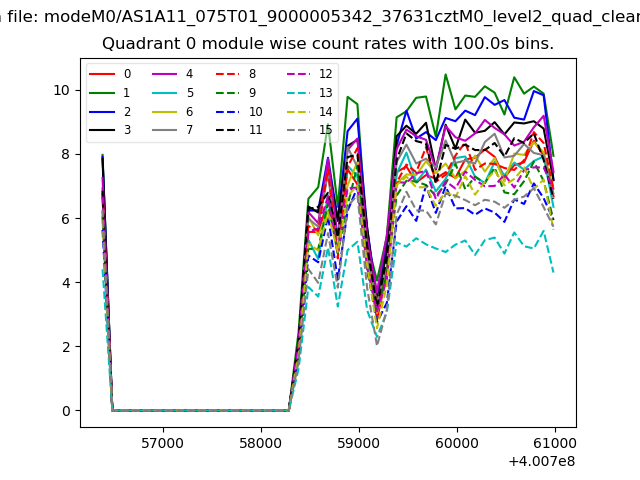 |
 |
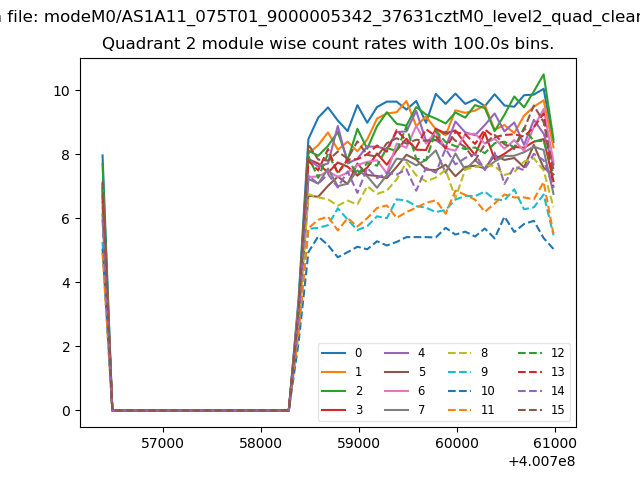
| Module-wise count rates for Quadrant B Data is divided into 100 sec bins |
 |
 |
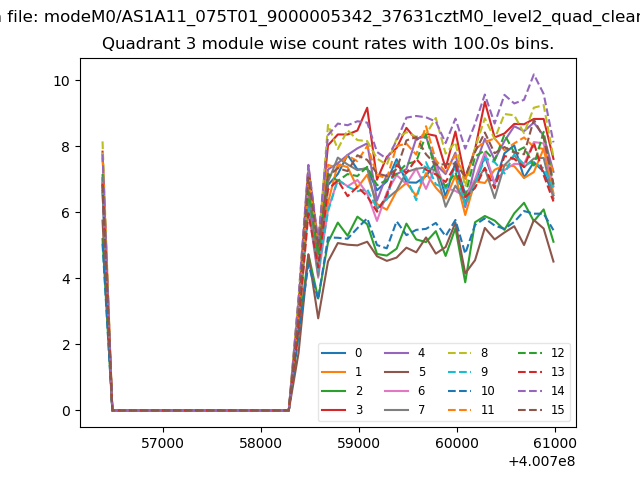
| Module-wise count rates for Quadrant C Data is divided into 100 sec bins |
 |
 |
| Module-wise count rates for Quadrant D Data is divided into 100 sec bins |
 |
 |
| Parameter | Plot |
|---|---|
| CZT HV Monitor | 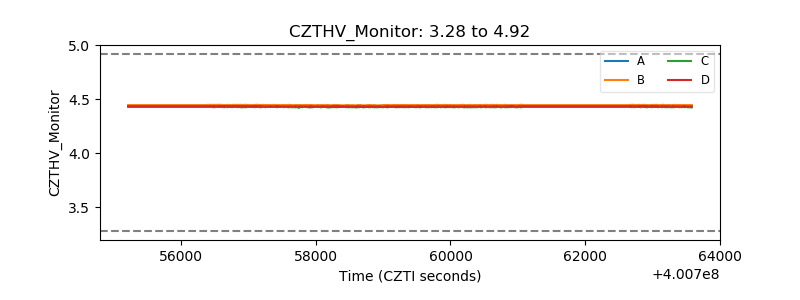 |
| D_VDD | 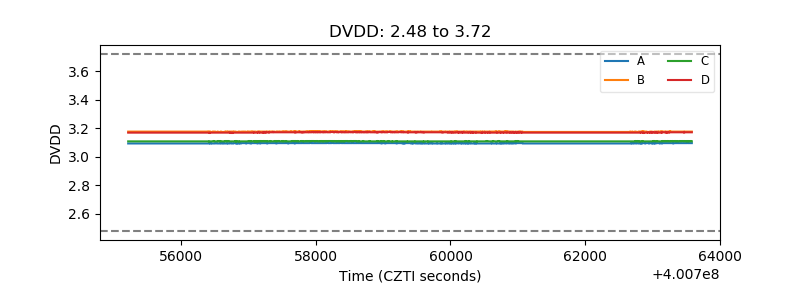 |
| Temperature 1 | 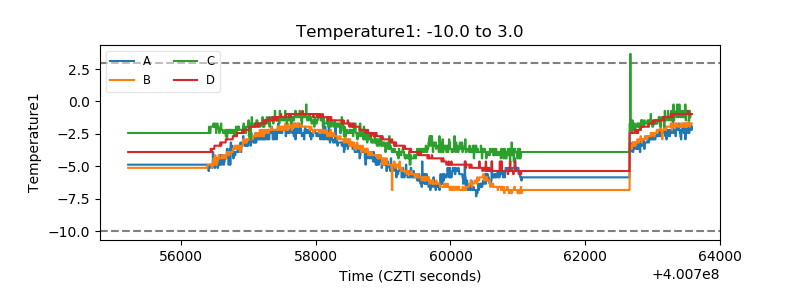 |
| Veto HV Monitor | 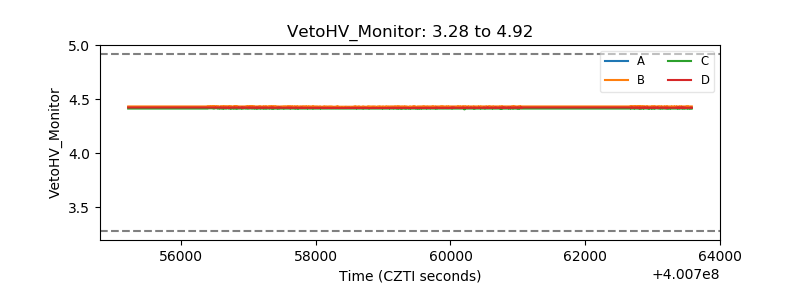 |
| Veto LLD | 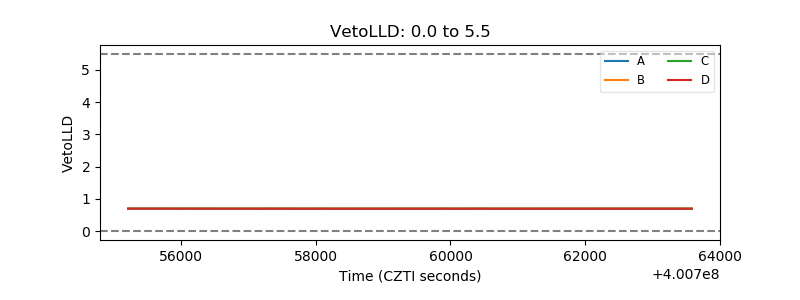 |
| Alpha Counter | 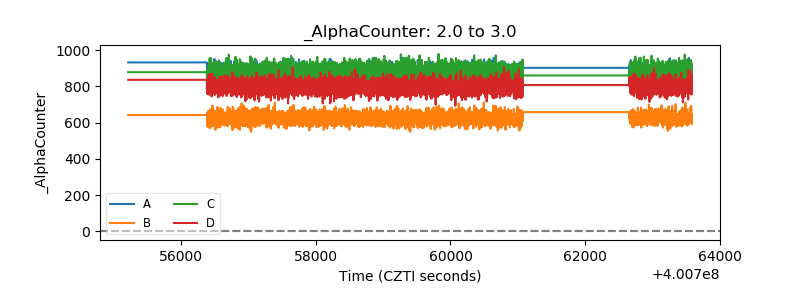 |
| _CPM_Rate | 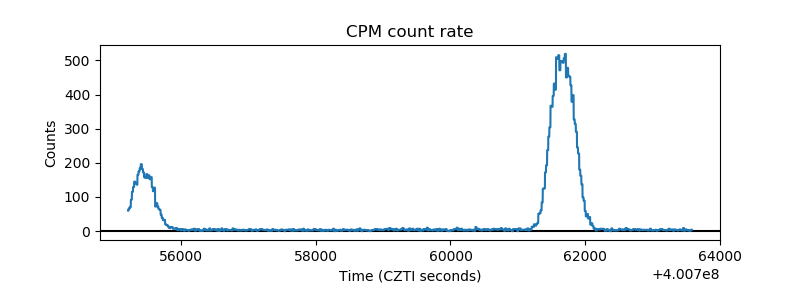 |
| CZT Counter | 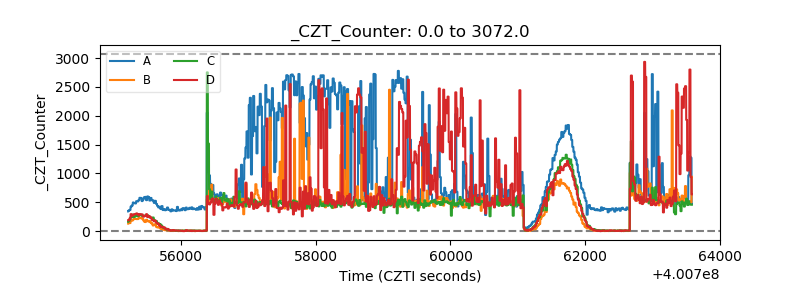 |
| +2.5 Volts monitor | 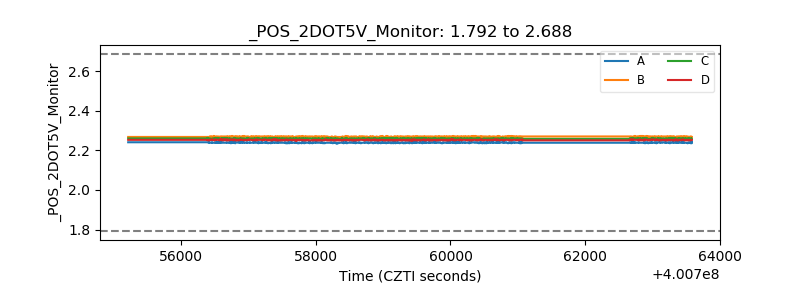 |
| +5 Volts monitor | 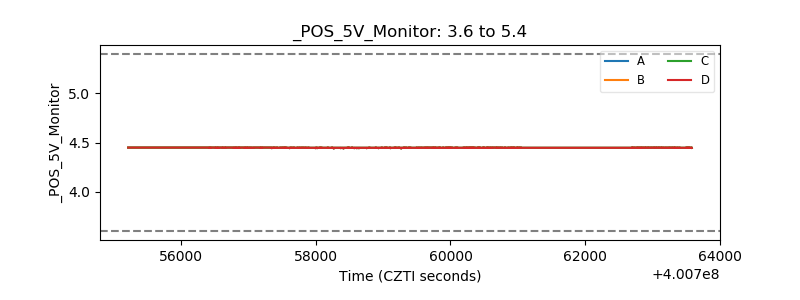 |
| _ROLL_ROT | 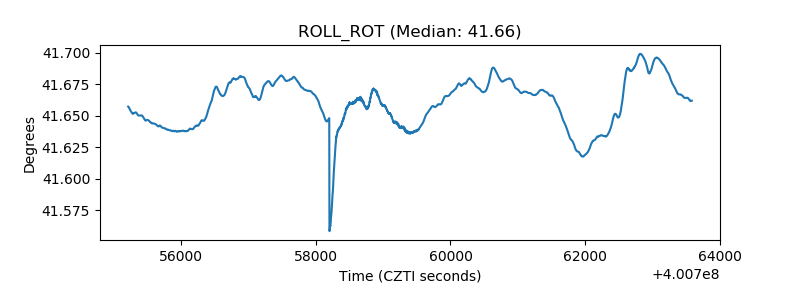 |
| _Roll_DEC | 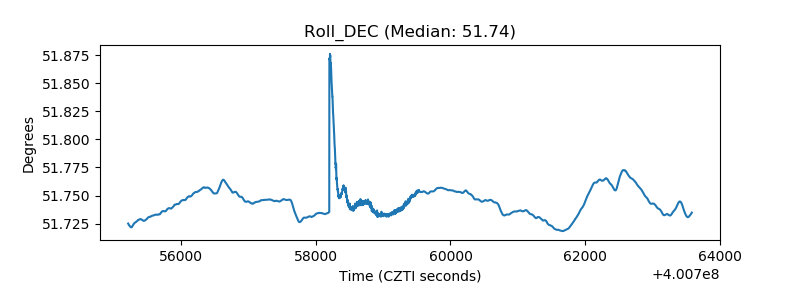 |
| _Roll_RA | 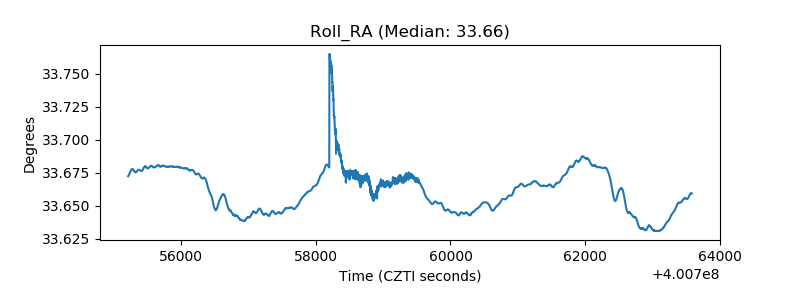 |
| Veto Counter | 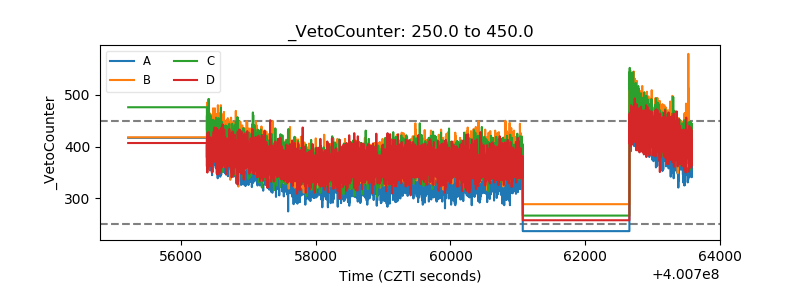 |