| Param | Original file | Final file |
|---|---|---|
| Filename | modeM0/AS1A11_075T01_9000005342_37634cztM0_level2.evt | modeM0/AS1A11_075T01_9000005342_37634cztM0_level2_quad_clean.evt |
| Size (bytes) | 771,693,120 | 61,297,920 |
| Size | 735.9 MB | 58.5 MB |
| Events in quadrant A | 10,610,474 | 205,435 |
| Events in quadrant B | 3,540,472 | 433,274 |
| Events in quadrant C | 2,874,780 | 438,040 |
| Events in quadrant D | 5,983,964 | 402,954 |
| Mode SS | |||
|---|---|---|---|
| Quadrant | BADHDUFLAG | Total packets | Discarded packets |
| A | 0 | 108 | 0 |
| B | 0 | 108 | 0 |
| C | 0 | 108 | 0 |
| D | 0 | 108 | 0 |
| Mode M0 | |||
|---|---|---|---|
| Quadrant | BADHDUFLAG | Total packets | Discarded packets |
| A | 0 | 35142 | 3 |
| B | 0 | 14010 | 2 |
| C | 0 | 11674 | 2 |
| D | 0 | 21434 | 2 |
| Mode M9 | |||
|---|---|---|---|
| Quadrant | BADHDUFLAG | Total packets | Discarded packets |
| A | 0 | 32 | 0 |
| B | 0 | 32 | 0 |
| C | 0 | 32 | 0 |
| D | 0 | 33 | 0 |
| Quadrant | Total seconds | Saturated seconds | Saturation percentage |
|---|---|---|---|
| A | 5359 | 3364 | 62.772905% |
| B | 5359 | 357 | 6.661691% |
| C | 5359 | 18 | 0.335884% |
| D | 5359 | 620 | 11.569323% |
Noise dominated data is calculated using 1-second bins in cleaned event files. If a bin has >2000 counts, and if more than 50% of those come from <1% of pixels, then it is considered to be noise-dominated and hence unusable.
| Quadrant | # 1 sec bins | Bins with >0 counts | Bins with >2000 counts | High rate bins dominated by noise | Noise dominated (total time) | Noise dominated (detector-on time) | Marked lightcurve |
|---|---|---|---|---|---|---|---|
| A | 7182 | 5360 | 3211 | 3211 | 44.71% | 59.91% | 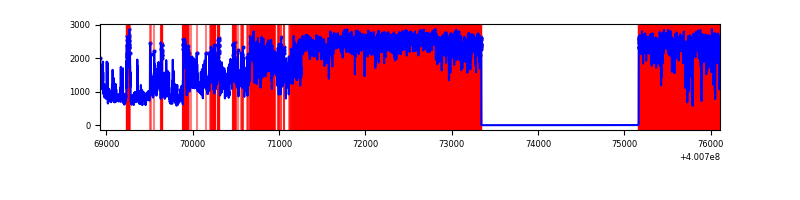 |
| B | 7181 | 5358 | 317 | 317 | 4.41% | 5.92% | 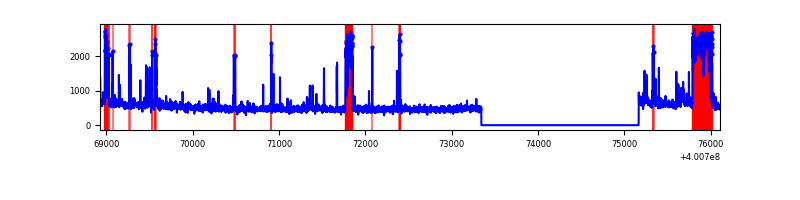 |
| C | 7181 | 5358 | 14 | 14 | 0.19% | 0.26% | 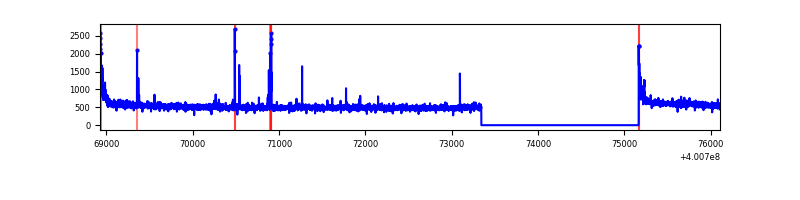 |
| D | 7181 | 5358 | 632 | 632 | 8.80% | 11.80% | 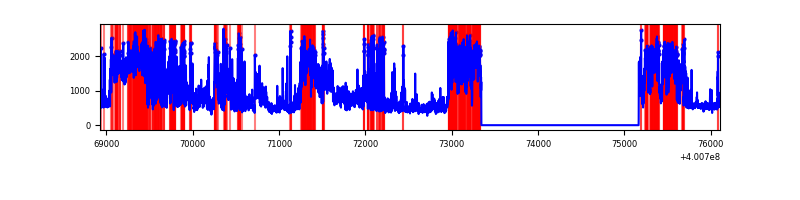 |
Top three noisy pixels from each quadrant. If the there are fewer than three noisy pixels in the level2.evt file, extra rows are filled as -1
| Pixel properties | Quadrant properties | ||||||
|---|---|---|---|---|---|---|---|
| Quadrant | DetID | PixID | Counts | Sigma | Mean | Median | Sigma |
| A | 15 | 222 | 8736965 | 106968.46 | 408 | 400 | 81.7 |
| A | 10 | 83 | 223895 | 2736.42 | 408 | 400 | 81.7 |
| A | 9 | 143 | 46033 | 558.72 | 408 | 400 | 81.7 |
| B | 5 | 172 | 715090 | 6025.97 | 627 | 612 | 118.6 |
| B | 5 | 200 | 166522 | 1399.3 | 627 | 612 | 118.6 |
| B | 5 | 255 | 35276 | 292.36 | 627 | 612 | 118.6 |
| C | 15 | 214 | 251660 | 1691.25 | 642 | 648 | 148.4 |
| C | 0 | 10 | 69877 | 466.45 | 642 | 648 | 148.4 |
| C | 14 | 254 | 36831 | 243.79 | 642 | 648 | 148.4 |
| D | 2 | 249 | 2715143 | 17901.92 | 627 | 610 | 151.6 |
| D | 1 | 47 | 495445 | 3263.36 | 627 | 610 | 151.6 |
| D | 13 | 249 | 108806 | 713.54 | 627 | 610 | 151.6 |
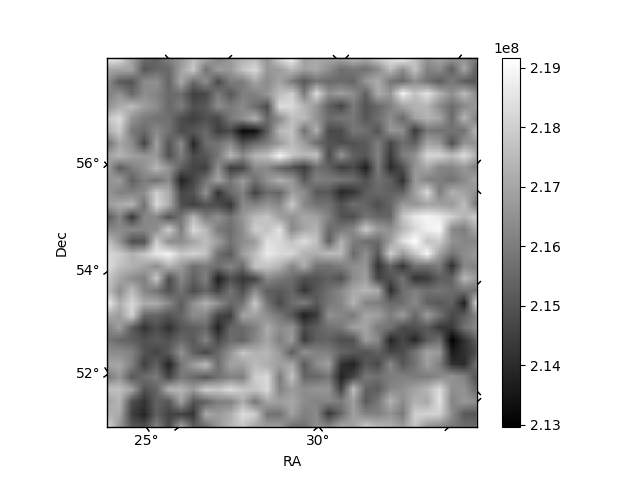
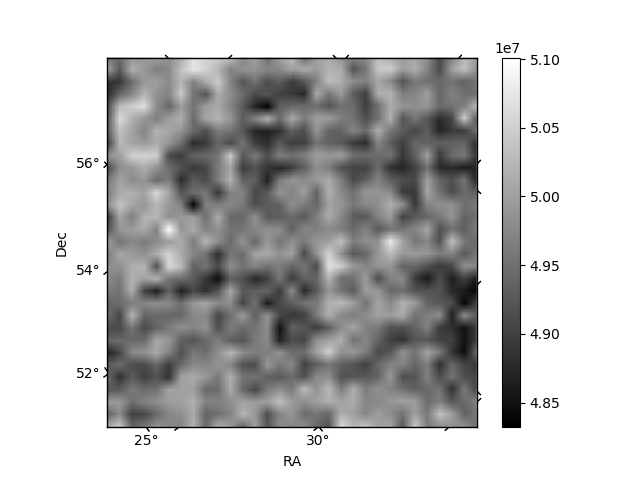
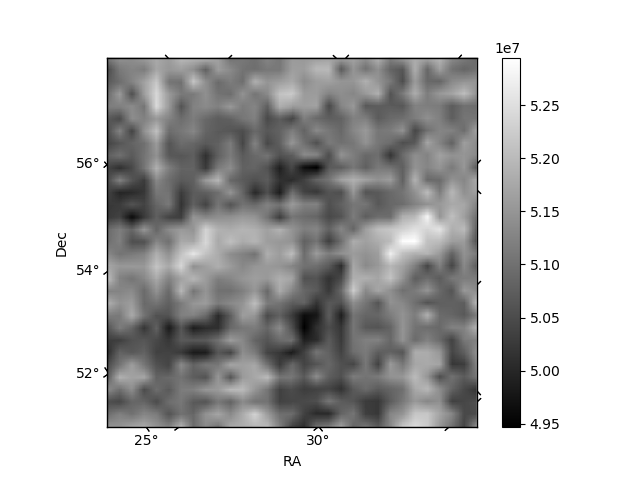
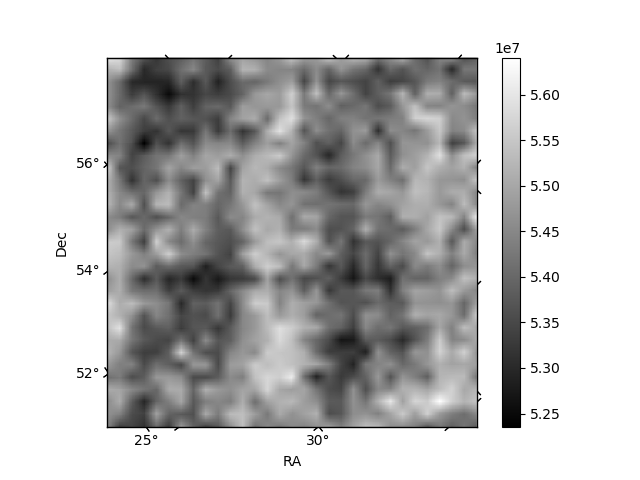
Histogram calculated using DETX and DETY for each event in the final _common_clean file
| Quadrant A | 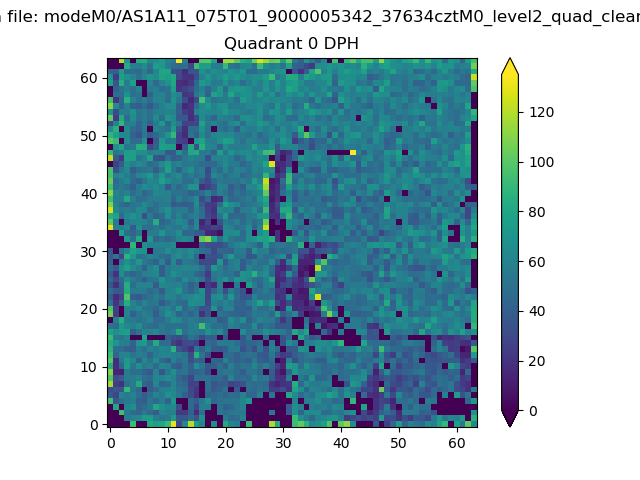 |
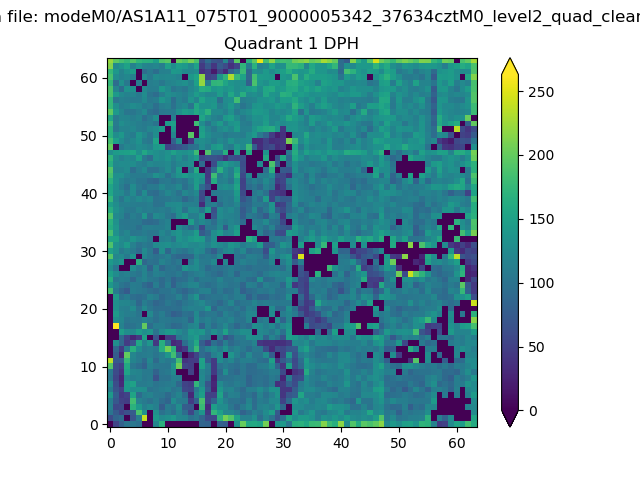 |
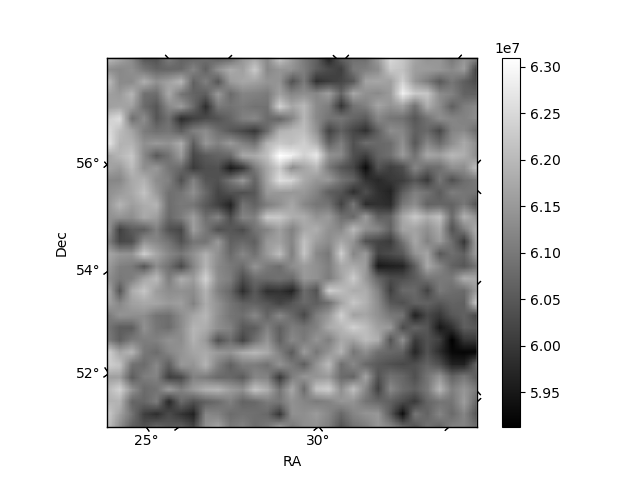
Quadrant B |
|---|---|---|---|
| Quadrant D | 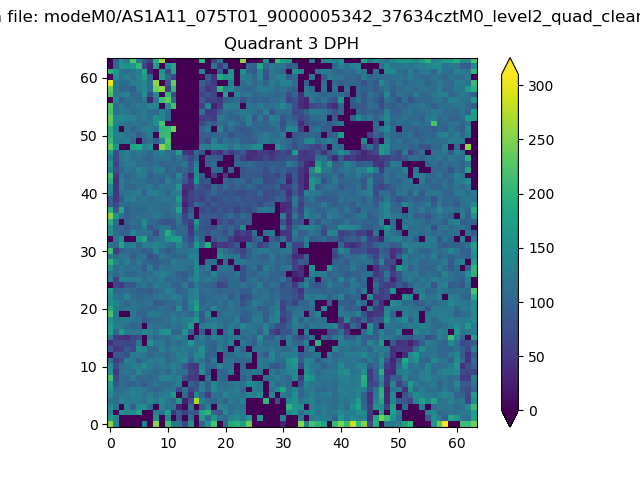 |
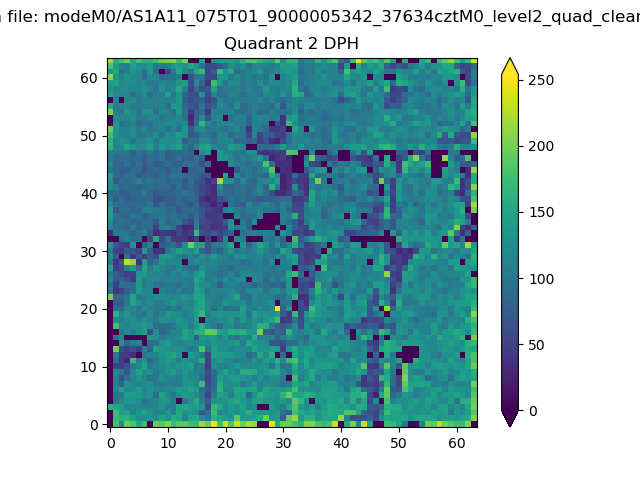 |
Quadrant C |
| Plot type | Count rate plots | Images |
|---|---|---|
| Comparison with Poisson distribution Blue bars denote a histogram of data divided into 1 sec bins. Red curve is a Poisson curve with rate = median count rate of data. |
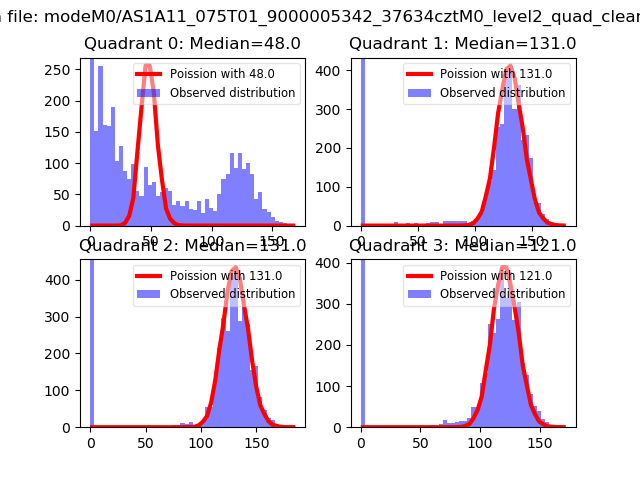 |
 |
| Quadrant-wise count rates Data is divided into 100 sec bins |
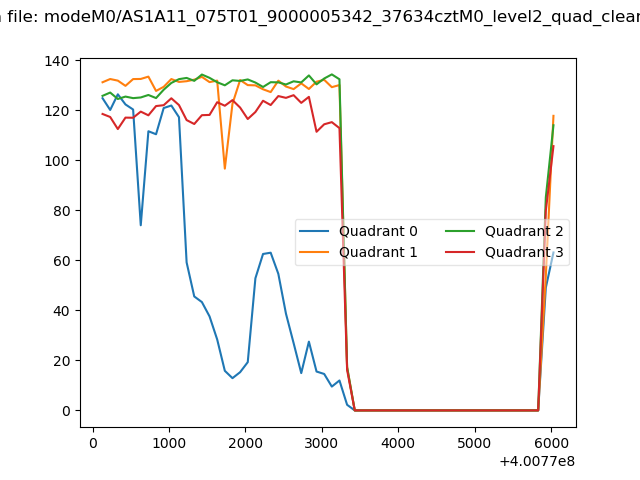 |
|
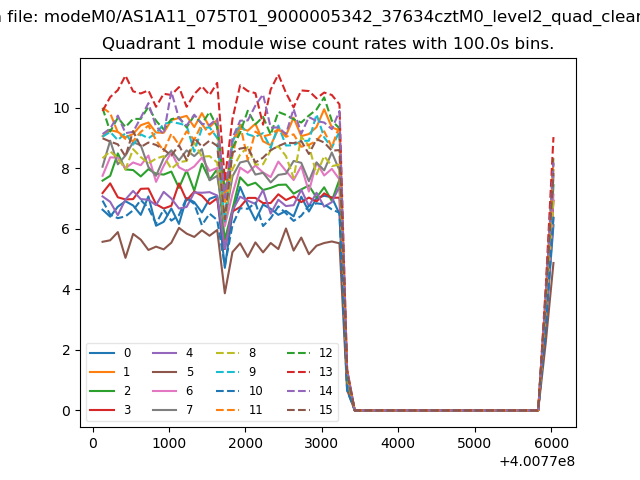
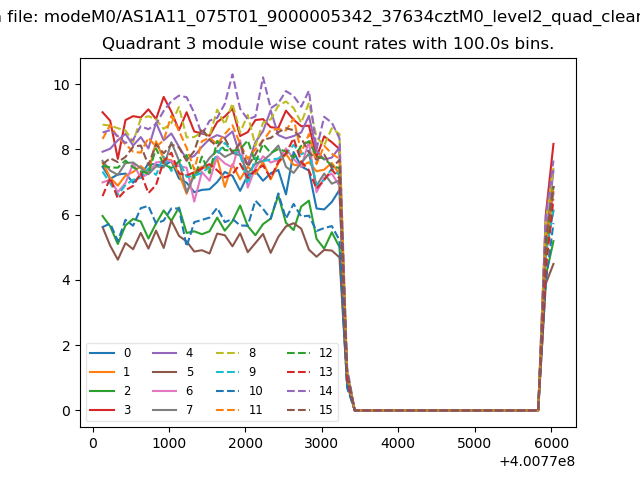
| Module-wise count rates for Quadrant A Data is divided into 100 sec bins |
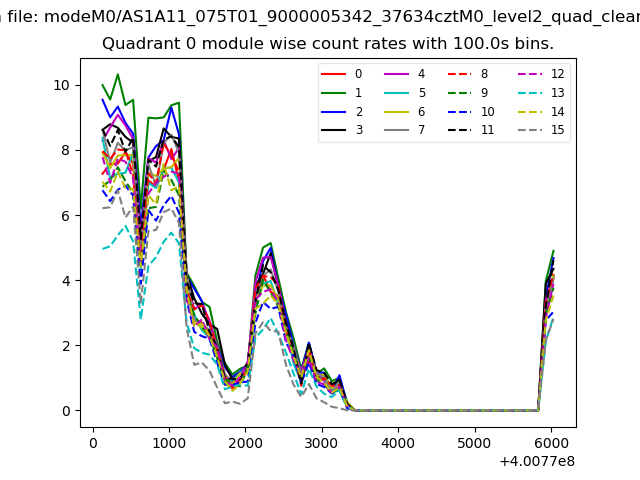 |
 |
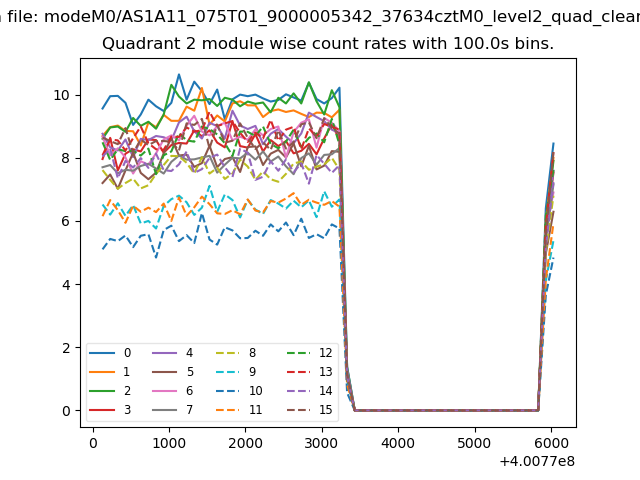
| Module-wise count rates for Quadrant B Data is divided into 100 sec bins |
 |
 |
| Module-wise count rates for Quadrant C Data is divided into 100 sec bins |
 |
 |
| Module-wise count rates for Quadrant D Data is divided into 100 sec bins |
 |
 |
| Parameter | Plot |
|---|---|
| CZT HV Monitor | 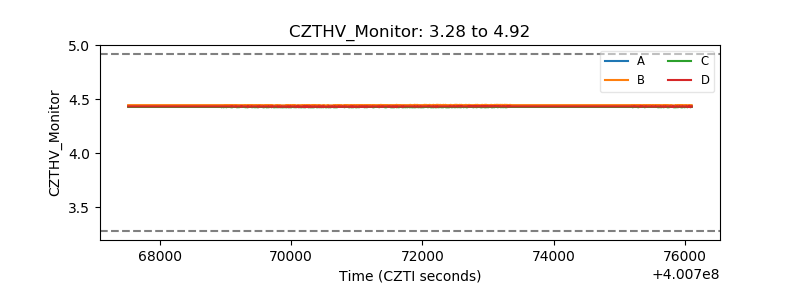 |
| D_VDD | 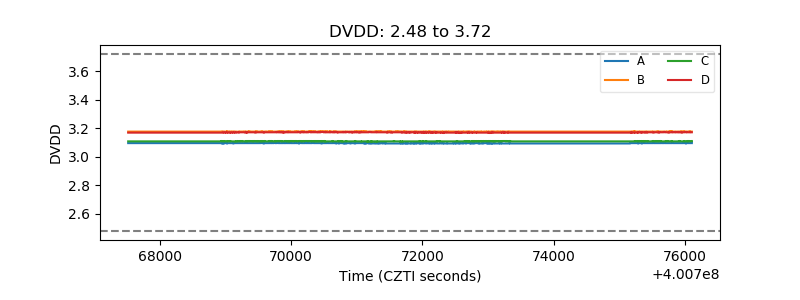 |
| Temperature 1 | 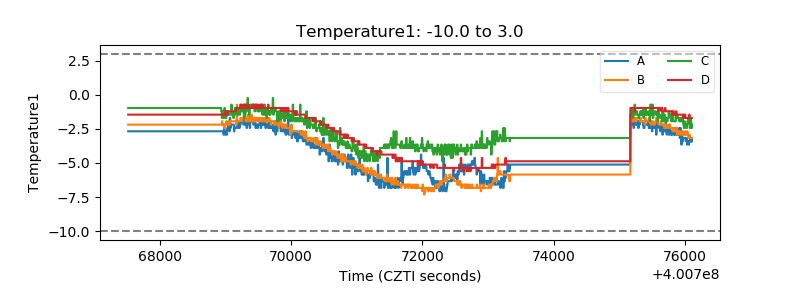 |
| Veto HV Monitor |  |
| Veto LLD | 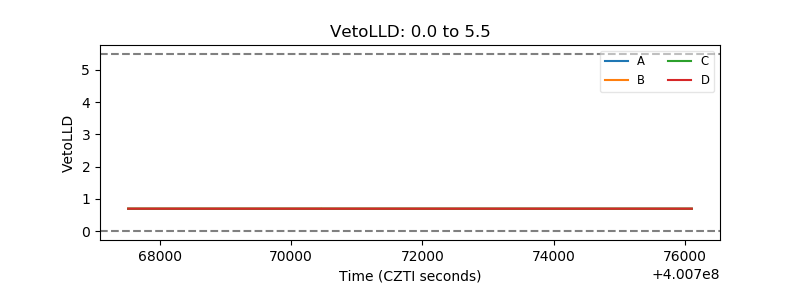 |
| Alpha Counter | 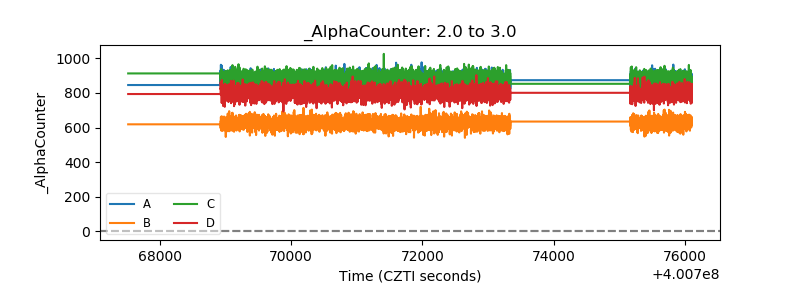 |
| _CPM_Rate | 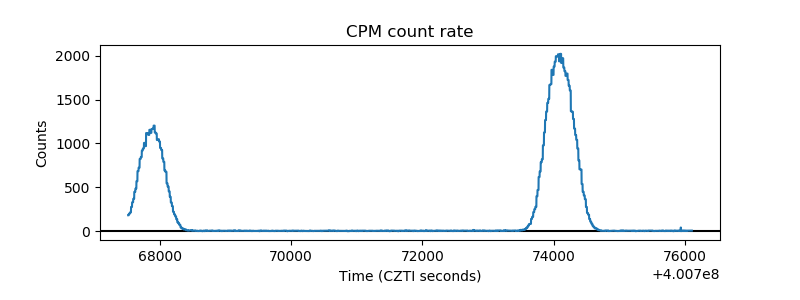 |
| CZT Counter | 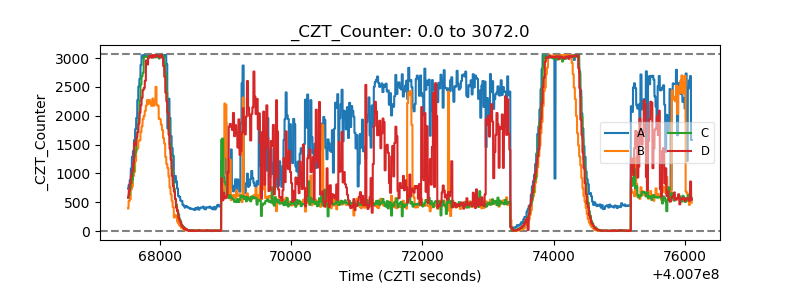 |
| +2.5 Volts monitor | 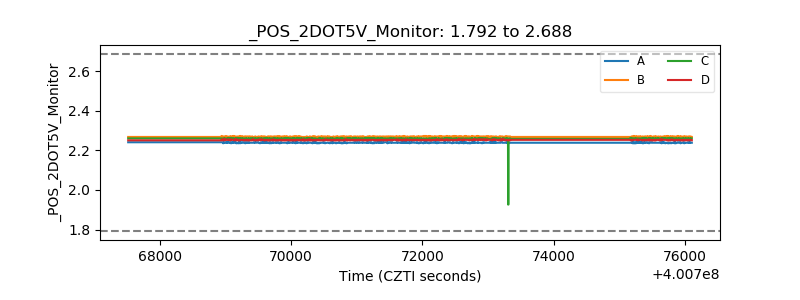 |
| +5 Volts monitor | 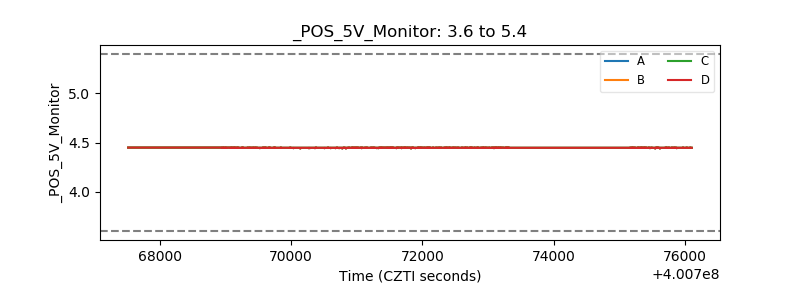 |
| _ROLL_ROT | 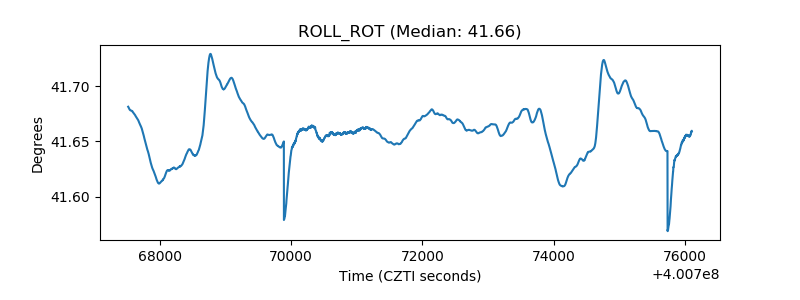 |
| _Roll_DEC | 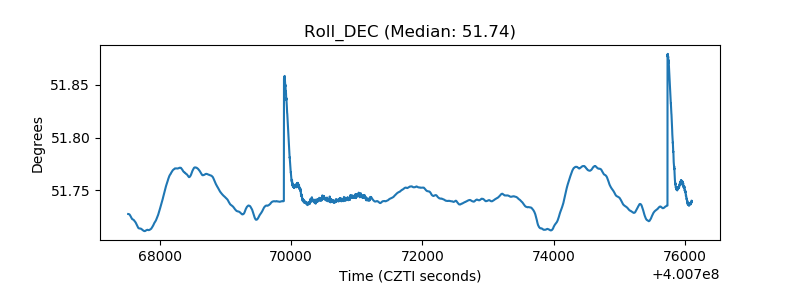 |
| _Roll_RA | 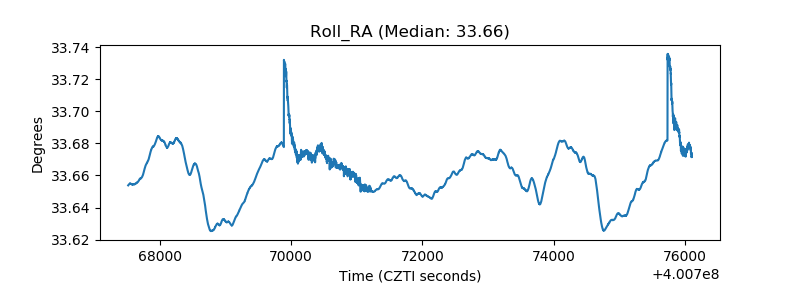 |
| Veto Counter | 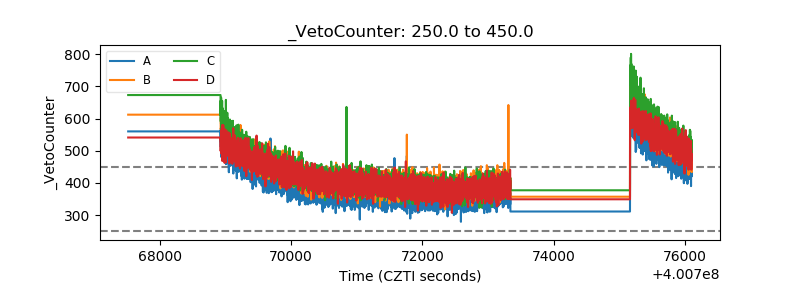 |