| Param | Original file | Final file |
|---|---|---|
| Filename | modeM0/AS1A11_075T01_9000005342_37635cztM0_level2.evt | modeM0/AS1A11_075T01_9000005342_37635cztM0_level2_quad_clean.evt |
| Size (bytes) | 613,451,520 | 80,913,600 |
| Size | 585.0 MB | 77.2 MB |
| Events in quadrant A | 7,736,540 | 470,233 |
| Events in quadrant B | 3,708,873 | 538,104 |
| Events in quadrant C | 2,868,803 | 560,348 |
| Events in quadrant D | 3,916,438 | 520,653 |
| Mode SS | |||
|---|---|---|---|
| Quadrant | BADHDUFLAG | Total packets | Discarded packets |
| A | 0 | 104 | 0 |
| B | 0 | 104 | 0 |
| C | 0 | 104 | 0 |
| D | 0 | 104 | 0 |
| Mode M0 | |||
|---|---|---|---|
| Quadrant | BADHDUFLAG | Total packets | Discarded packets |
| A | 0 | 26470 | 3 |
| B | 0 | 14341 | 2 |
| C | 0 | 11605 | 2 |
| D | 0 | 15153 | 2 |
| Mode M9 | |||
|---|---|---|---|
| Quadrant | BADHDUFLAG | Total packets | Discarded packets |
| A | 0 | 26 | 0 |
| B | 0 | 26 | 0 |
| C | 0 | 26 | 0 |
| D | 0 | 27 | 0 |
| Quadrant | Total seconds | Saturated seconds | Saturation percentage |
|---|---|---|---|
| A | 5145 | 1908 | 37.084548% |
| B | 5145 | 438 | 8.513120% |
| C | 5145 | 38 | 0.738581% |
| D | 5145 | 312 | 6.064140% |
Noise dominated data is calculated using 1-second bins in cleaned event files. If a bin has >2000 counts, and if more than 50% of those come from <1% of pixels, then it is considered to be noise-dominated and hence unusable.
| Quadrant | # 1 sec bins | Bins with >0 counts | Bins with >2000 counts | High rate bins dominated by noise | Noise dominated (total time) | Noise dominated (detector-on time) | Marked lightcurve |
|---|---|---|---|---|---|---|---|
| A | 7088 | 5146 | 1899 | 1899 | 26.79% | 36.90% | 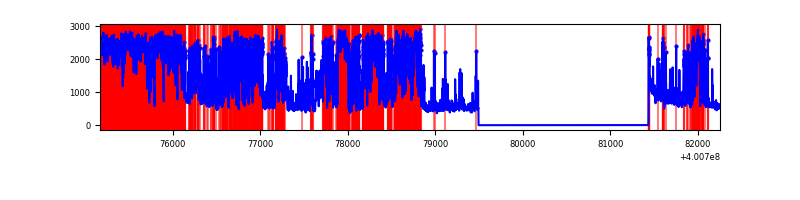 |
| B | 7087 | 5144 | 406 | 406 | 5.73% | 7.89% | 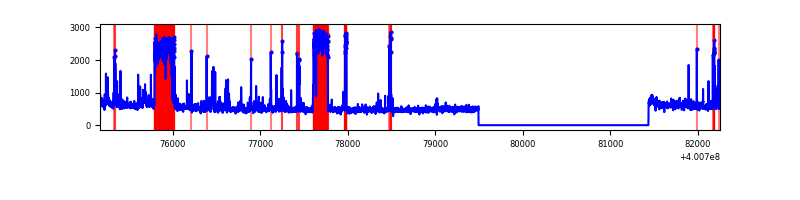 |
| C | 7087 | 5144 | 23 | 23 | 0.32% | 0.45% | 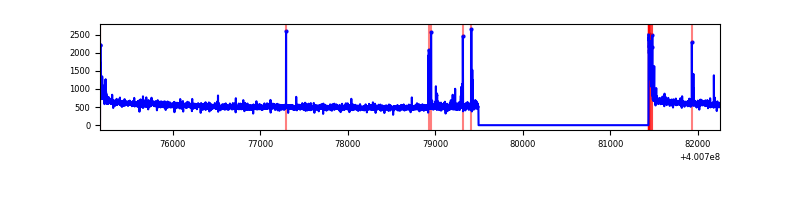 |
| D | 7087 | 5144 | 240 | 240 | 3.39% | 4.67% | 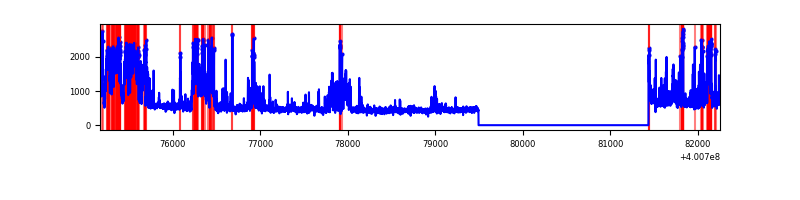 |
Top three noisy pixels from each quadrant. If the there are fewer than three noisy pixels in the level2.evt file, extra rows are filled as -1
| Pixel properties | Quadrant properties | ||||||
|---|---|---|---|---|---|---|---|
| Quadrant | DetID | PixID | Counts | Sigma | Mean | Median | Sigma |
| A | 15 | 222 | 5350404 | 50004.69 | 530 | 520 | 107.0 |
| A | 10 | 83 | 250419 | 2335.77 | 530 | 520 | 107.0 |
| A | 9 | 143 | 26703 | 244.73 | 530 | 520 | 107.0 |
| B | 5 | 172 | 626226 | 5451.57 | 613 | 598 | 114.8 |
| B | 5 | 184 | 468139 | 4074.04 | 613 | 598 | 114.8 |
| B | 0 | 230 | 38278 | 328.33 | 613 | 598 | 114.8 |
| C | 15 | 214 | 240632 | 1629.2 | 640 | 646 | 147.3 |
| C | 0 | 10 | 79584 | 535.89 | 640 | 646 | 147.3 |
| C | 14 | 254 | 27962 | 185.44 | 640 | 646 | 147.3 |
| D | 2 | 249 | 1019501 | 6710.63 | 628 | 613 | 151.8 |
| D | 2 | 153 | 140555 | 921.69 | 628 | 613 | 151.8 |
| D | 1 | 47 | 133157 | 872.97 | 628 | 613 | 151.8 |
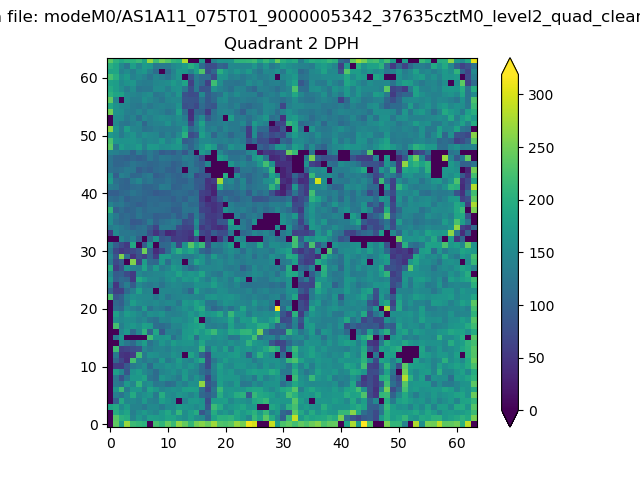
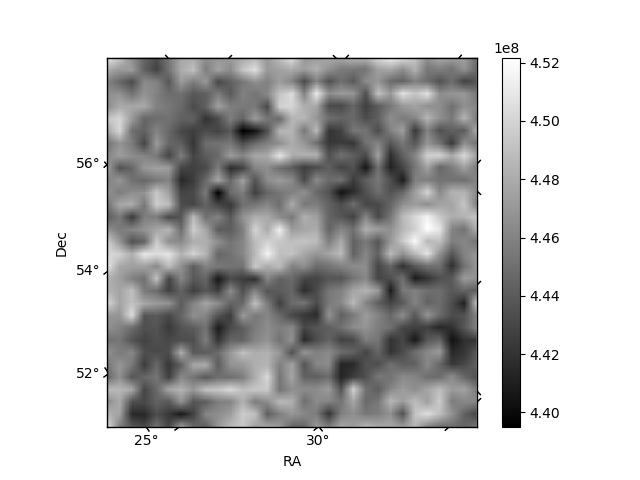
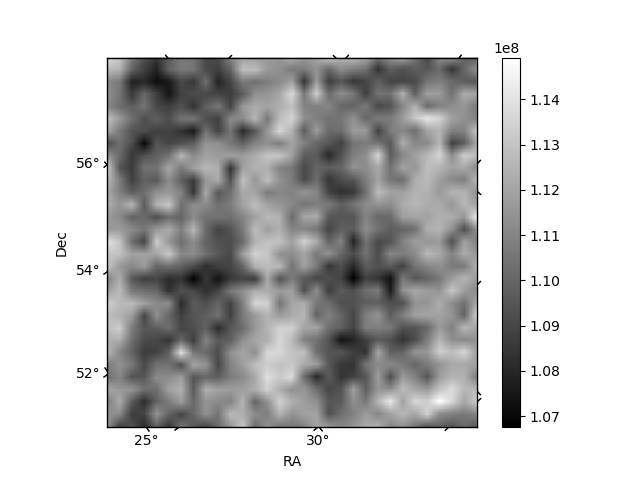
Histogram calculated using DETX and DETY for each event in the final _common_clean file
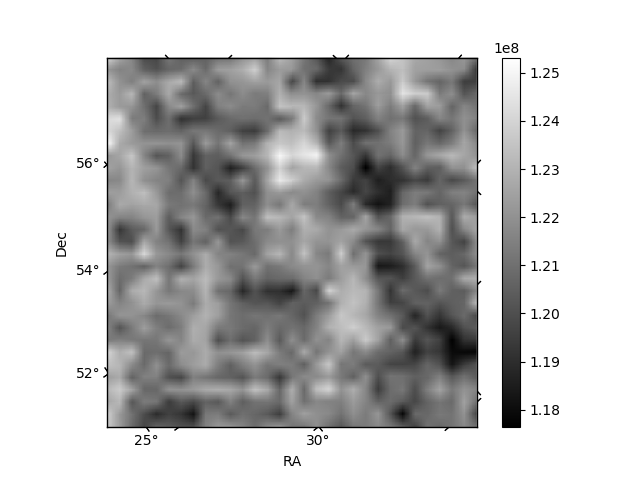
| Quadrant A | 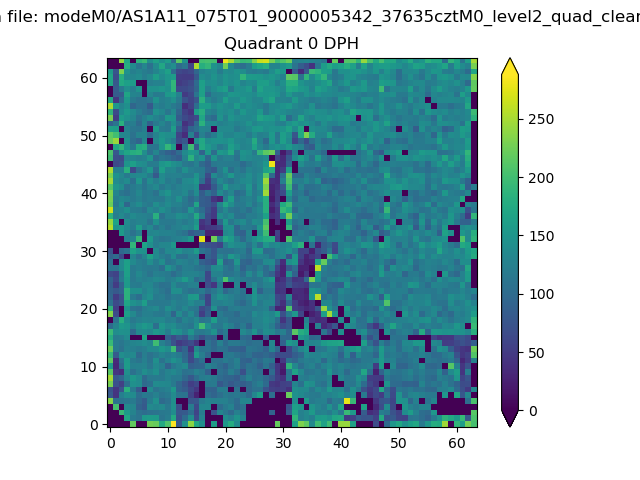 |
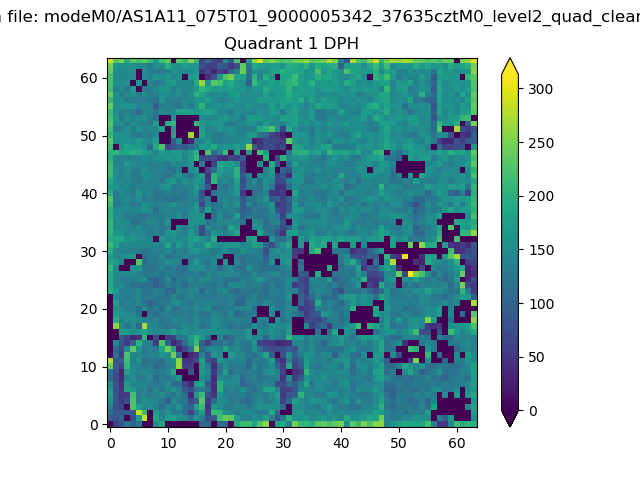 |
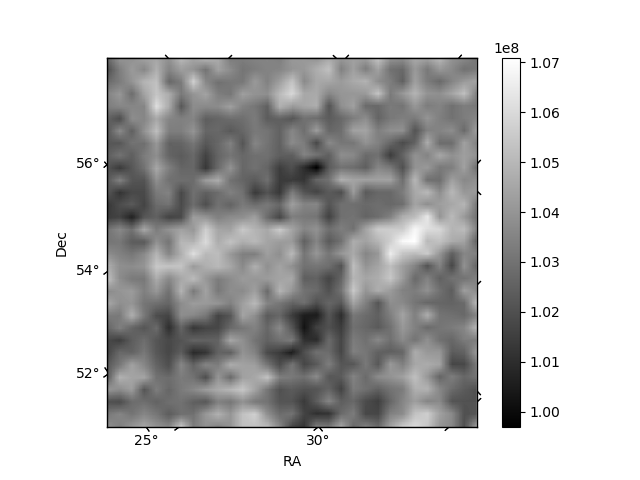
Quadrant B |
|---|---|---|---|
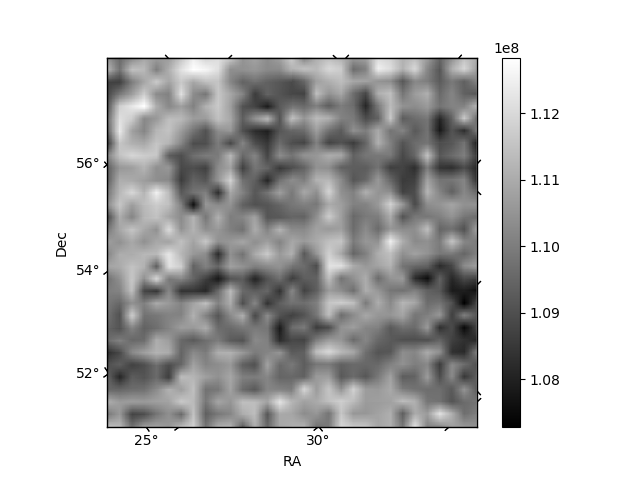
| Quadrant D | 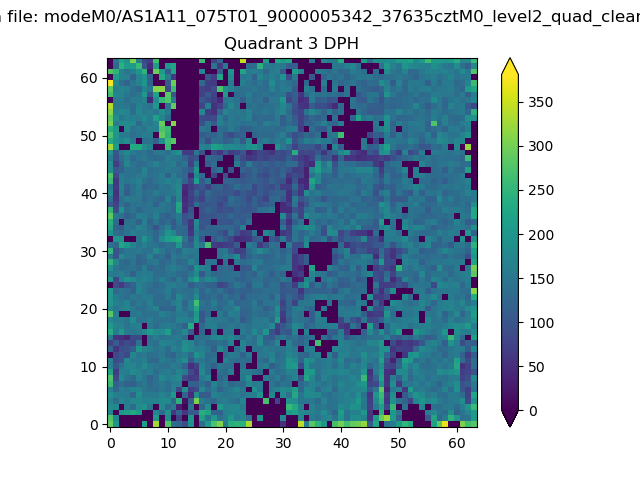 |
 |
Quadrant C |
| Plot type | Count rate plots | Images |
|---|---|---|
| Comparison with Poisson distribution Blue bars denote a histogram of data divided into 1 sec bins. Red curve is a Poisson curve with rate = median count rate of data. |
 |
 |
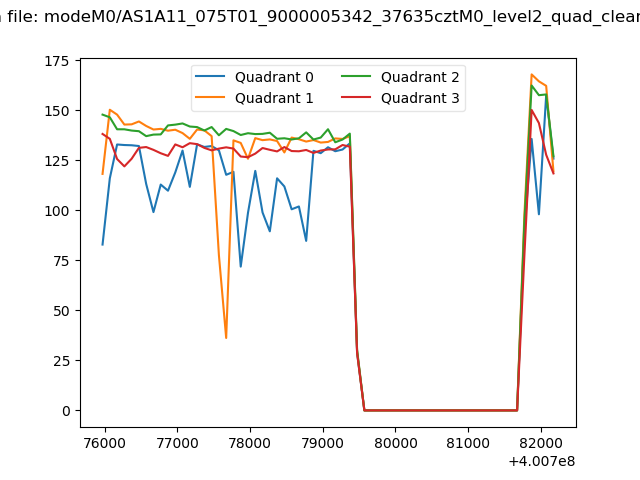
| Quadrant-wise count rates Data is divided into 100 sec bins |
 |
|
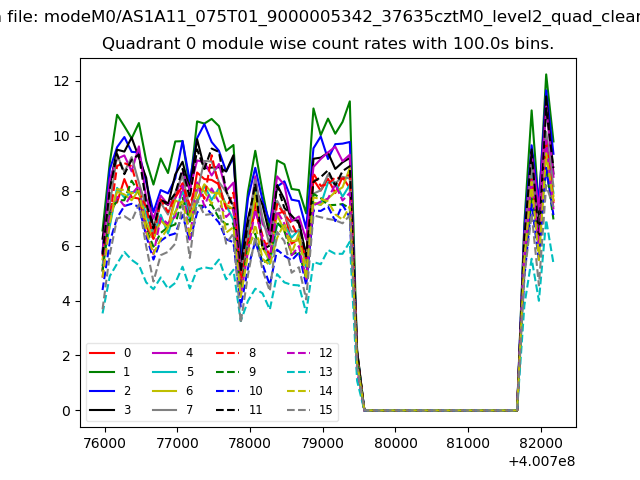
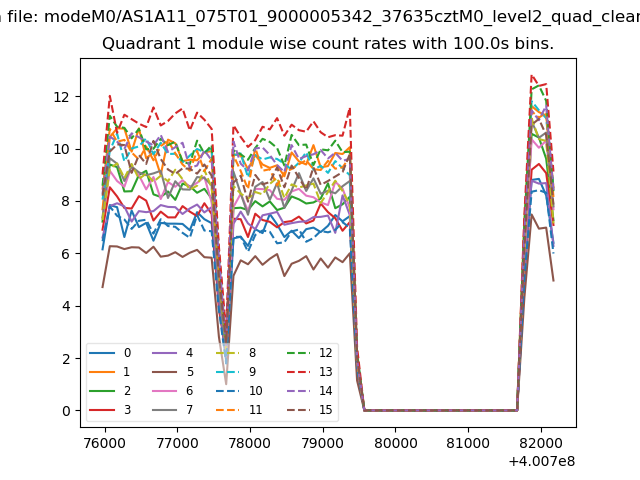
| Module-wise count rates for Quadrant A Data is divided into 100 sec bins |
 |
 |
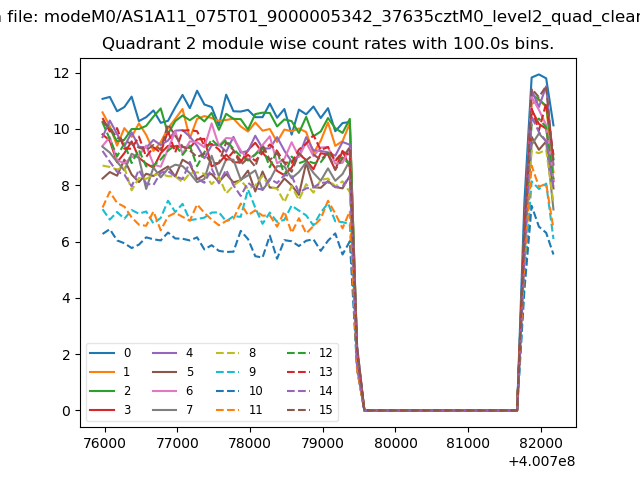
| Module-wise count rates for Quadrant B Data is divided into 100 sec bins |
 |
 |
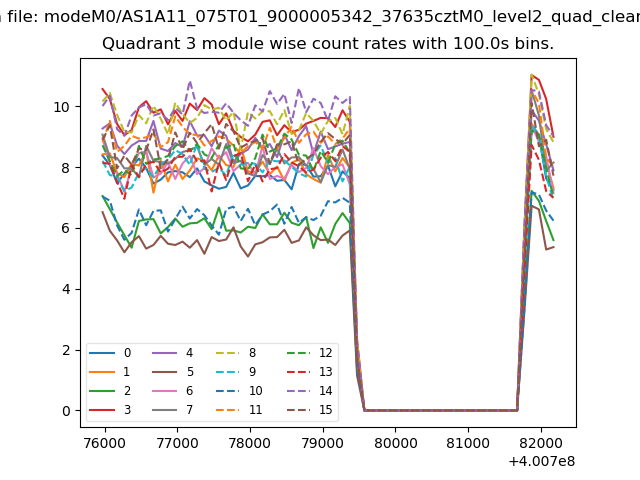
| Module-wise count rates for Quadrant C Data is divided into 100 sec bins |
 |
 |
| Module-wise count rates for Quadrant D Data is divided into 100 sec bins |
 |
 |
| Parameter | Plot |
|---|---|
| CZT HV Monitor | 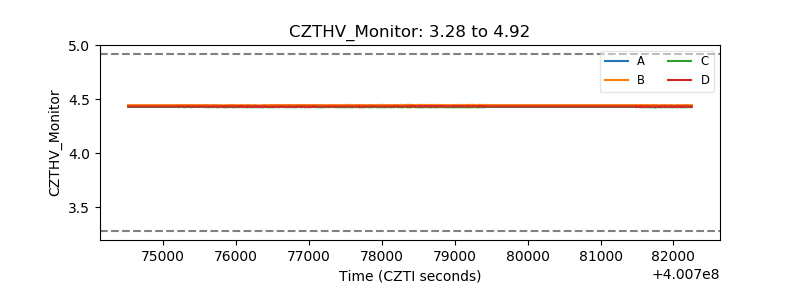 |
| D_VDD | 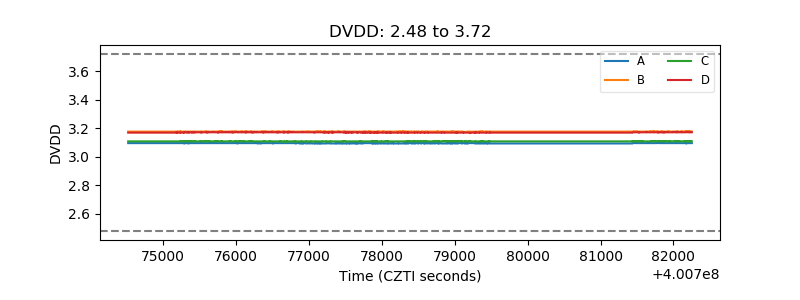 |
| Temperature 1 | 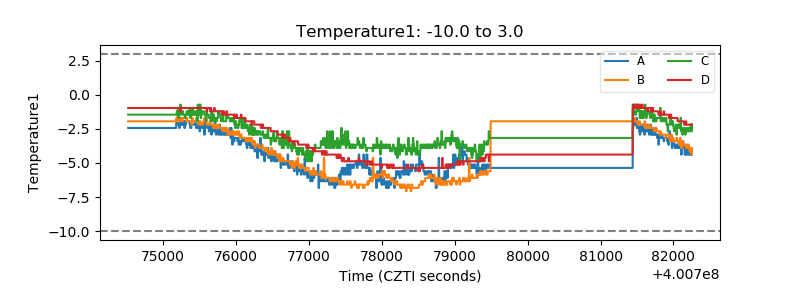 |
| Veto HV Monitor | 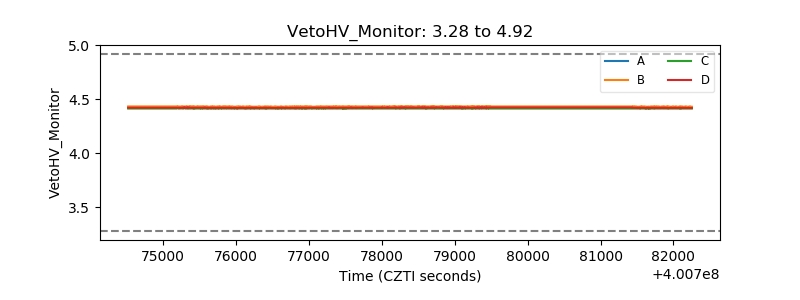 |
| Veto LLD | 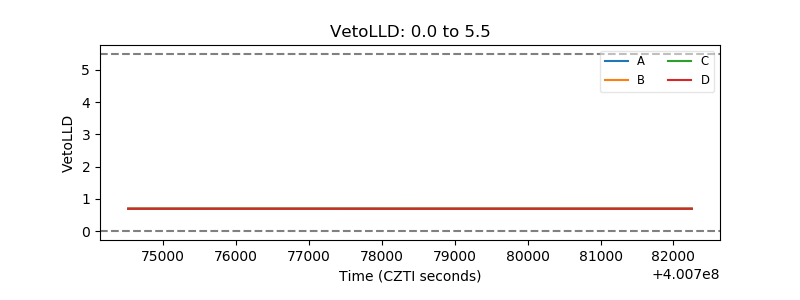 |
| Alpha Counter | 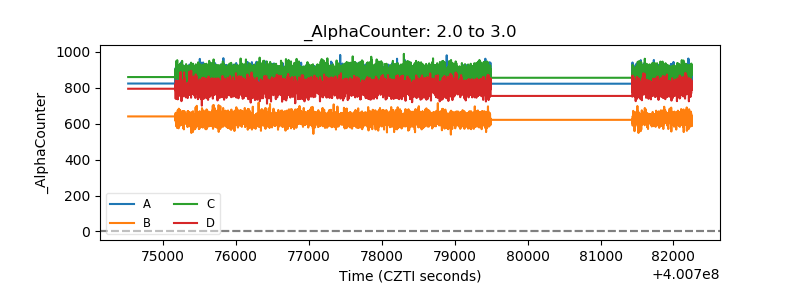 |
| _CPM_Rate | 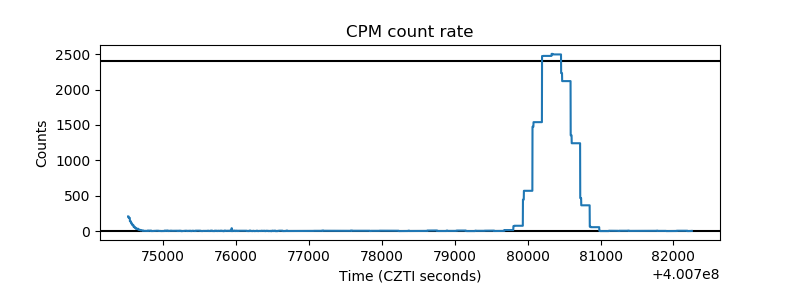 |
| CZT Counter | 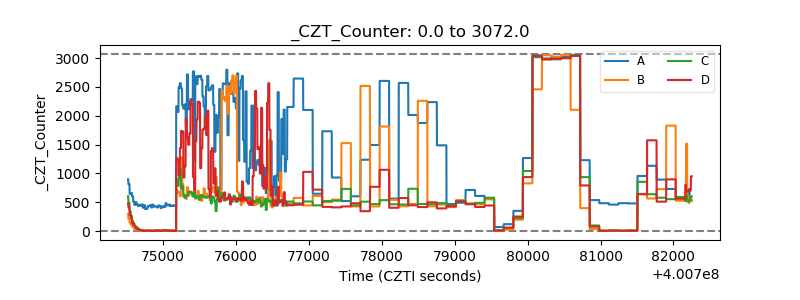 |
| +2.5 Volts monitor | 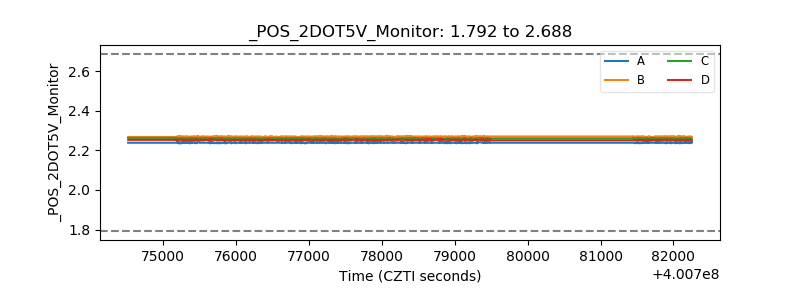 |
| +5 Volts monitor | 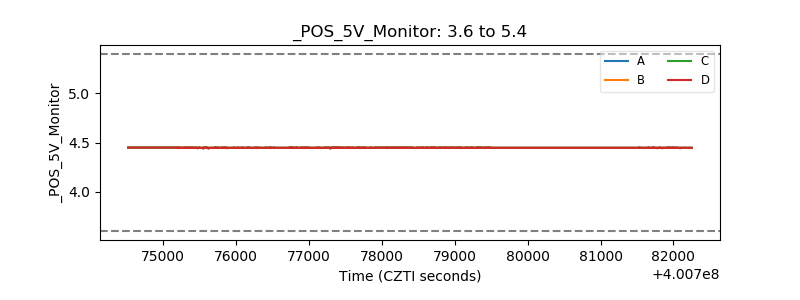 |
| _ROLL_ROT | 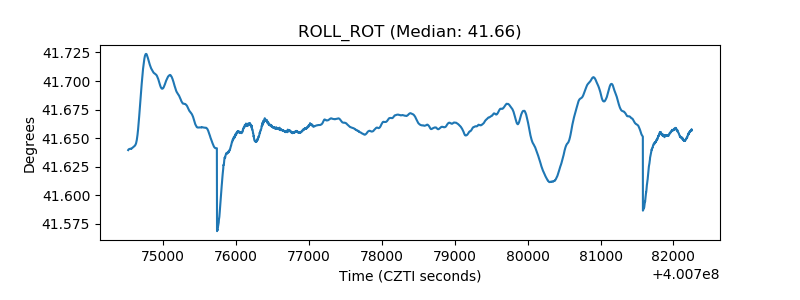 |
| _Roll_DEC | 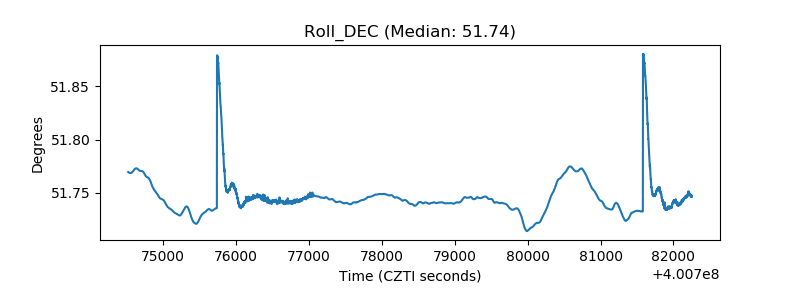 |
| _Roll_RA | 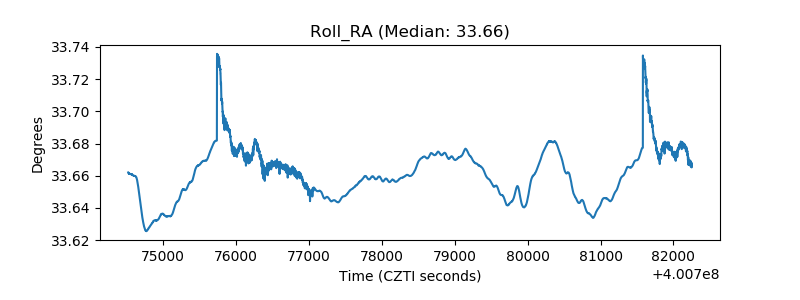 |
| Veto Counter | 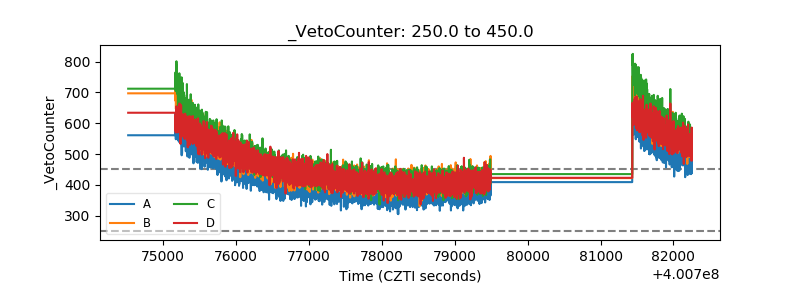 |