| Param | Original file | Final file |
|---|---|---|
| Filename | modeM0/AS1A11_075T01_9000005342_37636cztM0_level2.evt | modeM0/AS1A11_075T01_9000005342_37636cztM0_level2_quad_clean.evt |
| Size (bytes) | 454,008,960 | 98,305,920 |
| Size | 433.0 MB | 93.8 MB |
| Events in quadrant A | 3,167,490 | 651,972 |
| Events in quadrant B | 2,853,199 | 681,919 |
| Events in quadrant C | 2,865,327 | 681,277 |
| Events in quadrant D | 4,525,625 | 612,573 |
| Mode SS | |||
|---|---|---|---|
| Quadrant | BADHDUFLAG | Total packets | Discarded packets |
| A | 0 | 102 | 0 |
| B | 0 | 102 | 0 |
| C | 0 | 102 | 0 |
| D | 0 | 102 | 0 |
| Mode M0 | |||
|---|---|---|---|
| Quadrant | BADHDUFLAG | Total packets | Discarded packets |
| A | 0 | 12509 | 3 |
| B | 0 | 11558 | 2 |
| C | 0 | 11549 | 2 |
| D | 0 | 16866 | 2 |
| Mode M9 | |||
|---|---|---|---|
| Quadrant | BADHDUFLAG | Total packets | Discarded packets |
| A | 0 | 25 | 0 |
| B | 0 | 25 | 0 |
| C | 0 | 25 | 0 |
| D | 0 | 26 | 0 |
| Quadrant | Total seconds | Saturated seconds | Saturation percentage |
|---|---|---|---|
| A | 4980 | 163 | 3.273092% |
| B | 4980 | 69 | 1.385542% |
| C | 4980 | 45 | 0.903614% |
| D | 4980 | 516 | 10.361446% |
Noise dominated data is calculated using 1-second bins in cleaned event files. If a bin has >2000 counts, and if more than 50% of those come from <1% of pixels, then it is considered to be noise-dominated and hence unusable.
| Quadrant | # 1 sec bins | Bins with >0 counts | Bins with >2000 counts | High rate bins dominated by noise | Noise dominated (total time) | Noise dominated (detector-on time) | Marked lightcurve |
|---|---|---|---|---|---|---|---|
| A | 7043 | 4981 | 125 | 125 | 1.77% | 2.51% | 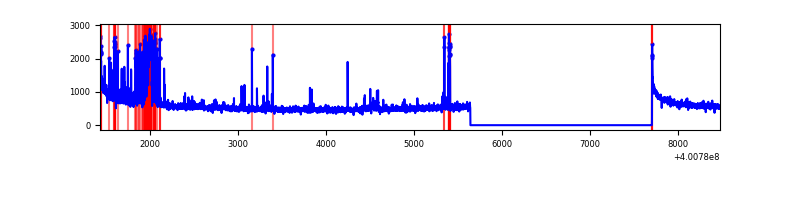 |
| B | 7042 | 4979 | 47 | 47 | 0.67% | 0.94% | 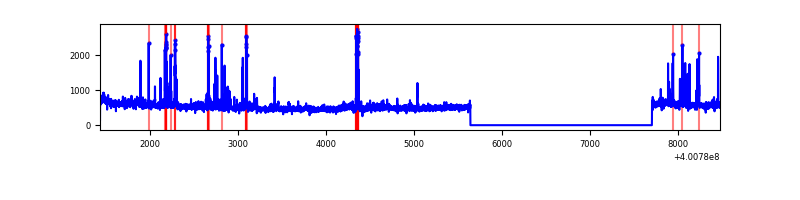 |
| C | 7042 | 4979 | 31 | 31 | 0.44% | 0.62% | 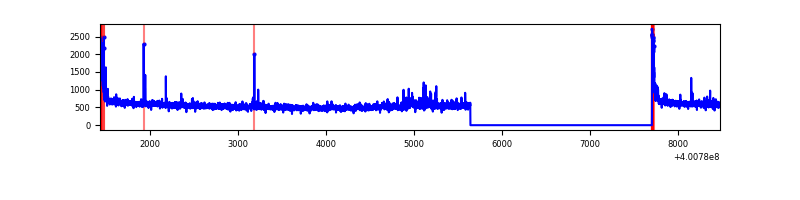 |
| D | 7042 | 4979 | 564 | 564 | 8.01% | 11.33% | 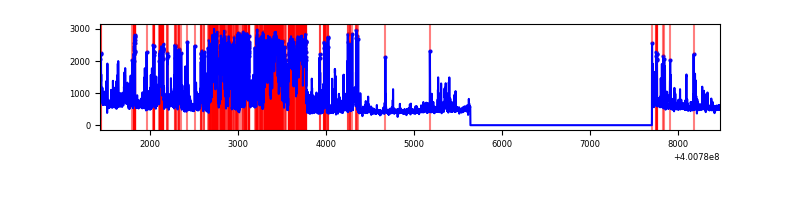 |
Top three noisy pixels from each quadrant. If the there are fewer than three noisy pixels in the level2.evt file, extra rows are filled as -1
| Pixel properties | Quadrant properties | ||||||
|---|---|---|---|---|---|---|---|
| Quadrant | DetID | PixID | Counts | Sigma | Mean | Median | Sigma |
| A | 15 | 222 | 384245 | 3119.75 | 614 | 603 | 123.0 |
| A | 10 | 83 | 302979 | 2458.9 | 614 | 603 | 123.0 |
| A | 9 | 143 | 81544 | 658.21 | 614 | 603 | 123.0 |
| B | 5 | 172 | 96104 | 816.03 | 628 | 613 | 117.0 |
| B | 15 | 85 | 62787 | 531.32 | 628 | 613 | 117.0 |
| B | 10 | 245 | 50133 | 423.18 | 628 | 613 | 117.0 |
| C | 15 | 214 | 230805 | 1589.6 | 624 | 629 | 144.8 |
| C | 0 | 10 | 105554 | 724.62 | 624 | 629 | 144.8 |
| C | 12 | 250 | 69675 | 476.83 | 624 | 629 | 144.8 |
| D | 2 | 249 | 924091 | 6385.24 | 600 | 583 | 144.6 |
| D | 12 | 227 | 749181 | 5175.89 | 600 | 583 | 144.6 |
| D | 2 | 153 | 195995 | 1351.1 | 600 | 583 | 144.6 |
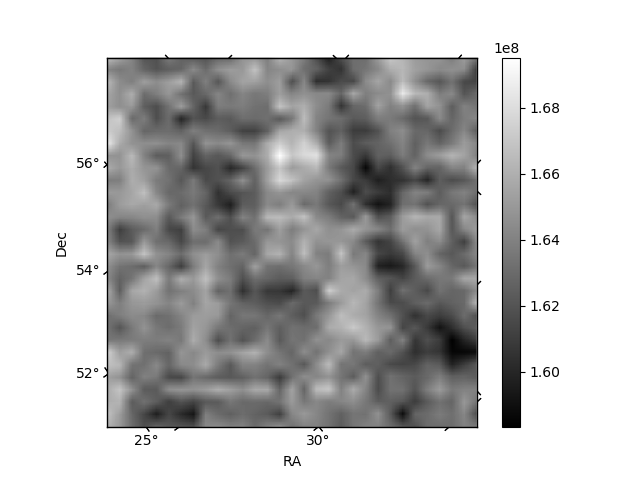
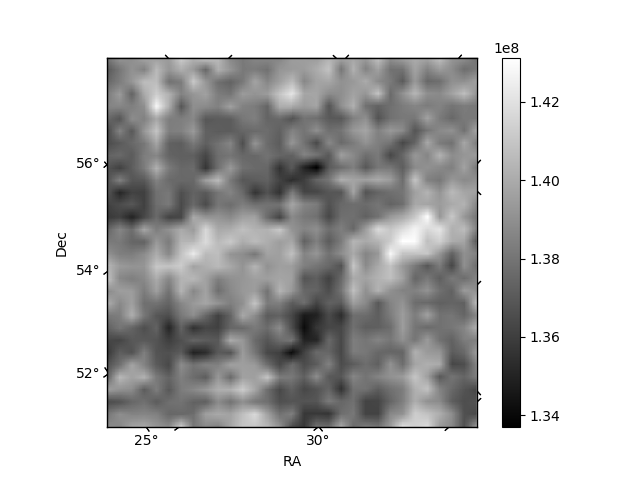
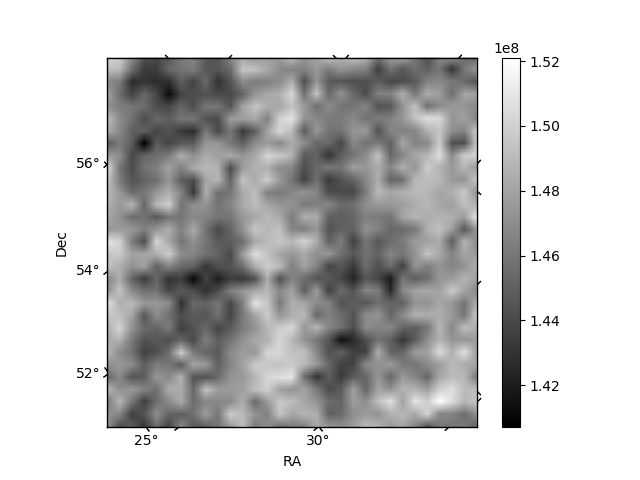
Histogram calculated using DETX and DETY for each event in the final _common_clean file
| Quadrant A | 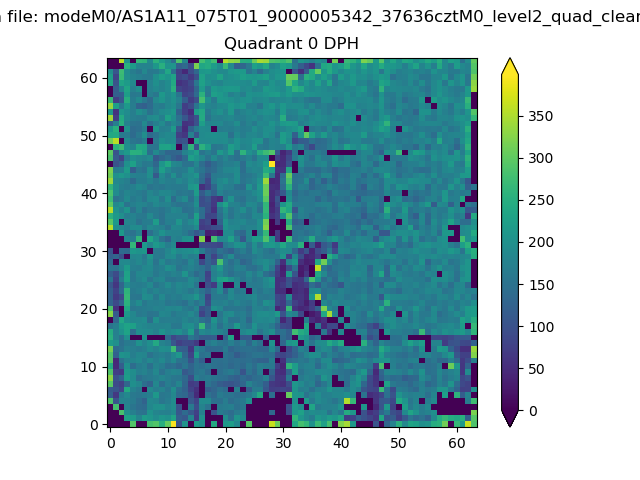 |
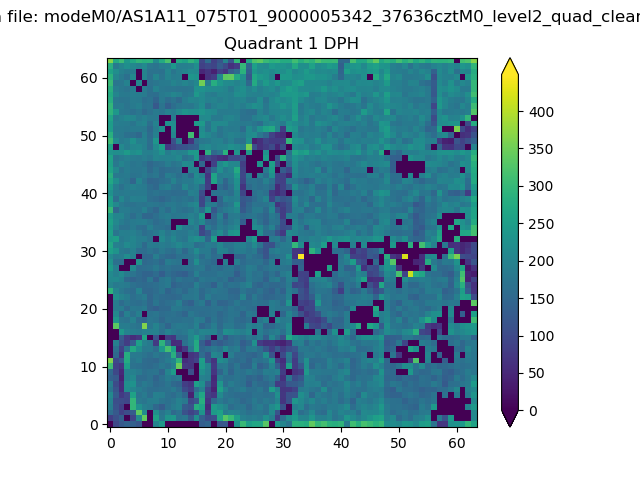 |
Quadrant B |
|---|---|---|---|
| Quadrant D | 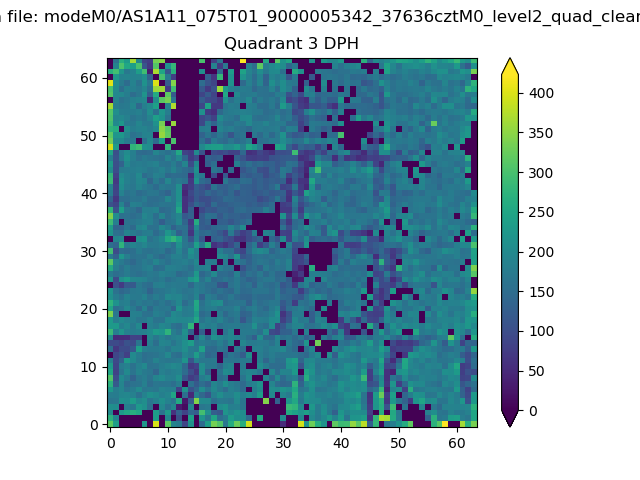 |
 |
Quadrant C |
| Plot type | Count rate plots | Images |
|---|---|---|
| Comparison with Poisson distribution Blue bars denote a histogram of data divided into 1 sec bins. Red curve is a Poisson curve with rate = median count rate of data. |
 |
 |
| Quadrant-wise count rates Data is divided into 100 sec bins |
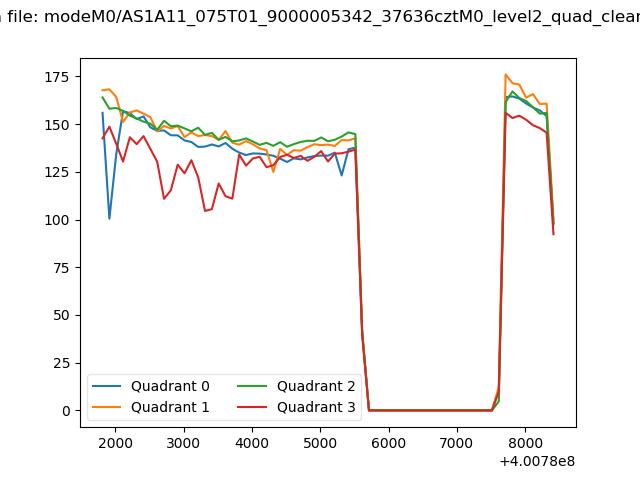 |
|
| Module-wise count rates for Quadrant A Data is divided into 100 sec bins |
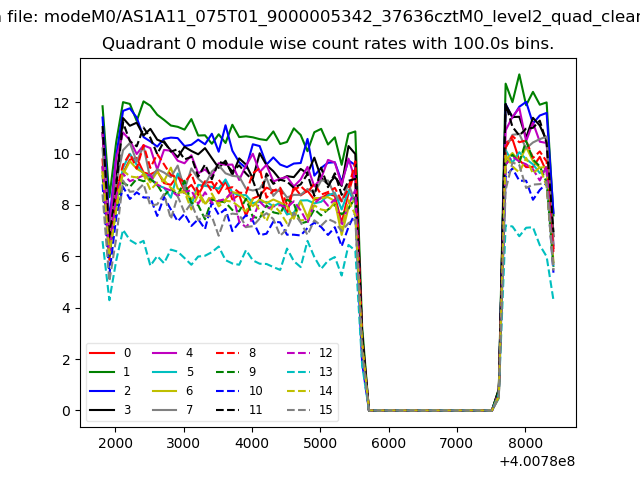 |
 |
| Module-wise count rates for Quadrant B Data is divided into 100 sec bins |
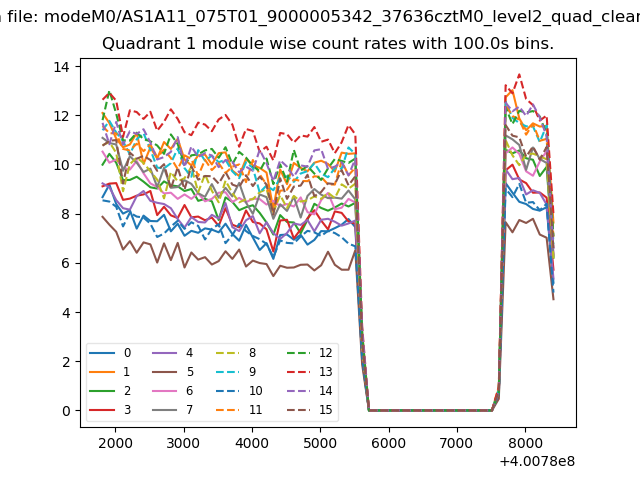 |
 |
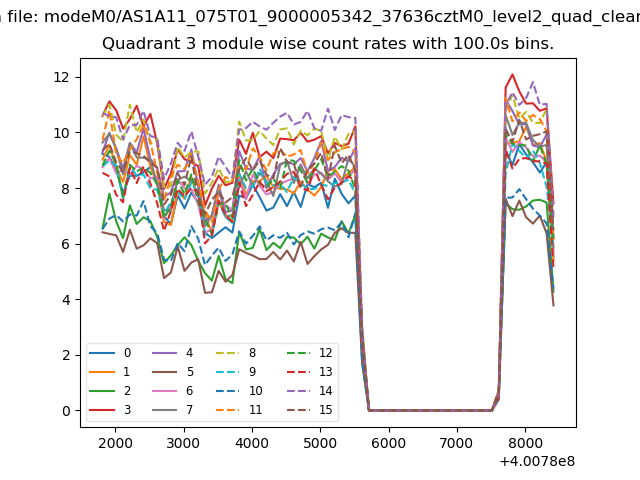
| Module-wise count rates for Quadrant C Data is divided into 100 sec bins |
 |
 |
| Module-wise count rates for Quadrant D Data is divided into 100 sec bins |
 |
 |
| Parameter | Plot |
|---|---|
| CZT HV Monitor |  |
| D_VDD | 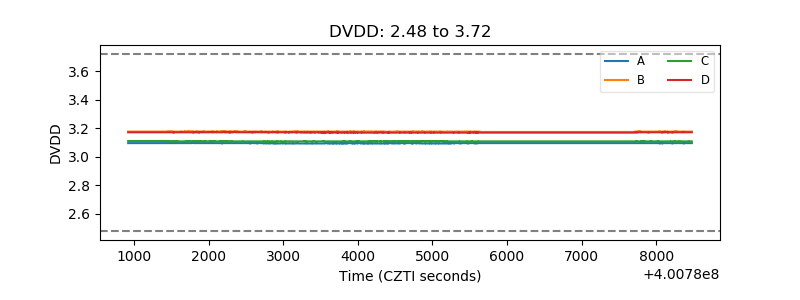 |
| Temperature 1 | 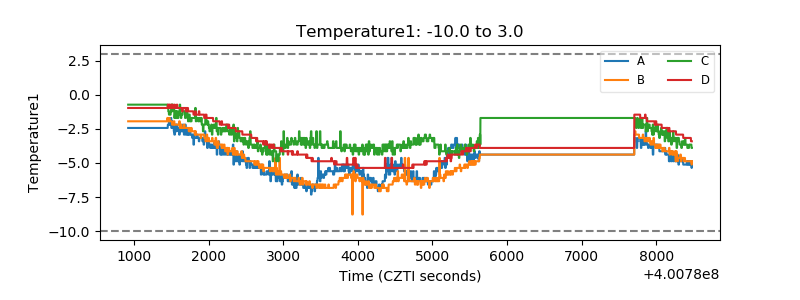 |
| Veto HV Monitor | 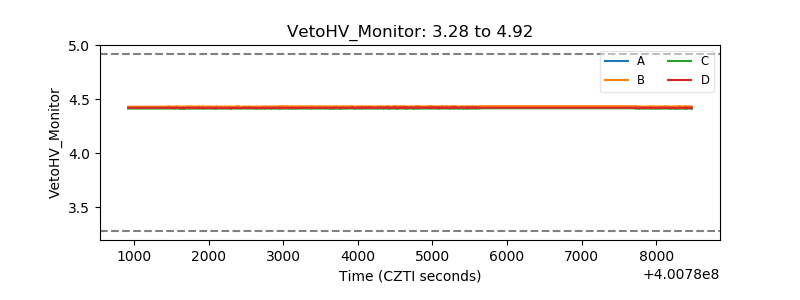 |
| Veto LLD | 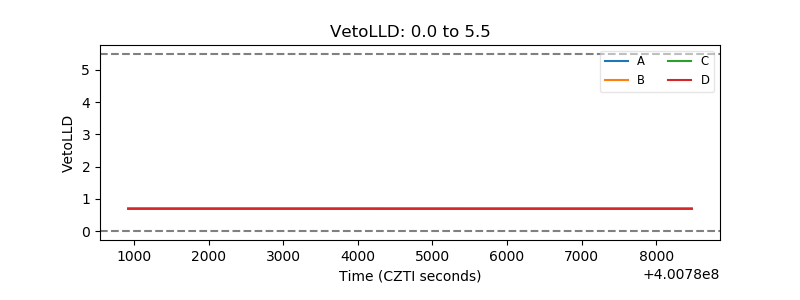 |
| Alpha Counter | 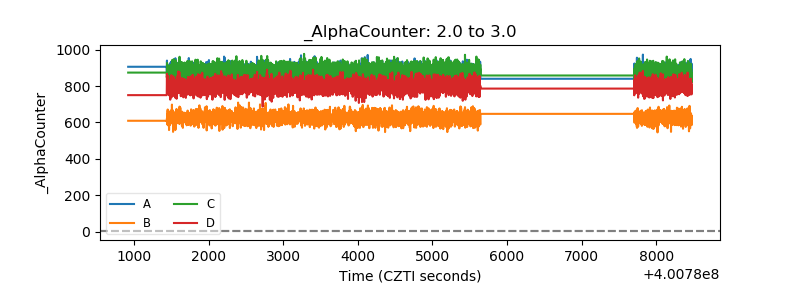 |
| _CPM_Rate | 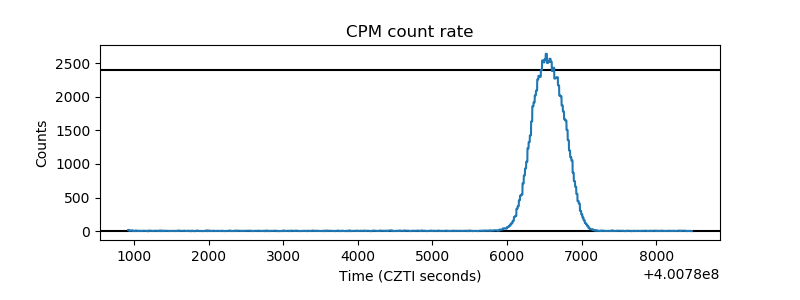 |
| CZT Counter |  |
| +2.5 Volts monitor | 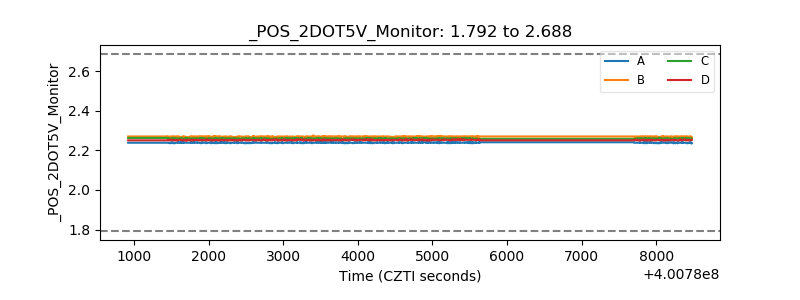 |
| +5 Volts monitor |  |
| _ROLL_ROT | 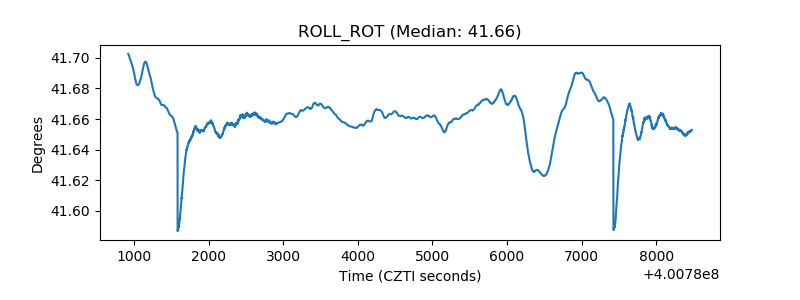 |
| _Roll_DEC | 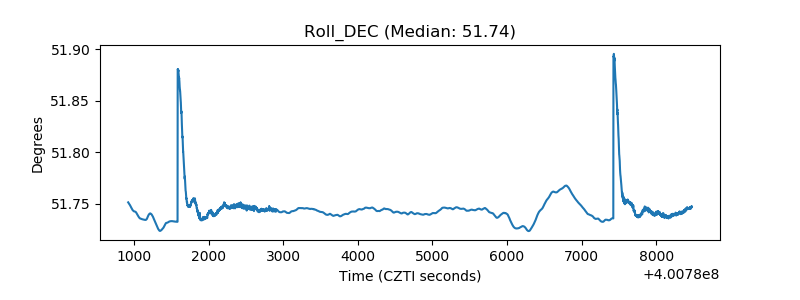 |
| _Roll_RA | 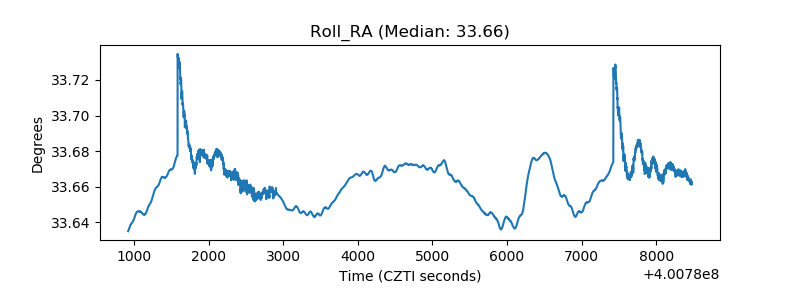 |
| Veto Counter | 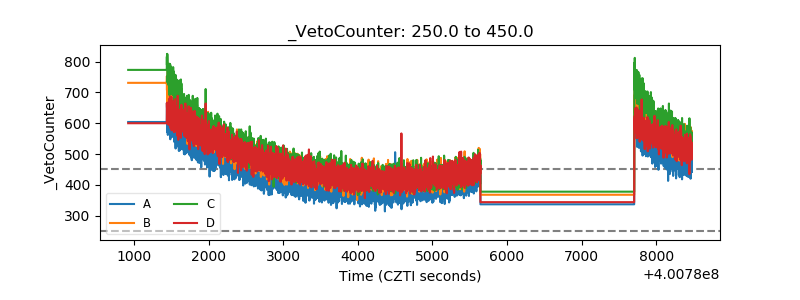 |