| Param | Original file | Final file |
|---|---|---|
| Filename | modeM0/AS1A11_075T01_9000005342_37637cztM0_level2.evt | modeM0/AS1A11_075T01_9000005342_37637cztM0_level2_quad_clean.evt |
| Size (bytes) | 400,423,680 | 97,971,840 |
| Size | 381.9 MB | 93.4 MB |
| Events in quadrant A | 2,766,724 | 649,551 |
| Events in quadrant B | 2,711,314 | 674,047 |
| Events in quadrant C | 2,801,656 | 676,637 |
| Events in quadrant D | 3,511,525 | 620,581 |
| Mode SS | |||
|---|---|---|---|
| Quadrant | BADHDUFLAG | Total packets | Discarded packets |
| A | 0 | 104 | 0 |
| B | 0 | 104 | 0 |
| C | 0 | 104 | 0 |
| D | 0 | 104 | 0 |
| Mode M0 | |||
|---|---|---|---|
| Quadrant | BADHDUFLAG | Total packets | Discarded packets |
| A | 0 | 11279 | 3 |
| B | 0 | 11089 | 2 |
| C | 0 | 11212 | 2 |
| D | 0 | 13631 | 2 |
| Mode M9 | |||
|---|---|---|---|
| Quadrant | BADHDUFLAG | Total packets | Discarded packets |
| A | 0 | 41 | 0 |
| B | 0 | 41 | 0 |
| C | 0 | 41 | 0 |
| D | 0 | 41 | 0 |
| Quadrant | Total seconds | Saturated seconds | Saturation percentage |
|---|---|---|---|
| A | 4933 | 24 | 0.486519% |
| B | 4933 | 34 | 0.689236% |
| C | 4933 | 33 | 0.668964% |
| D | 4933 | 191 | 3.871883% |
Noise dominated data is calculated using 1-second bins in cleaned event files. If a bin has >2000 counts, and if more than 50% of those come from <1% of pixels, then it is considered to be noise-dominated and hence unusable.
| Quadrant | # 1 sec bins | Bins with >0 counts | Bins with >2000 counts | High rate bins dominated by noise | Noise dominated (total time) | Noise dominated (detector-on time) | Marked lightcurve |
|---|---|---|---|---|---|---|---|
| A | 9119 | 4935 | 21 | 21 | 0.23% | 0.43% | 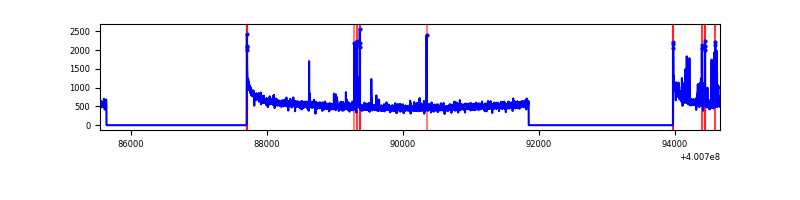 |
| B | 9119 | 4933 | 23 | 23 | 0.25% | 0.47% | 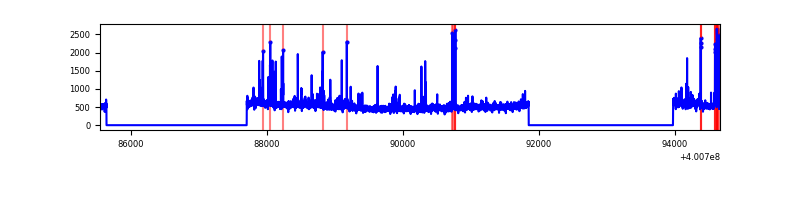 |
| C | 9119 | 4933 | 20 | 20 | 0.22% | 0.41% | 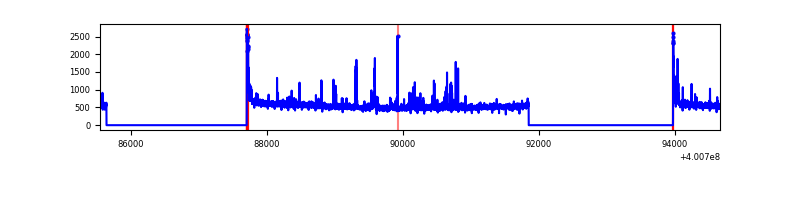 |
| D | 9119 | 4933 | 213 | 213 | 2.34% | 4.32% | 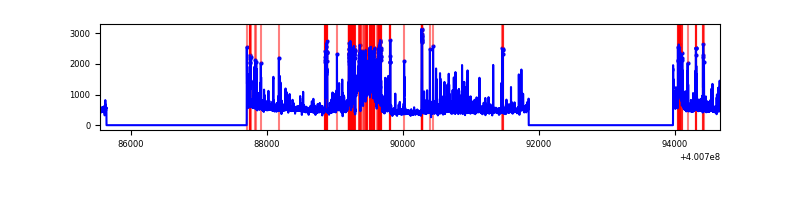 |
Top three noisy pixels from each quadrant. If the there are fewer than three noisy pixels in the level2.evt file, extra rows are filled as -1
| Pixel properties | Quadrant properties | ||||||
|---|---|---|---|---|---|---|---|
| Quadrant | DetID | PixID | Counts | Sigma | Mean | Median | Sigma |
| A | 10 | 83 | 301568 | 2520.5 | 598 | 587 | 119.4 |
| A | 15 | 222 | 68917 | 572.21 | 598 | 587 | 119.4 |
| A | 9 | 143 | 49603 | 410.47 | 598 | 587 | 119.4 |
| B | 5 | 172 | 82126 | 708.74 | 606 | 590 | 115.0 |
| B | 0 | 213 | 50458 | 433.47 | 606 | 590 | 115.0 |
| B | 0 | 190 | 40110 | 343.52 | 606 | 590 | 115.0 |
| C | 15 | 214 | 226958 | 1632.62 | 603 | 609 | 138.6 |
| C | 14 | 254 | 91391 | 654.8 | 603 | 609 | 138.6 |
| C | 0 | 10 | 82727 | 592.31 | 603 | 609 | 138.6 |
| D | 2 | 249 | 718202 | 5114.09 | 586 | 573 | 140.3 |
| D | 2 | 250 | 321322 | 2285.77 | 586 | 573 | 140.3 |
| D | 13 | 249 | 70264 | 496.64 | 586 | 573 | 140.3 |
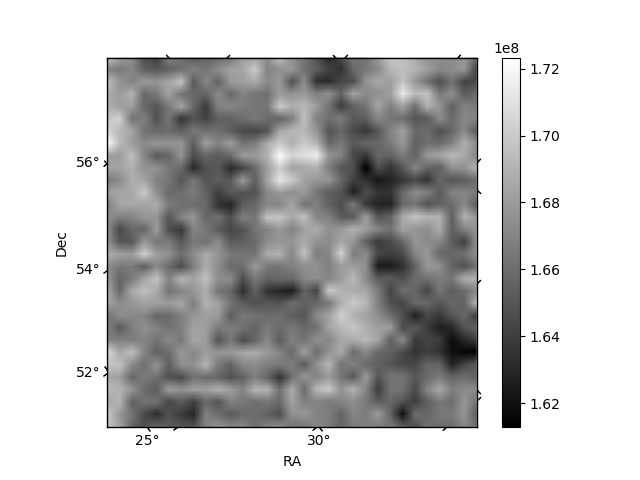
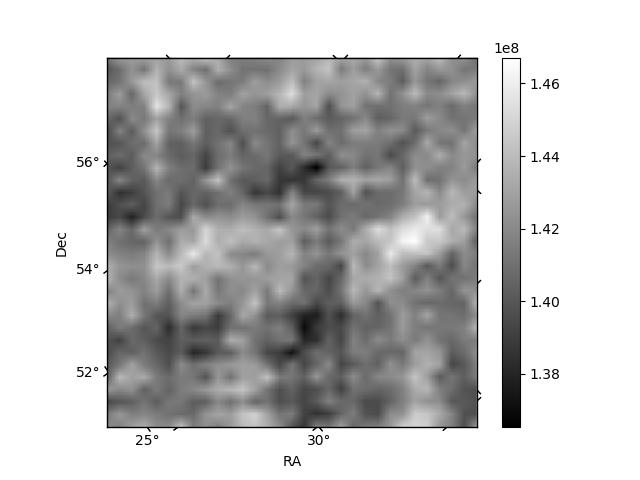
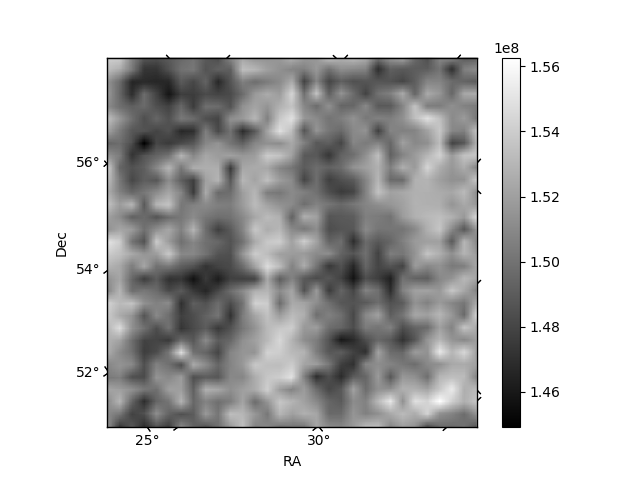
Histogram calculated using DETX and DETY for each event in the final _common_clean file
| Quadrant A | 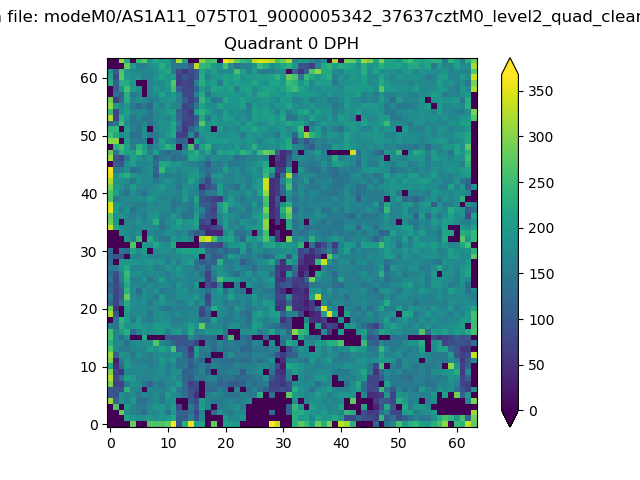 |
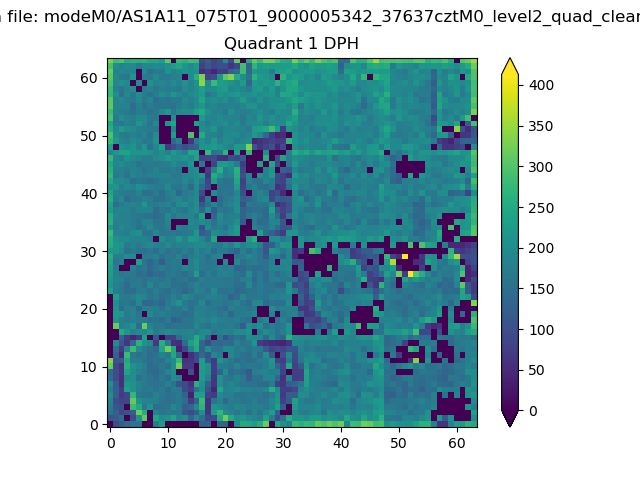 |
Quadrant B |
|---|---|---|---|
| Quadrant D | 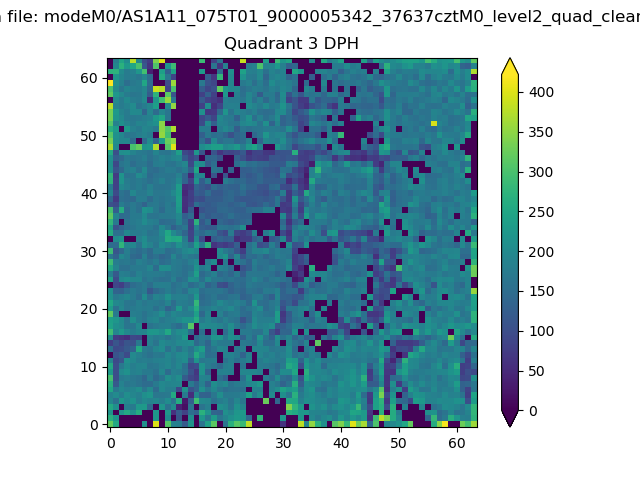 |
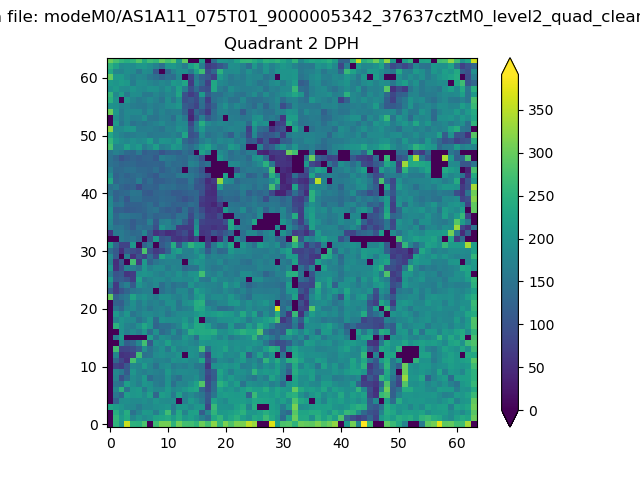 |
Quadrant C |
| Plot type | Count rate plots | Images |
|---|---|---|
| Comparison with Poisson distribution Blue bars denote a histogram of data divided into 1 sec bins. Red curve is a Poisson curve with rate = median count rate of data. |
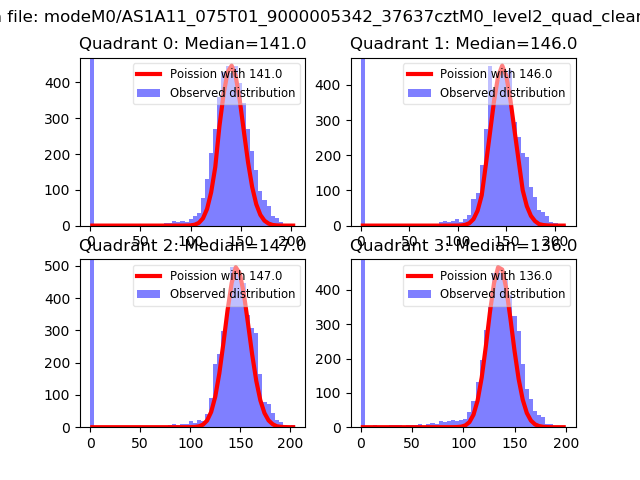 |
 |
| Quadrant-wise count rates Data is divided into 100 sec bins |
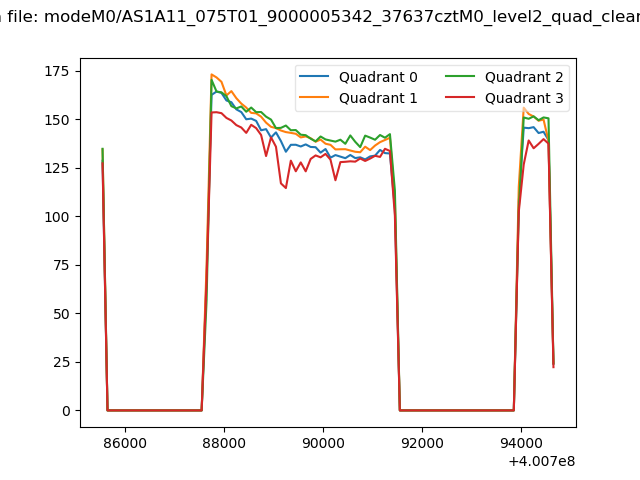 |
|
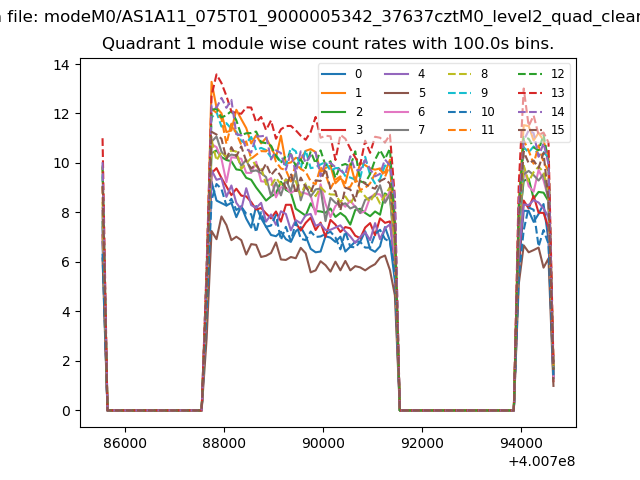
| Module-wise count rates for Quadrant A Data is divided into 100 sec bins |
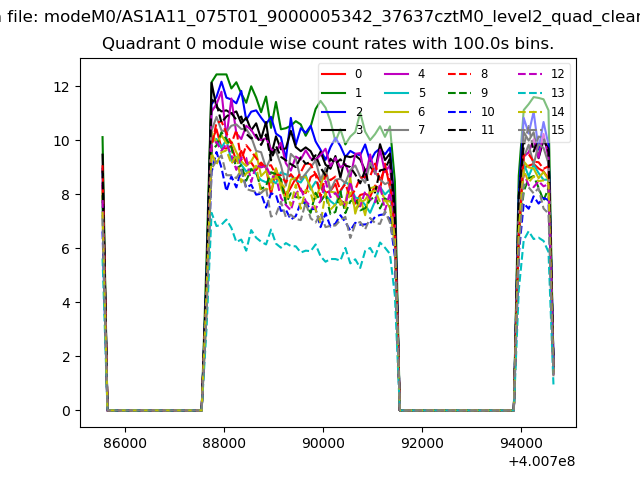 |
 |
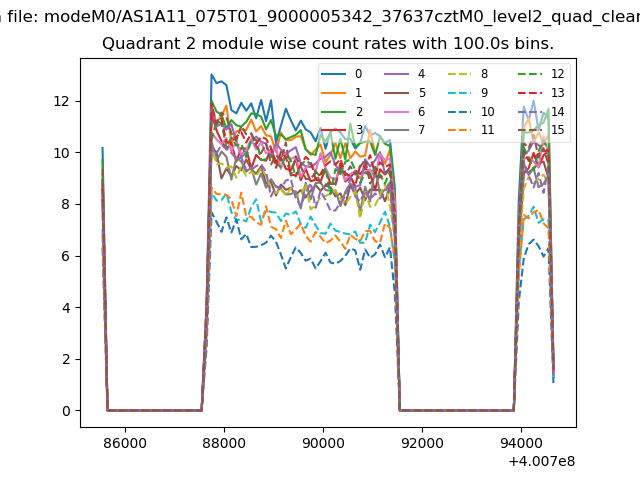
| Module-wise count rates for Quadrant B Data is divided into 100 sec bins |
 |
 |
| Module-wise count rates for Quadrant C Data is divided into 100 sec bins |
 |
 |
| Module-wise count rates for Quadrant D Data is divided into 100 sec bins |
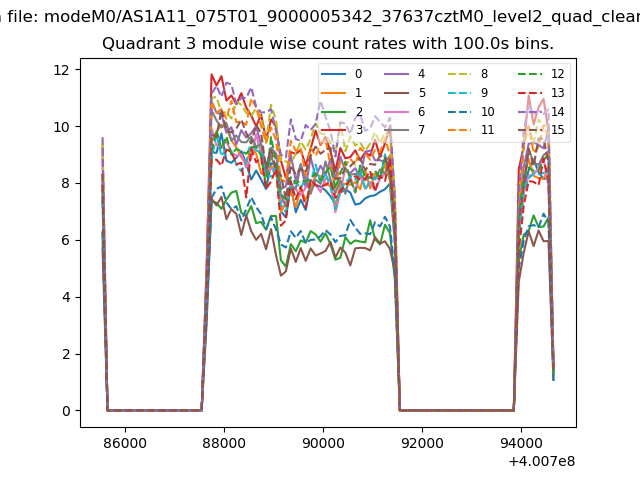 |
 |
| Parameter | Plot |
|---|---|
| CZT HV Monitor | 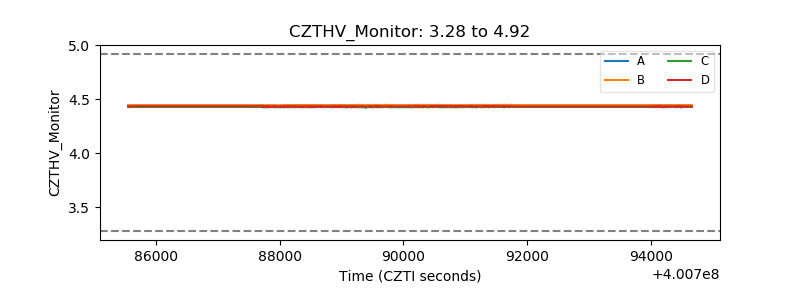 |
| D_VDD | 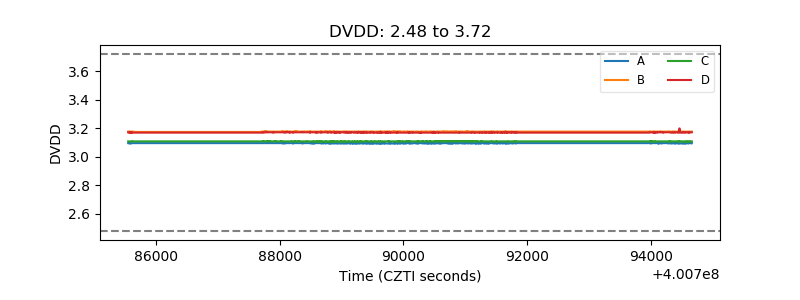 |
| Temperature 1 | 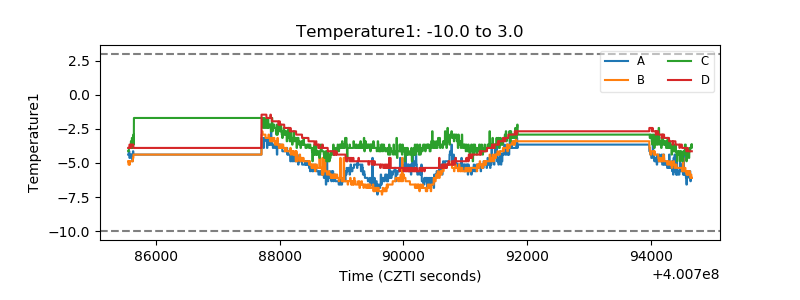 |
| Veto HV Monitor | 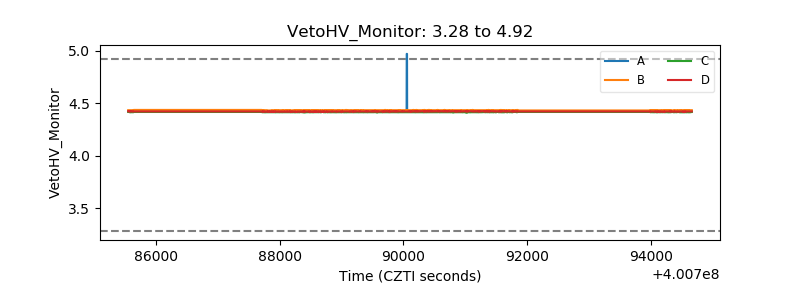 |
| Veto LLD | 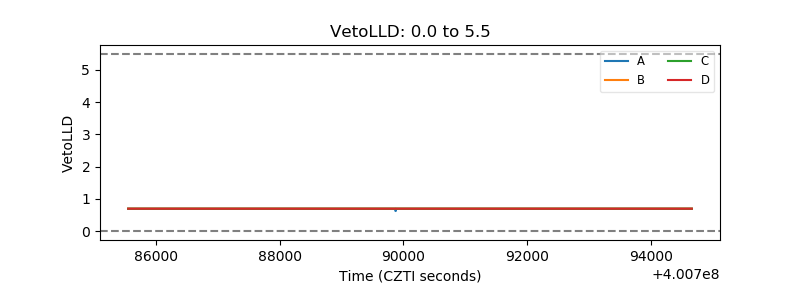 |
| Alpha Counter | 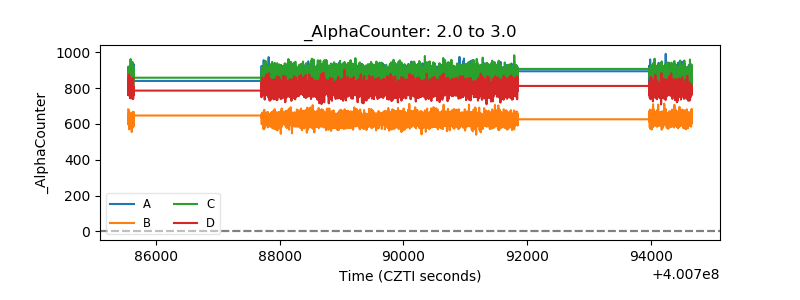 |
| _CPM_Rate | 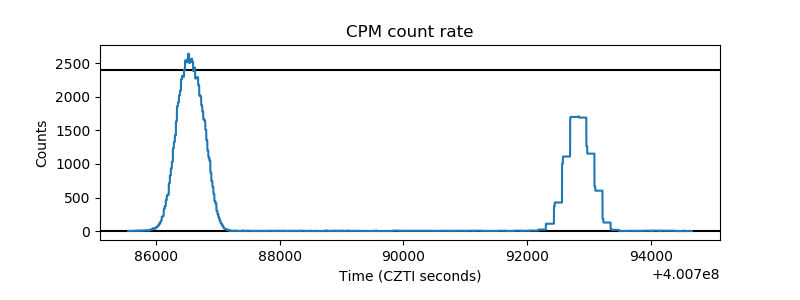 |
| CZT Counter | 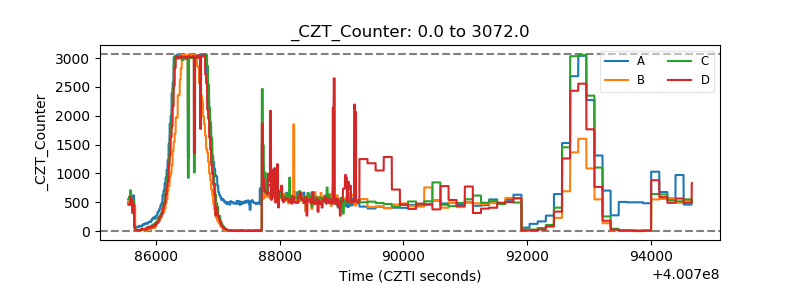 |
| +2.5 Volts monitor | 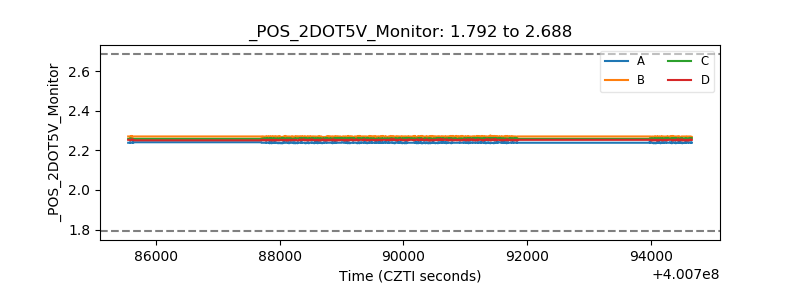 |
| +5 Volts monitor | 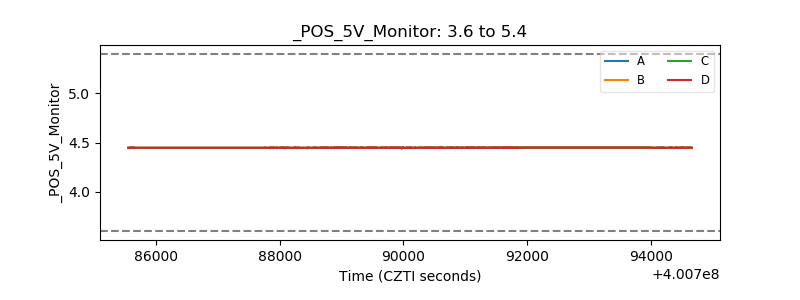 |
| _ROLL_ROT | 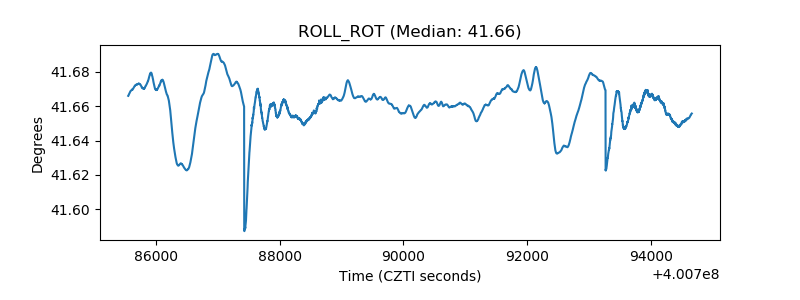 |
| _Roll_DEC | 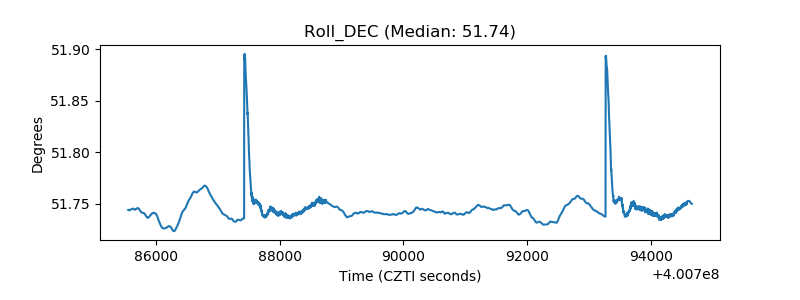 |
| _Roll_RA |  |
| Veto Counter | 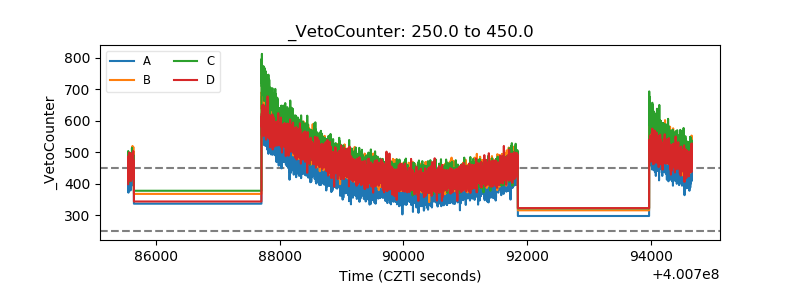 |