| Param | Original file | Final file |
|---|---|---|
| Filename | modeM0/AS1A11_075T01_9000005342_37638cztM0_level2.evt | modeM0/AS1A11_075T01_9000005342_37638cztM0_level2_quad_clean.evt |
| Size (bytes) | 515,079,360 | 90,483,840 |
| Size | 491.2 MB | 86.3 MB |
| Events in quadrant A | 4,970,702 | 536,774 |
| Events in quadrant B | 3,125,064 | 616,894 |
| Events in quadrant C | 2,938,158 | 626,014 |
| Events in quadrant D | 4,187,100 | 570,066 |
| Mode SS | |||
|---|---|---|---|
| Quadrant | BADHDUFLAG | Total packets | Discarded packets |
| A | 0 | 116 | 0 |
| B | 0 | 116 | 0 |
| C | 0 | 116 | 0 |
| D | 0 | 116 | 0 |
| Mode M0 | |||
|---|---|---|---|
| Quadrant | BADHDUFLAG | Total packets | Discarded packets |
| A | 0 | 18334 | 3 |
| B | 0 | 12802 | 2 |
| C | 0 | 11922 | 2 |
| D | 0 | 16178 | 2 |
| Mode M9 | |||
|---|---|---|---|
| Quadrant | BADHDUFLAG | Total packets | Discarded packets |
| A | 0 | 42 | 0 |
| B | 0 | 42 | 0 |
| C | 0 | 42 | 0 |
| D | 0 | 42 | 0 |
| Quadrant | Total seconds | Saturated seconds | Saturation percentage |
|---|---|---|---|
| A | 5574 | 976 | 17.509867% |
| B | 5574 | 55 | 0.986724% |
| C | 5574 | 35 | 0.627915% |
| D | 5574 | 154 | 2.762827% |
Noise dominated data is calculated using 1-second bins in cleaned event files. If a bin has >2000 counts, and if more than 50% of those come from <1% of pixels, then it is considered to be noise-dominated and hence unusable.
| Quadrant | # 1 sec bins | Bins with >0 counts | Bins with >2000 counts | High rate bins dominated by noise | Noise dominated (total time) | Noise dominated (detector-on time) | Marked lightcurve |
|---|---|---|---|---|---|---|---|
| A | 9819 | 5576 | 707 | 707 | 7.20% | 12.68% | 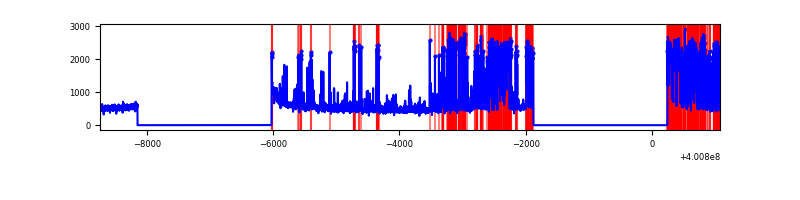 |
| B | 9819 | 5574 | 45 | 45 | 0.46% | 0.81% | 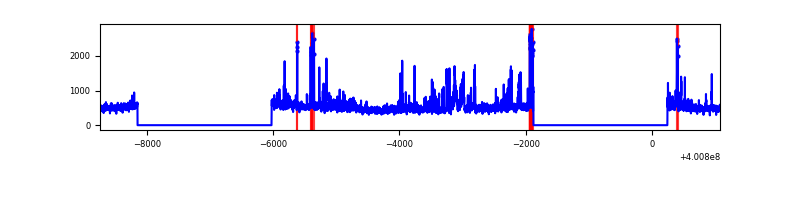 |
| C | 9819 | 5574 | 30 | 30 | 0.31% | 0.54% | 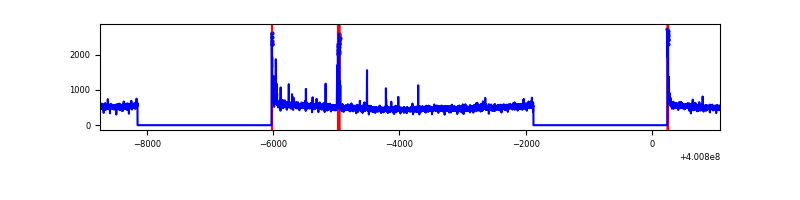 |
| D | 9819 | 5574 | 218 | 218 | 2.22% | 3.91% | 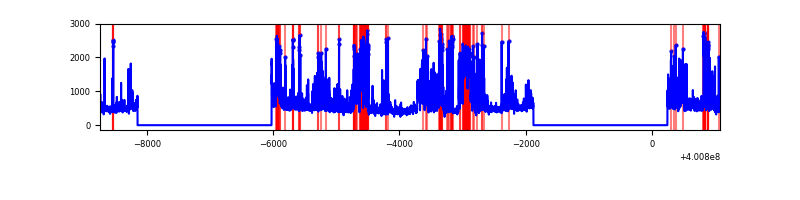 |
Top three noisy pixels from each quadrant. If the there are fewer than three noisy pixels in the level2.evt file, extra rows are filled as -1
| Pixel properties | Quadrant properties | ||||||
|---|---|---|---|---|---|---|---|
| Quadrant | DetID | PixID | Counts | Sigma | Mean | Median | Sigma |
| A | 15 | 222 | 2432020 | 20864.91 | 582 | 571 | 116.5 |
| A | 10 | 83 | 252848 | 2164.86 | 582 | 571 | 116.5 |
| A | 9 | 143 | 14180 | 116.78 | 582 | 571 | 116.5 |
| B | 5 | 172 | 177290 | 1417.49 | 654 | 637 | 124.6 |
| B | 0 | 189 | 161992 | 1294.74 | 654 | 637 | 124.6 |
| B | 5 | 200 | 69854 | 555.41 | 654 | 637 | 124.6 |
| C | 15 | 214 | 255900 | 1704.65 | 651 | 657 | 149.7 |
| C | 14 | 254 | 64233 | 424.6 | 651 | 657 | 149.7 |
| C | 0 | 10 | 60025 | 396.49 | 651 | 657 | 149.7 |
| D | 2 | 249 | 1125098 | 7357.52 | 636 | 620 | 152.8 |
| D | 2 | 250 | 374954 | 2449.29 | 636 | 620 | 152.8 |
| D | 13 | 249 | 66616 | 431.82 | 636 | 620 | 152.8 |
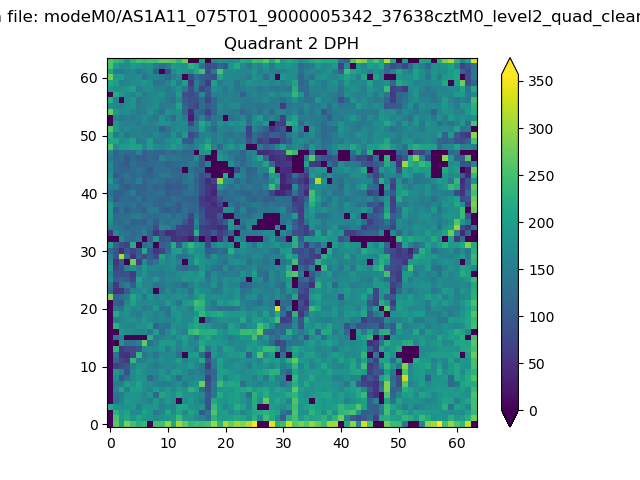
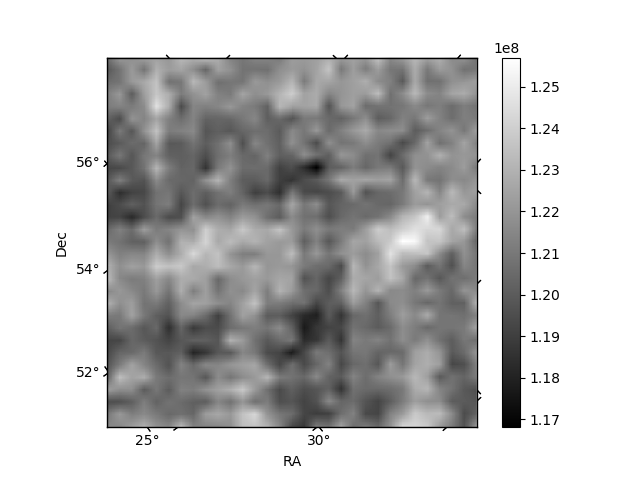
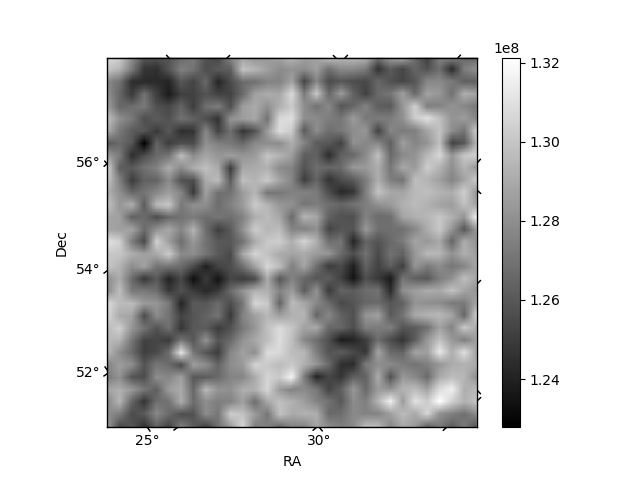
Histogram calculated using DETX and DETY for each event in the final _common_clean file
| Quadrant A | 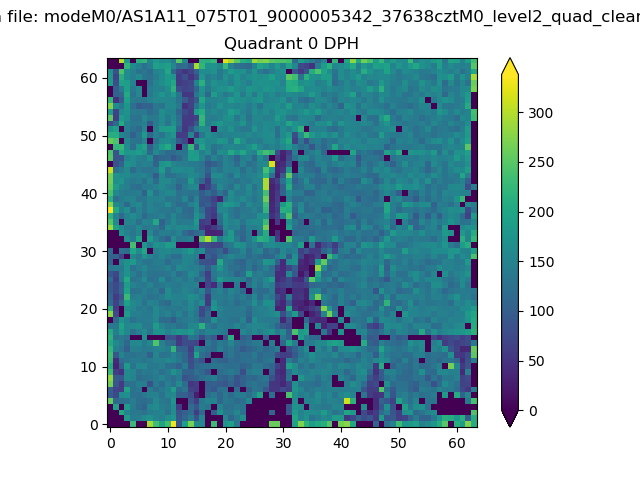 |
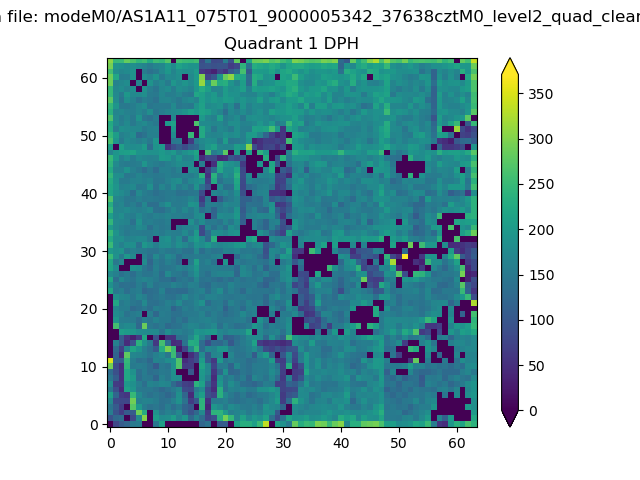 |
Quadrant B |
|---|---|---|---|
| Quadrant D | 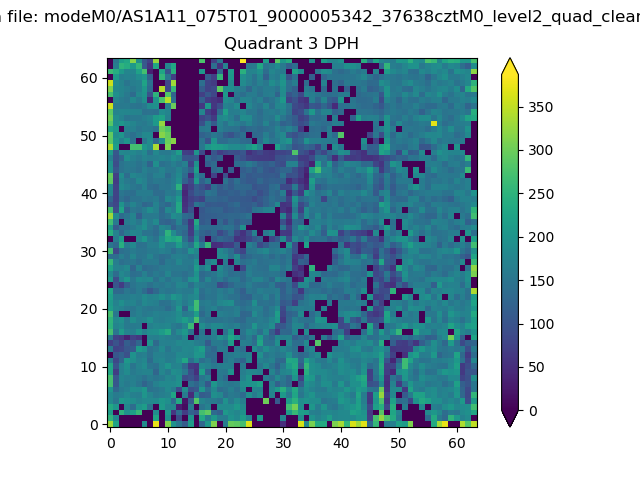 |
 |
Quadrant C |
| Plot type | Count rate plots | Images |
|---|---|---|
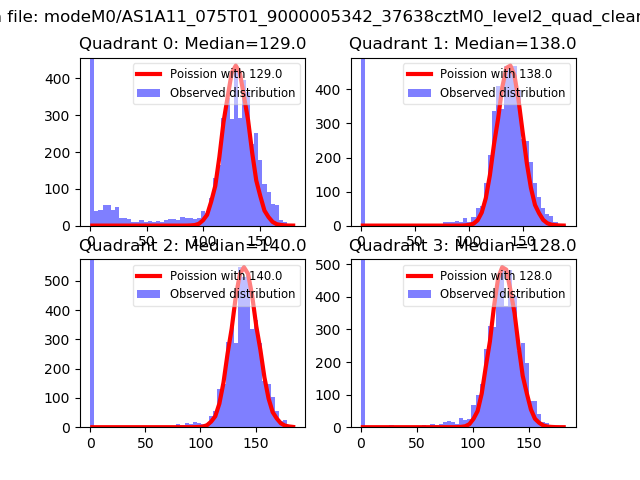
| Comparison with Poisson distribution Blue bars denote a histogram of data divided into 1 sec bins. Red curve is a Poisson curve with rate = median count rate of data. |
 |
 |
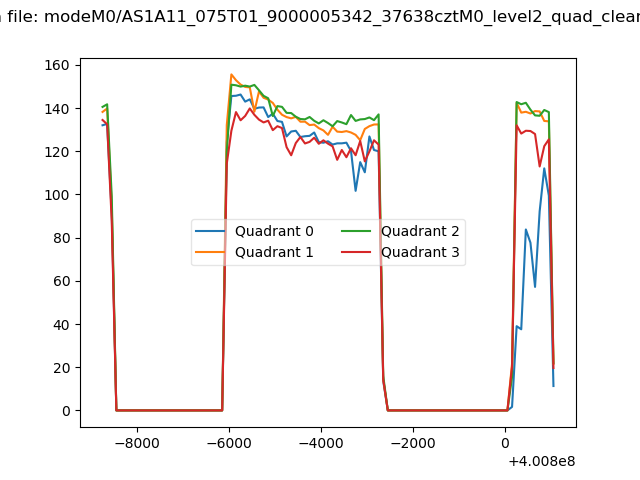
| Quadrant-wise count rates Data is divided into 100 sec bins |
 |
|
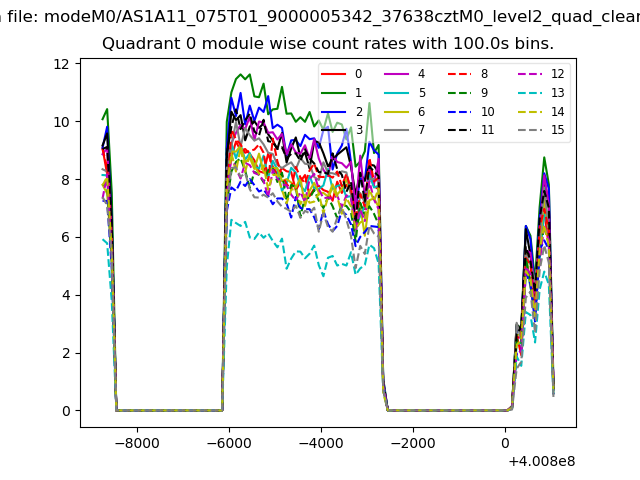
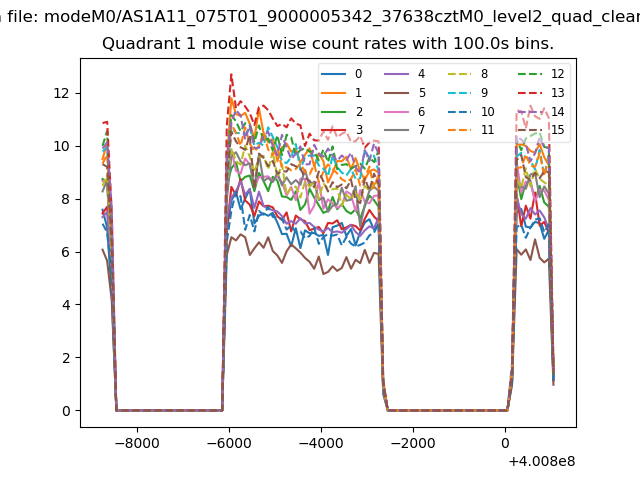
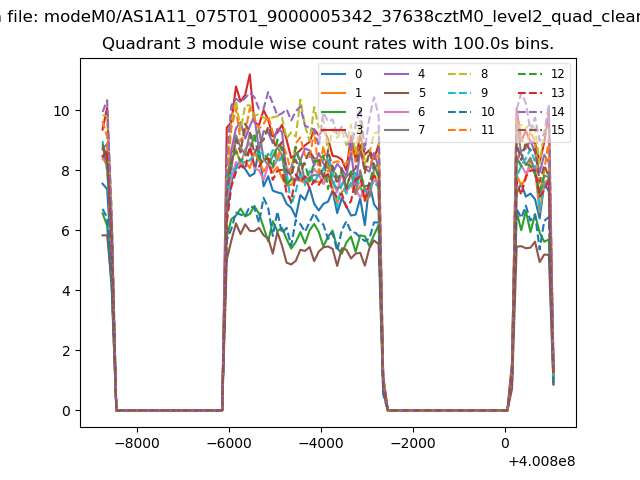
| Module-wise count rates for Quadrant A Data is divided into 100 sec bins |
 |
 |
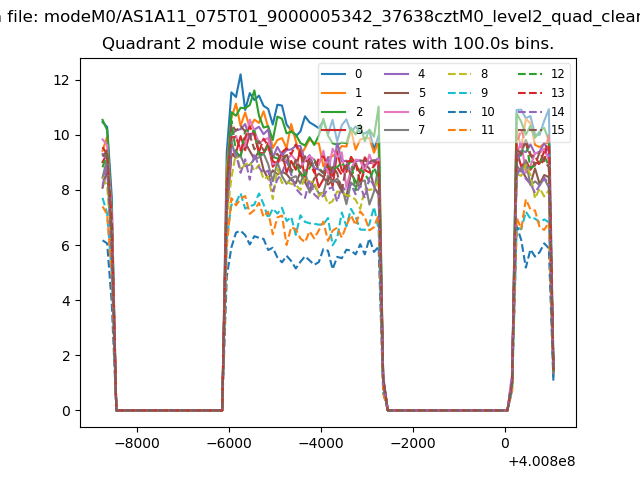
| Module-wise count rates for Quadrant B Data is divided into 100 sec bins |
 |
 |
| Module-wise count rates for Quadrant C Data is divided into 100 sec bins |
 |
 |
| Module-wise count rates for Quadrant D Data is divided into 100 sec bins |
 |
 |
| Parameter | Plot |
|---|---|
| CZT HV Monitor | 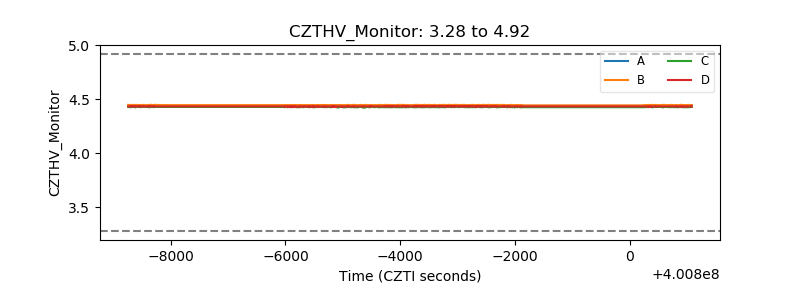 |
| D_VDD | 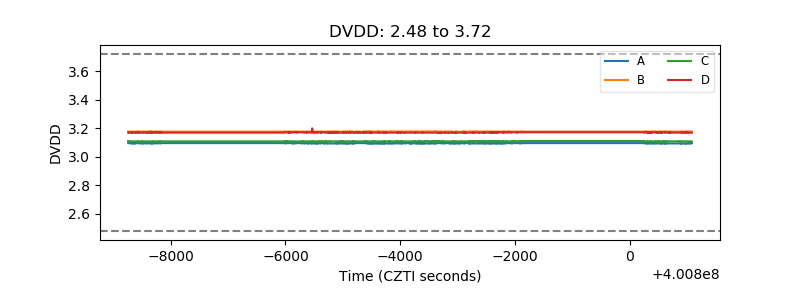 |
| Temperature 1 | 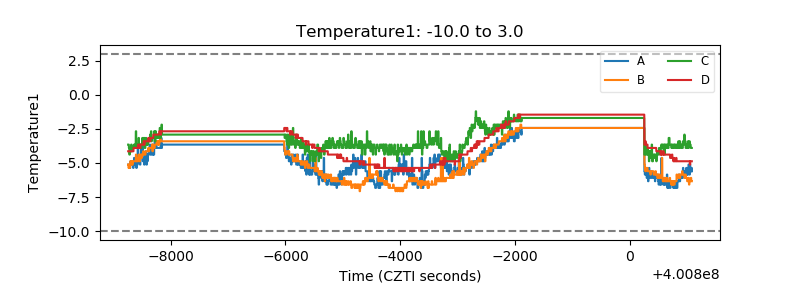 |
| Veto HV Monitor | 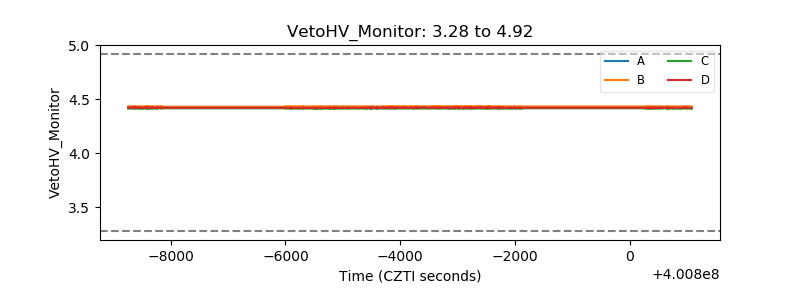 |
| Veto LLD | 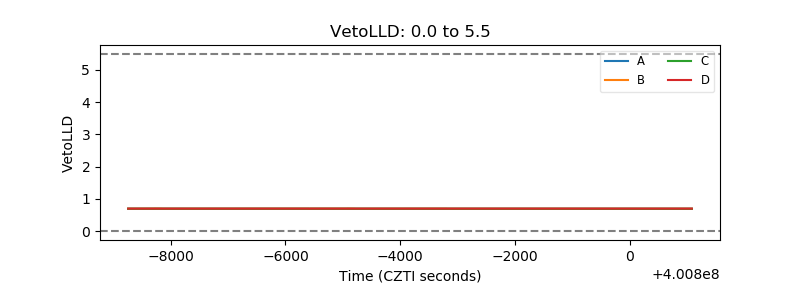 |
| Alpha Counter | 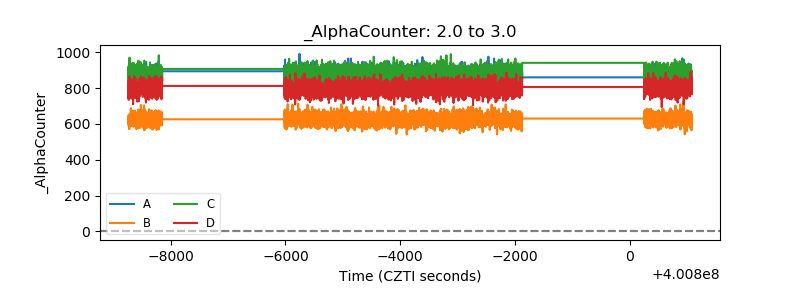 |
| _CPM_Rate | 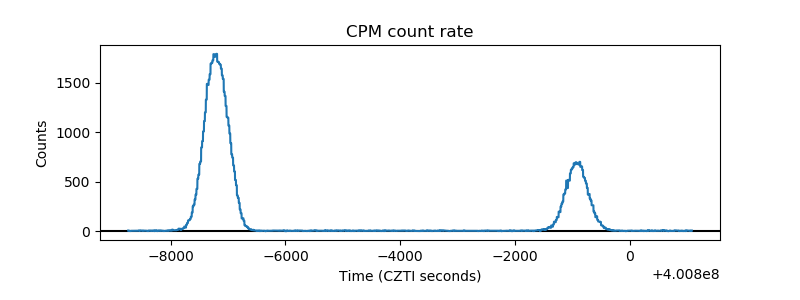 |
| CZT Counter | 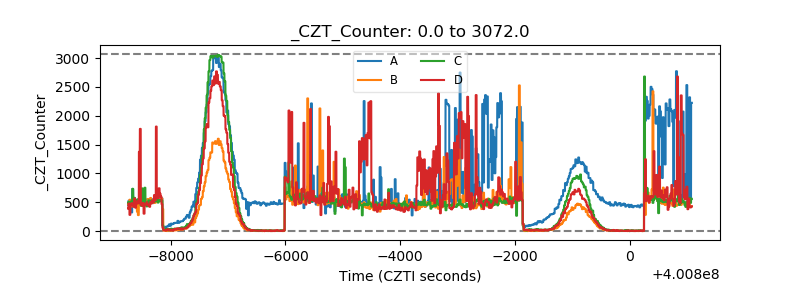 |
| +2.5 Volts monitor |  |
| +5 Volts monitor | 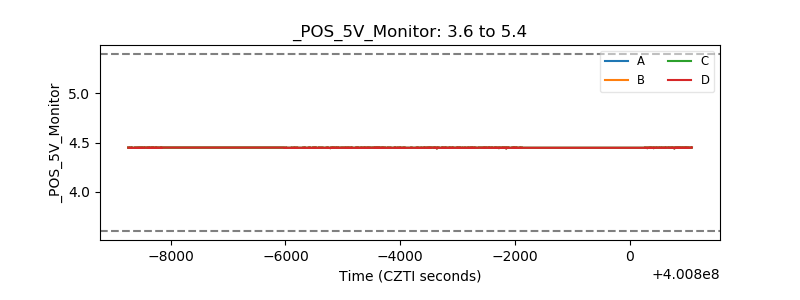 |
| _ROLL_ROT | 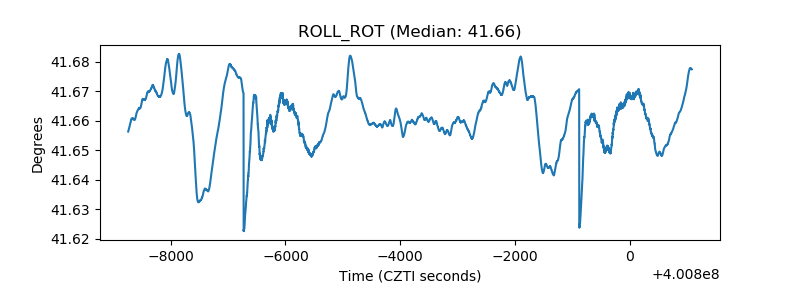 |
| _Roll_DEC | 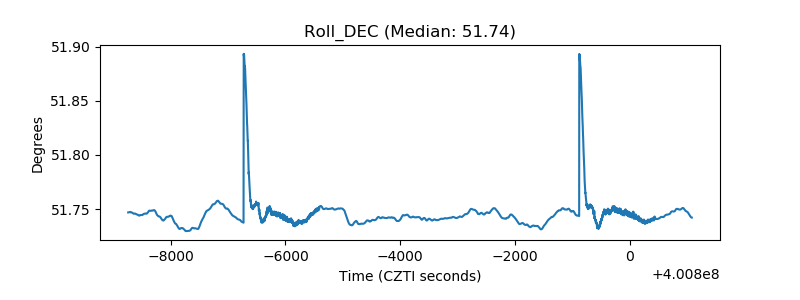 |
| _Roll_RA | 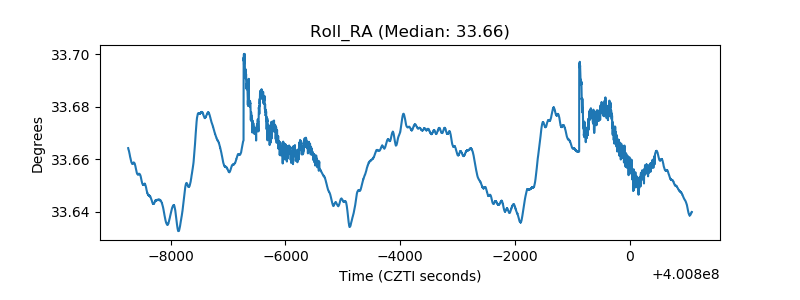 |
| Veto Counter | 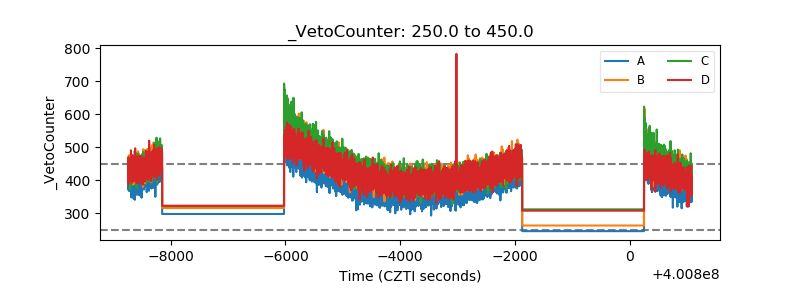 |