| Param | Original file | Final file |
|---|---|---|
| Filename | modeM0/AS1A11_075T01_9000005342_37639cztM0_level2.evt | modeM0/AS1A11_075T01_9000005342_37639cztM0_level2_quad_clean.evt |
| Size (bytes) | 551,646,720 | 67,852,800 |
| Size | 526.1 MB | 64.7 MB |
| Events in quadrant A | 7,840,223 | 281,462 |
| Events in quadrant B | 2,696,304 | 476,539 |
| Events in quadrant C | 2,676,061 | 481,706 |
| Events in quadrant D | 3,138,837 | 447,641 |
| Mode SS | |||
|---|---|---|---|
| Quadrant | BADHDUFLAG | Total packets | Discarded packets |
| A | 0 | 110 | 0 |
| B | 0 | 110 | 0 |
| C | 0 | 110 | 0 |
| D | 0 | 110 | 0 |
| Mode M0 | |||
|---|---|---|---|
| Quadrant | BADHDUFLAG | Total packets | Discarded packets |
| A | 0 | 26868 | 3 |
| B | 0 | 11496 | 2 |
| C | 0 | 11071 | 2 |
| D | 0 | 13062 | 2 |
| Mode M9 | |||
|---|---|---|---|
| Quadrant | BADHDUFLAG | Total packets | Discarded packets |
| A | 0 | 40 | 0 |
| B | 0 | 40 | 0 |
| C | 0 | 40 | 0 |
| D | 0 | 40 | 0 |
| Quadrant | Total seconds | Saturated seconds | Saturation percentage |
|---|---|---|---|
| A | 5224 | 2761 | 52.852221% |
| B | 5224 | 76 | 1.454824% |
| C | 5224 | 21 | 0.401991% |
| D | 5224 | 102 | 1.952527% |
Noise dominated data is calculated using 1-second bins in cleaned event files. If a bin has >2000 counts, and if more than 50% of those come from <1% of pixels, then it is considered to be noise-dominated and hence unusable.
| Quadrant | # 1 sec bins | Bins with >0 counts | Bins with >2000 counts | High rate bins dominated by noise | Noise dominated (total time) | Noise dominated (detector-on time) | Marked lightcurve |
|---|---|---|---|---|---|---|---|
| A | 9319 | 5226 | 1650 | 1650 | 17.71% | 31.57% | 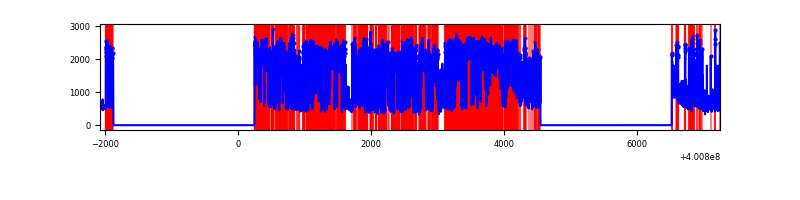 |
| B | 9319 | 5224 | 54 | 54 | 0.58% | 1.03% | 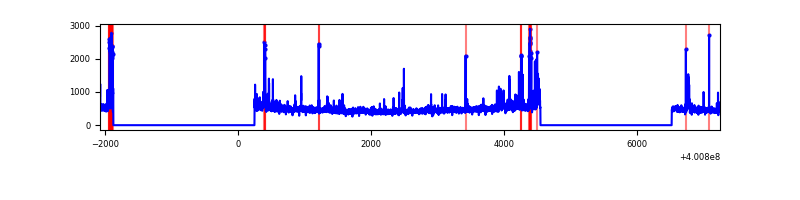 |
| C | 9319 | 5224 | 12 | 12 | 0.13% | 0.23% | 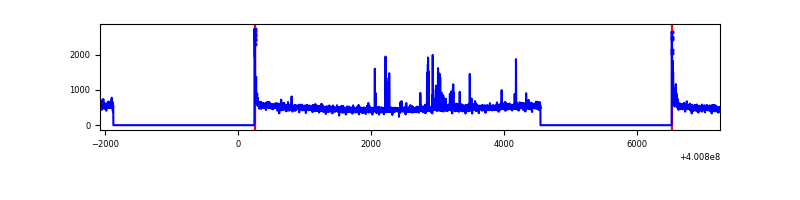 |
| D | 9319 | 5224 | 93 | 93 | 1.00% | 1.78% | 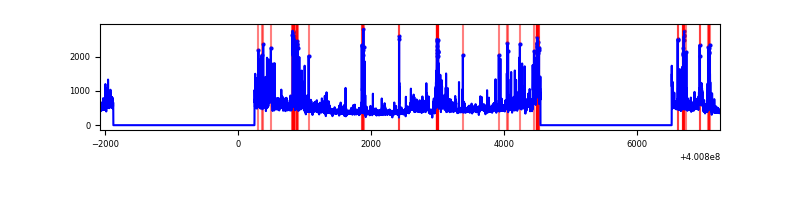 |
Top three noisy pixels from each quadrant. If the there are fewer than three noisy pixels in the level2.evt file, extra rows are filled as -1
| Pixel properties | Quadrant properties | ||||||
|---|---|---|---|---|---|---|---|
| Quadrant | DetID | PixID | Counts | Sigma | Mean | Median | Sigma |
| A | 15 | 222 | 6075257 | 80337.55 | 375 | 368 | 75.6 |
| A | 10 | 83 | 196866 | 2598.59 | 375 | 368 | 75.6 |
| A | 6 | 10 | 93470 | 1231.23 | 375 | 368 | 75.6 |
| B | 5 | 200 | 142363 | 1270.78 | 588 | 575 | 111.6 |
| B | 5 | 172 | 112031 | 998.93 | 588 | 575 | 111.6 |
| B | 4 | 232 | 29101 | 255.66 | 588 | 575 | 111.6 |
| C | 15 | 214 | 240554 | 1765.91 | 585 | 589 | 135.9 |
| C | 14 | 254 | 88427 | 646.4 | 585 | 589 | 135.9 |
| C | 0 | 10 | 66989 | 488.64 | 585 | 589 | 135.9 |
| D | 2 | 249 | 397544 | 2840.2 | 572 | 558 | 139.8 |
| D | 2 | 250 | 292398 | 2087.94 | 572 | 558 | 139.8 |
| D | 12 | 233 | 73996 | 525.41 | 572 | 558 | 139.8 |
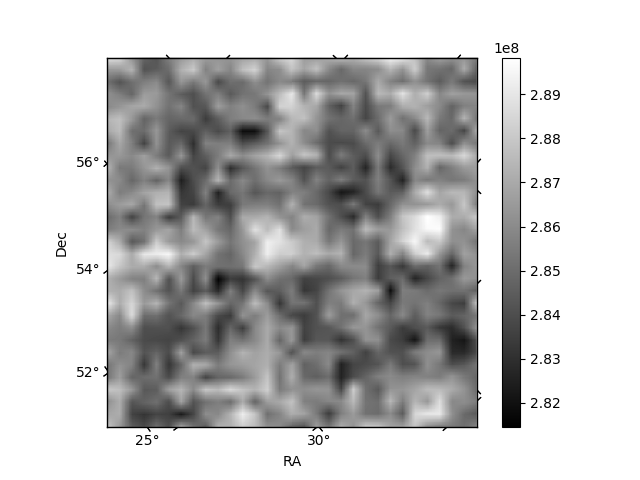
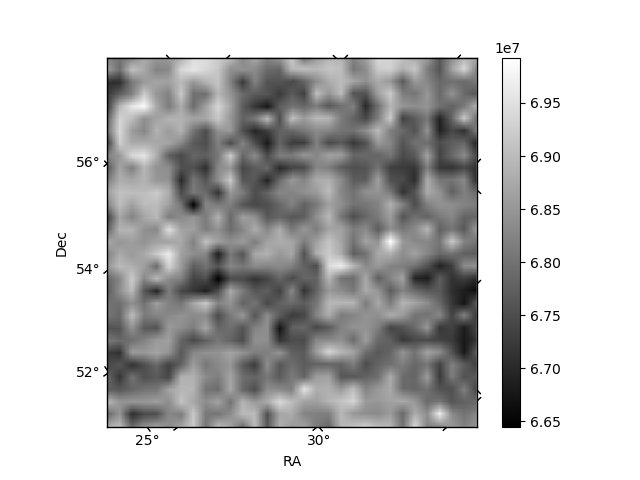
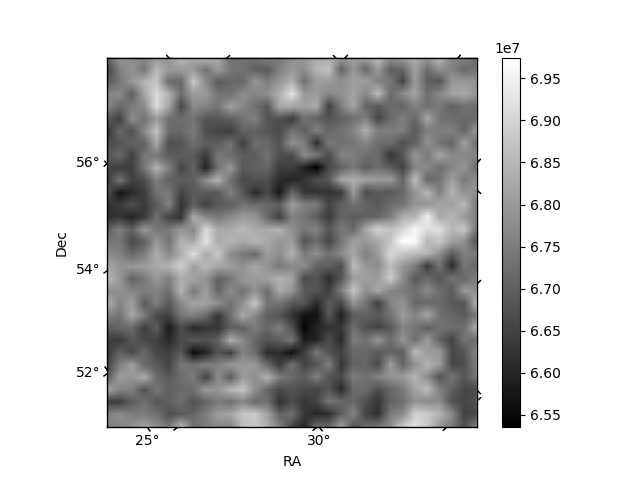
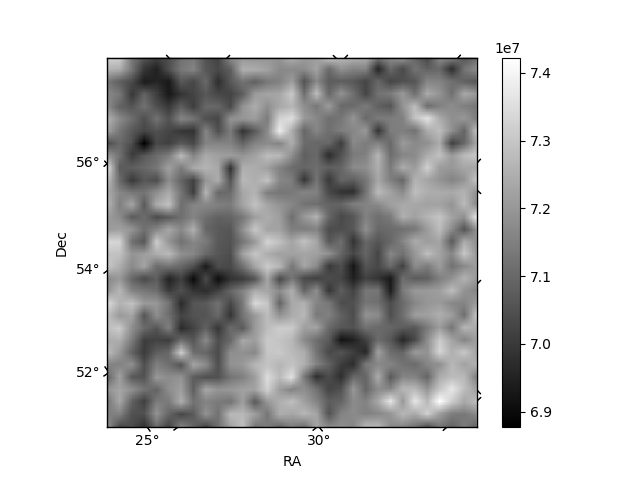
Histogram calculated using DETX and DETY for each event in the final _common_clean file
| Quadrant A | 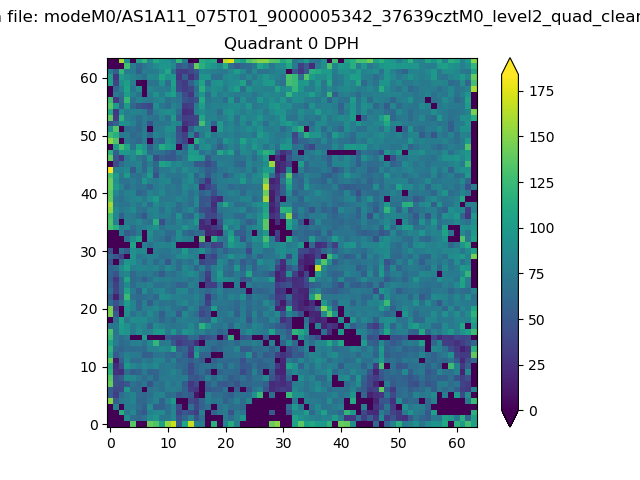 |
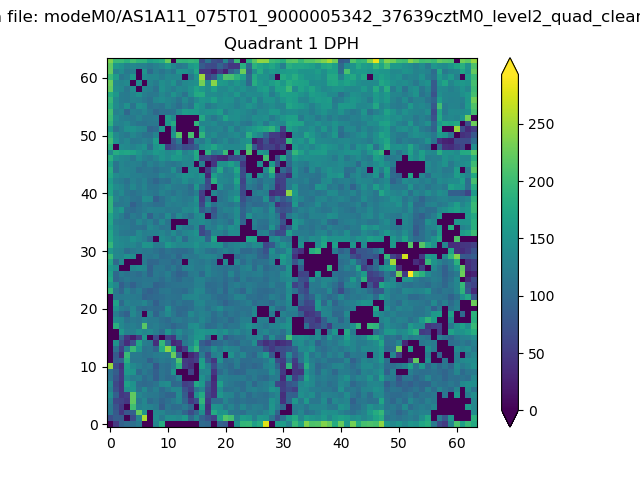 |
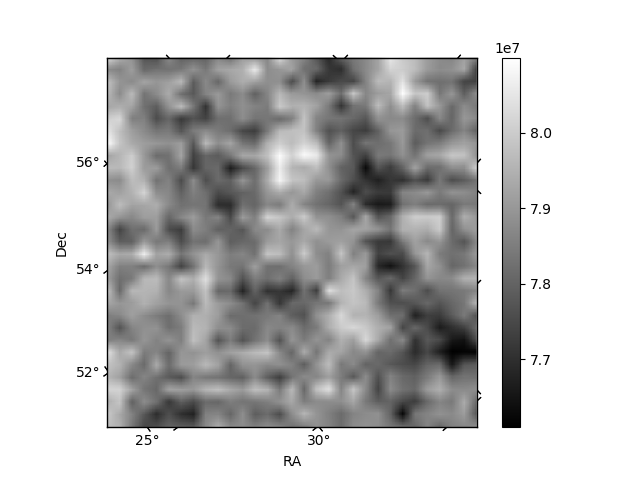
Quadrant B |
|---|---|---|---|
| Quadrant D | 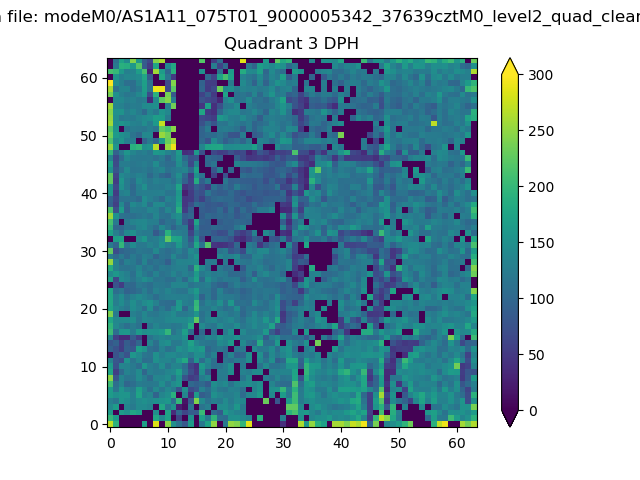 |
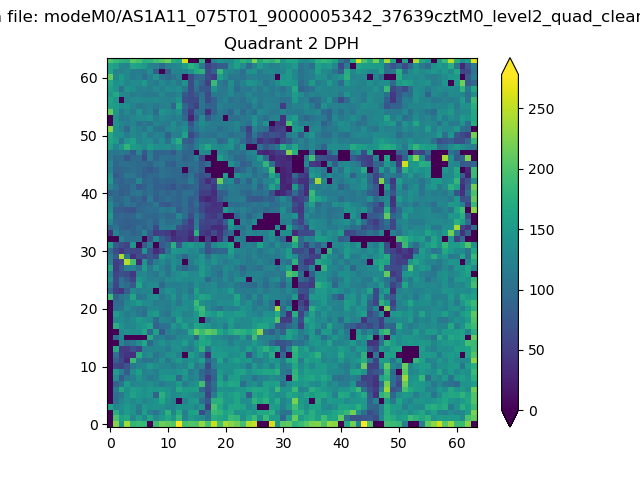 |
Quadrant C |
| Plot type | Count rate plots | Images |
|---|---|---|
| Comparison with Poisson distribution Blue bars denote a histogram of data divided into 1 sec bins. Red curve is a Poisson curve with rate = median count rate of data. |
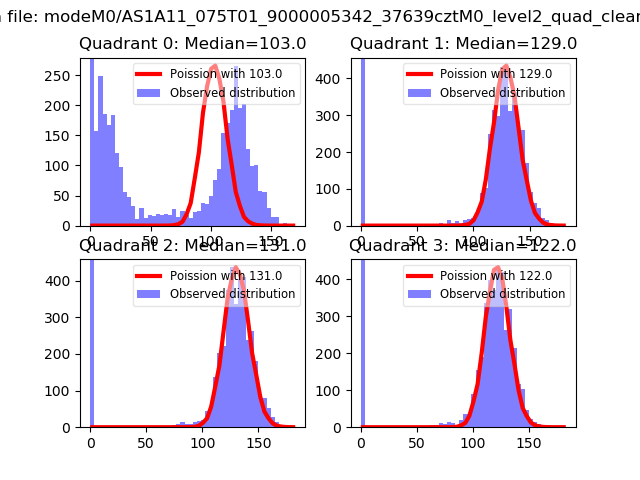 |
 |
| Quadrant-wise count rates Data is divided into 100 sec bins |
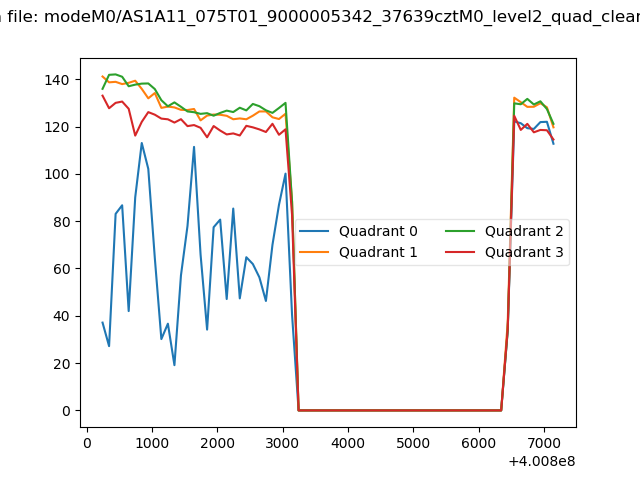 |
|
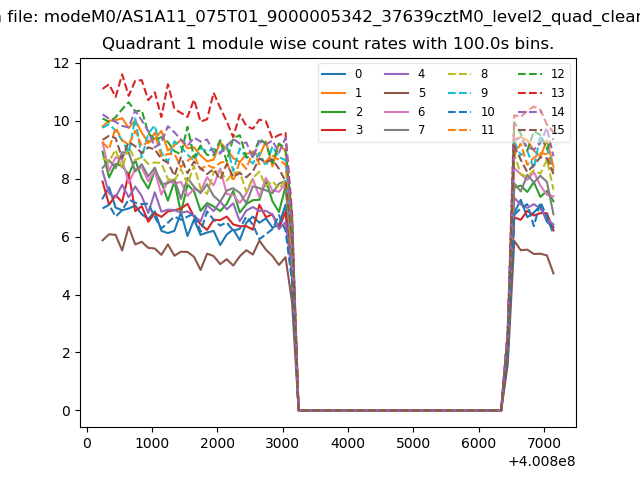
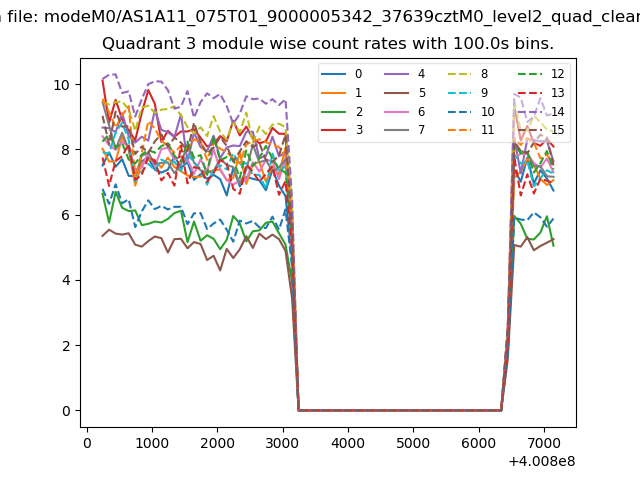
| Module-wise count rates for Quadrant A Data is divided into 100 sec bins |
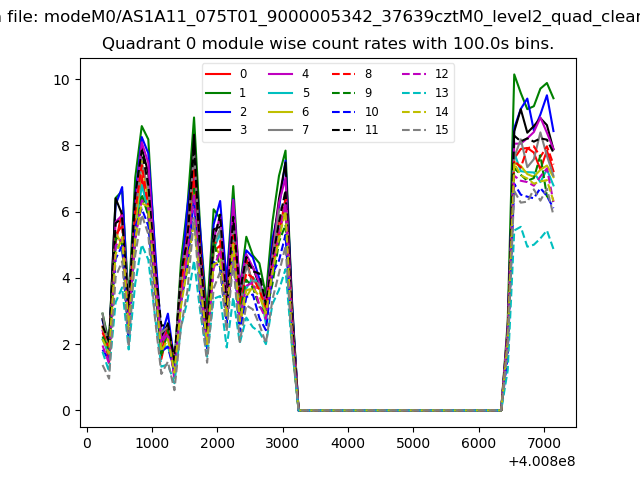 |
 |
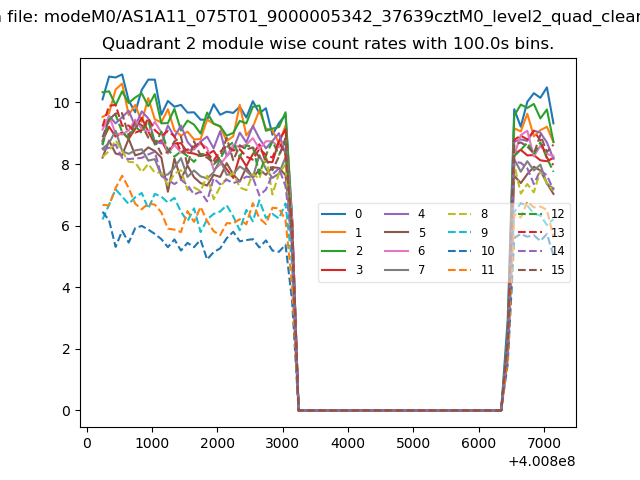
| Module-wise count rates for Quadrant B Data is divided into 100 sec bins |
 |
 |
| Module-wise count rates for Quadrant C Data is divided into 100 sec bins |
 |
 |
| Module-wise count rates for Quadrant D Data is divided into 100 sec bins |
 |
 |
| Parameter | Plot |
|---|---|
| CZT HV Monitor | 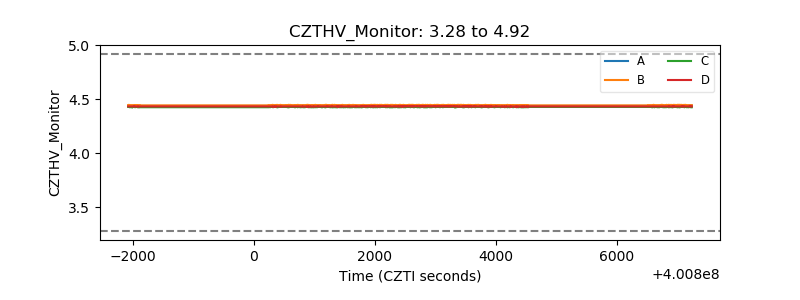 |
| D_VDD | 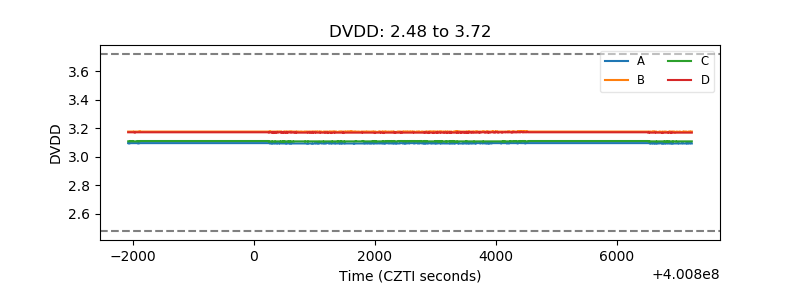 |
| Temperature 1 | 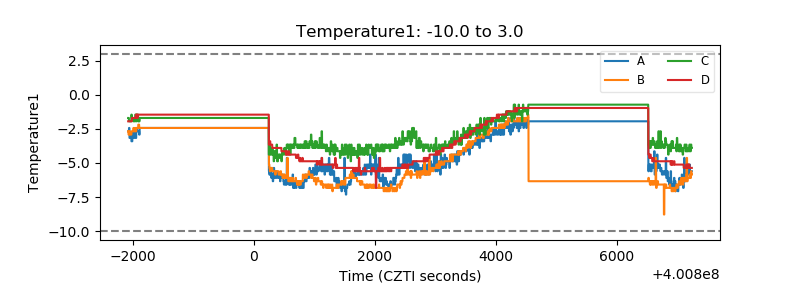 |
| Veto HV Monitor |  |
| Veto LLD | 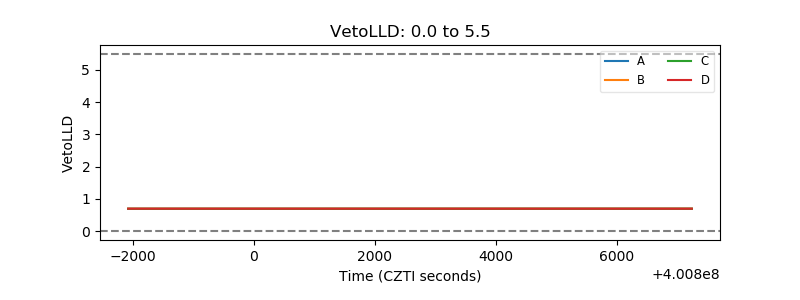 |
| Alpha Counter | 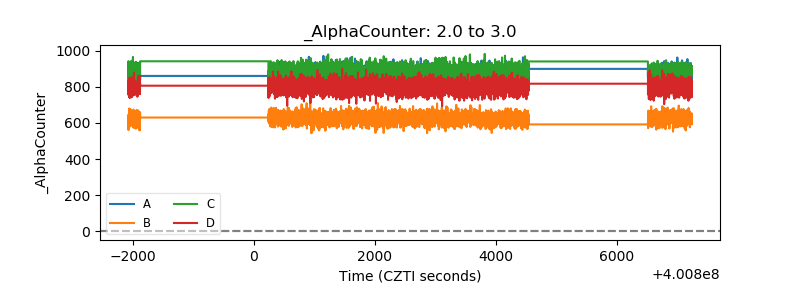 |
| _CPM_Rate | 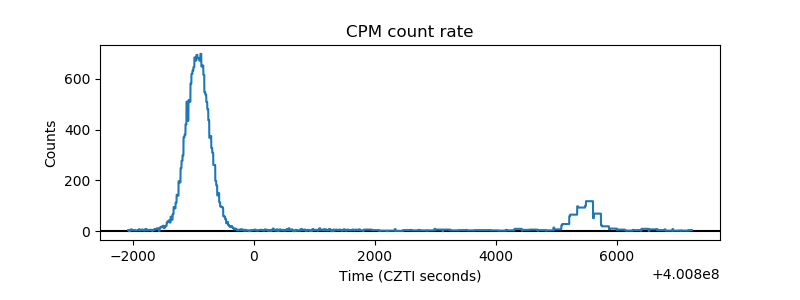 |
| CZT Counter | 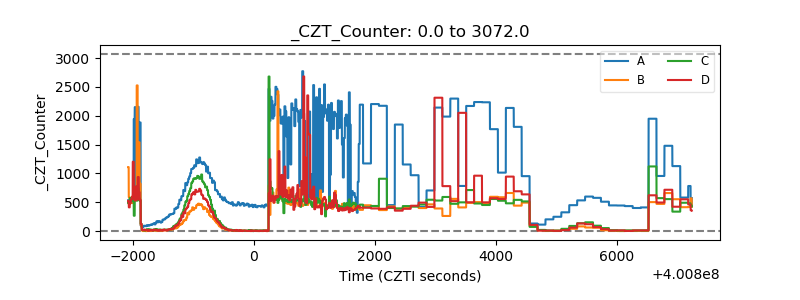 |
| +2.5 Volts monitor | 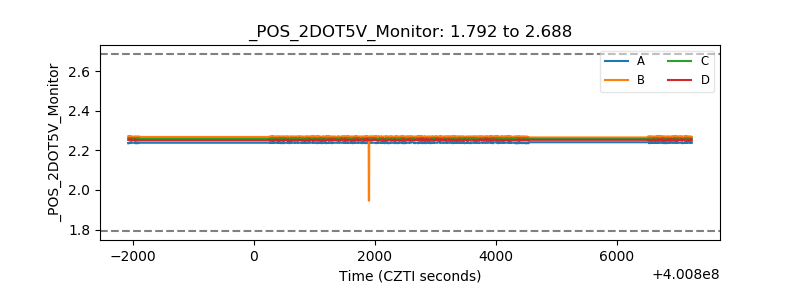 |
| +5 Volts monitor | 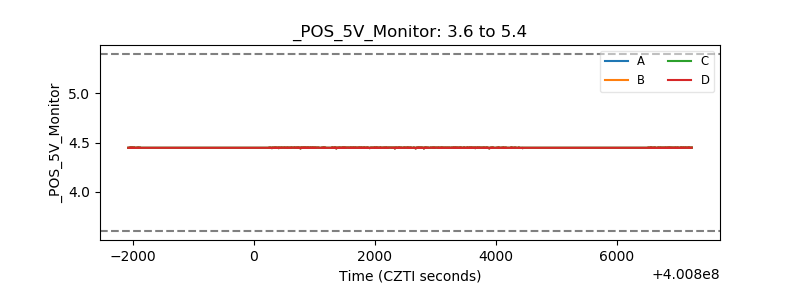 |
| _ROLL_ROT | 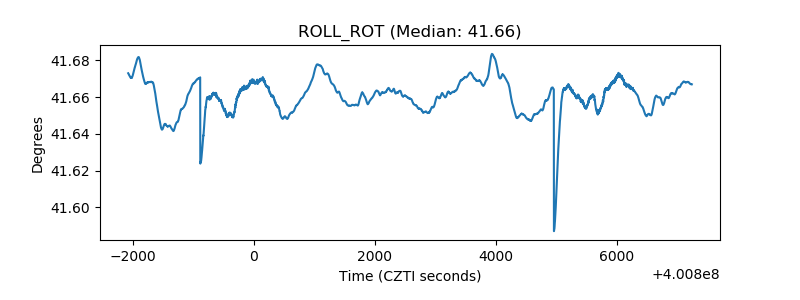 |
| _Roll_DEC | 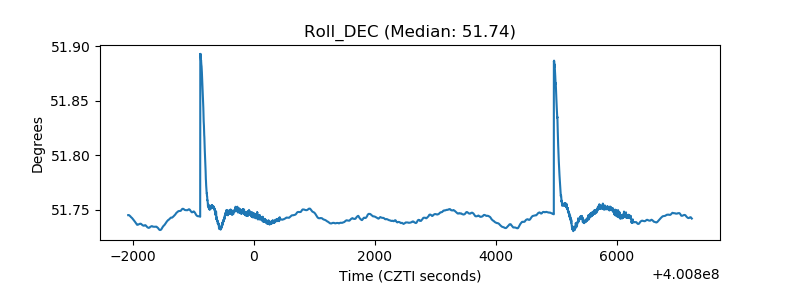 |
| _Roll_RA | 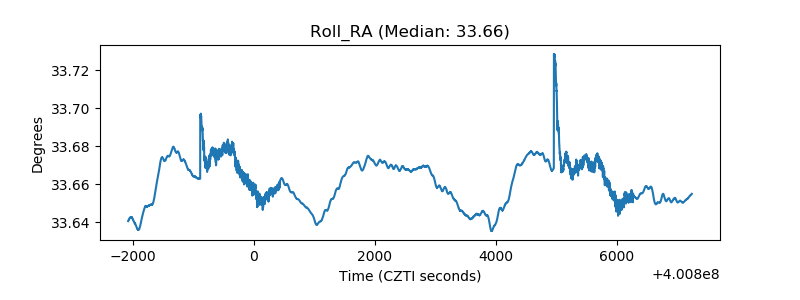 |
| Veto Counter | 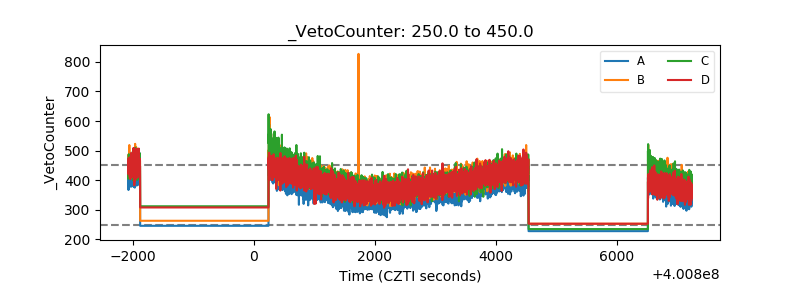 |