| Param | Original file | Final file |
|---|---|---|
| Filename | modeM0/AS1A11_075T01_9000005342_37640cztM0_level2.evt | modeM0/AS1A11_075T01_9000005342_37640cztM0_level2_quad_clean.evt |
| Size (bytes) | 452,073,600 | 68,567,040 |
| Size | 431.1 MB | 65.4 MB |
| Events in quadrant A | 4,592,655 | 408,741 |
| Events in quadrant B | 2,731,638 | 432,101 |
| Events in quadrant C | 2,684,788 | 438,942 |
| Events in quadrant D | 3,308,541 | 411,517 |
| Mode SS | |||
|---|---|---|---|
| Quadrant | BADHDUFLAG | Total packets | Discarded packets |
| A | 0 | 116 | 0 |
| B | 0 | 116 | 0 |
| C | 0 | 116 | 0 |
| D | 0 | 116 | 0 |
| Mode M0 | |||
|---|---|---|---|
| Quadrant | BADHDUFLAG | Total packets | Discarded packets |
| A | 0 | 17400 | 3 |
| B | 0 | 11909 | 2 |
| C | 0 | 11384 | 2 |
| D | 0 | 13720 | 2 |
| Mode M9 | |||
|---|---|---|---|
| Quadrant | BADHDUFLAG | Total packets | Discarded packets |
| A | 0 | 35 | 0 |
| B | 0 | 35 | 0 |
| C | 0 | 35 | 0 |
| D | 0 | 35 | 0 |
| Quadrant | Total seconds | Saturated seconds | Saturation percentage |
|---|---|---|---|
| A | 5491 | 353 | 6.428702% |
| B | 5491 | 70 | 1.274813% |
| C | 5491 | 15 | 0.273174% |
| D | 5491 | 103 | 1.875797% |
Noise dominated data is calculated using 1-second bins in cleaned event files. If a bin has >2000 counts, and if more than 50% of those come from <1% of pixels, then it is considered to be noise-dominated and hence unusable.
| Quadrant | # 1 sec bins | Bins with >0 counts | Bins with >2000 counts | High rate bins dominated by noise | Noise dominated (total time) | Noise dominated (detector-on time) | Marked lightcurve |
|---|---|---|---|---|---|---|---|
| A | 9107 | 5493 | 337 | 337 | 3.70% | 6.14% | 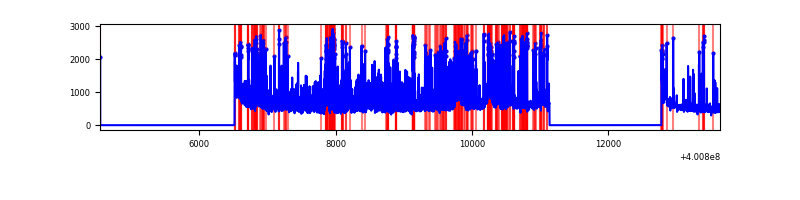 |
| B | 9107 | 5491 | 42 | 42 | 0.46% | 0.76% | 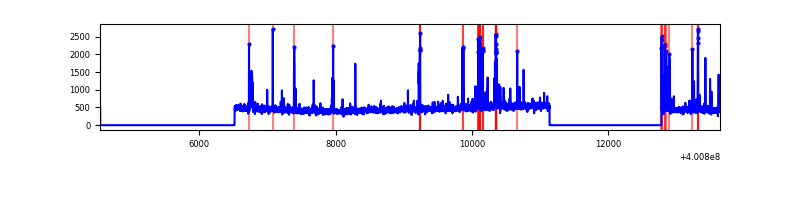 |
| C | 9107 | 5491 | 7 | 7 | 0.08% | 0.13% | 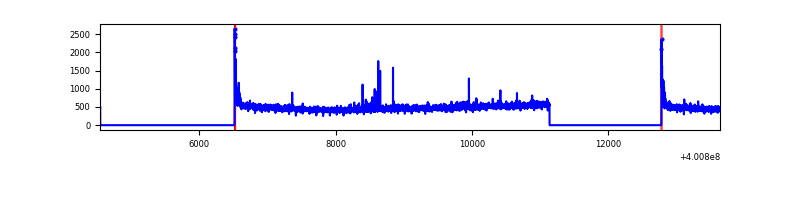 |
| D | 9107 | 5491 | 84 | 84 | 0.92% | 1.53% | 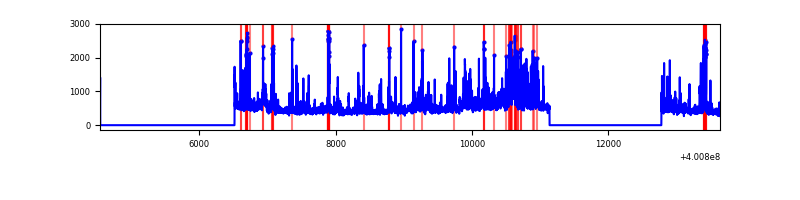 |
Top three noisy pixels from each quadrant. If the there are fewer than three noisy pixels in the level2.evt file, extra rows are filled as -1
| Pixel properties | Quadrant properties | ||||||
|---|---|---|---|---|---|---|---|
| Quadrant | DetID | PixID | Counts | Sigma | Mean | Median | Sigma |
| A | 15 | 222 | 1662588 | 13848.44 | 593 | 582 | 120.0 |
| A | 10 | 83 | 311037 | 2586.83 | 593 | 582 | 120.0 |
| A | 6 | 10 | 279346 | 2322.76 | 593 | 582 | 120.0 |
| B | 5 | 172 | 193132 | 1628.02 | 610 | 592 | 118.3 |
| B | 0 | 230 | 36409 | 302.85 | 610 | 592 | 118.3 |
| B | 4 | 232 | 32490 | 269.71 | 610 | 592 | 118.3 |
| C | 15 | 214 | 254237 | 1825.5 | 599 | 602 | 138.9 |
| C | 0 | 10 | 64538 | 460.17 | 599 | 602 | 138.9 |
| C | 14 | 254 | 27176 | 191.26 | 599 | 602 | 138.9 |
| D | 2 | 249 | 382930 | 2647.8 | 590 | 573 | 144.4 |
| D | 2 | 250 | 327051 | 2260.84 | 590 | 573 | 144.4 |
| D | 13 | 249 | 127536 | 879.21 | 590 | 573 | 144.4 |
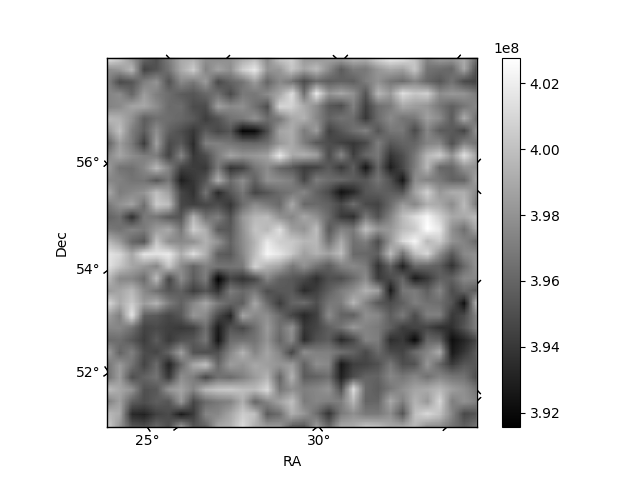
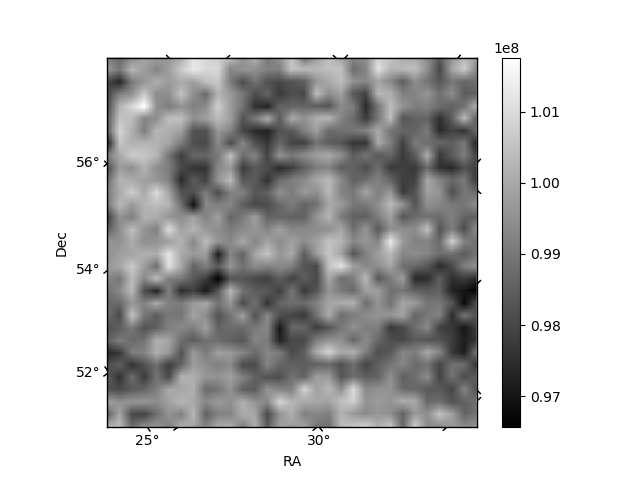
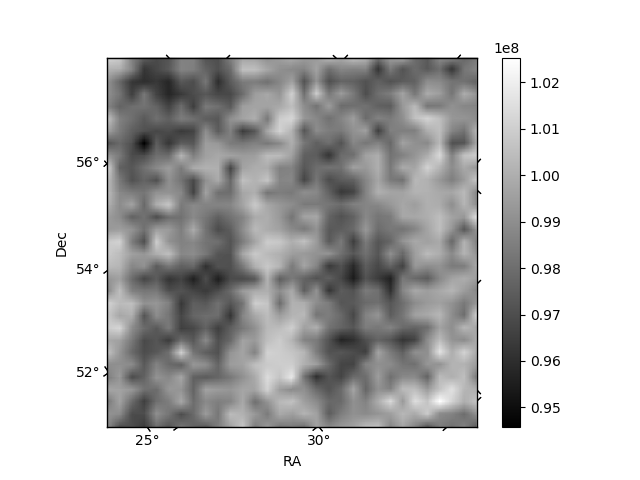
Histogram calculated using DETX and DETY for each event in the final _common_clean file
| Quadrant A | 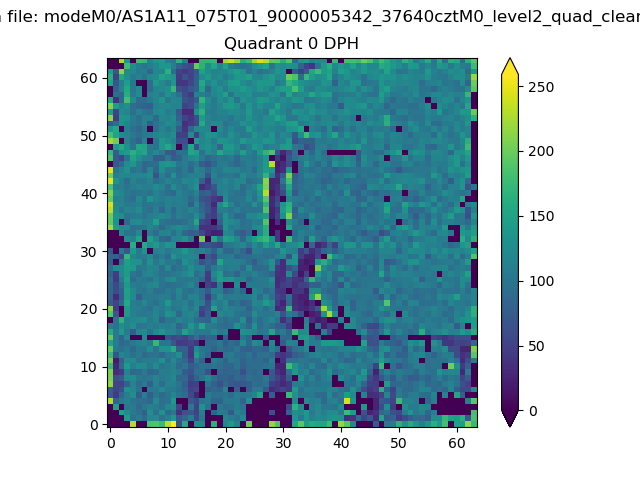 |
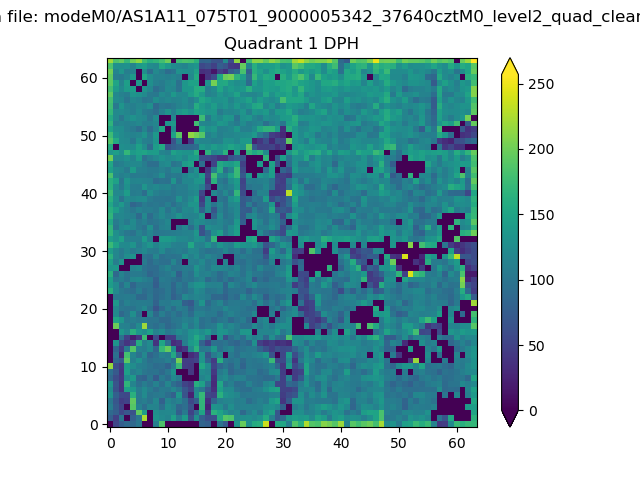 |
Quadrant B |
|---|---|---|---|
| Quadrant D | 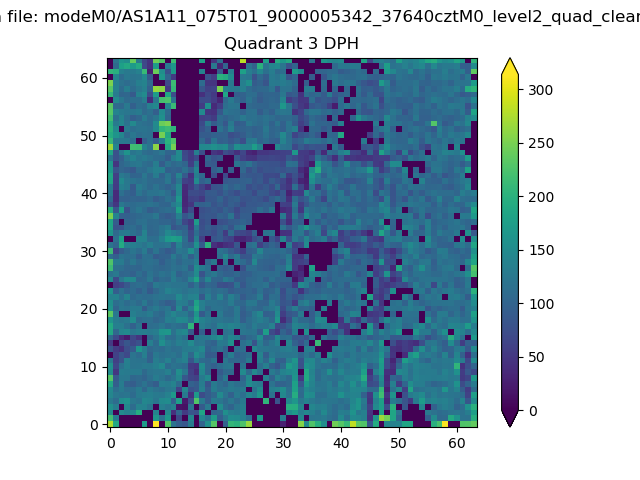 |
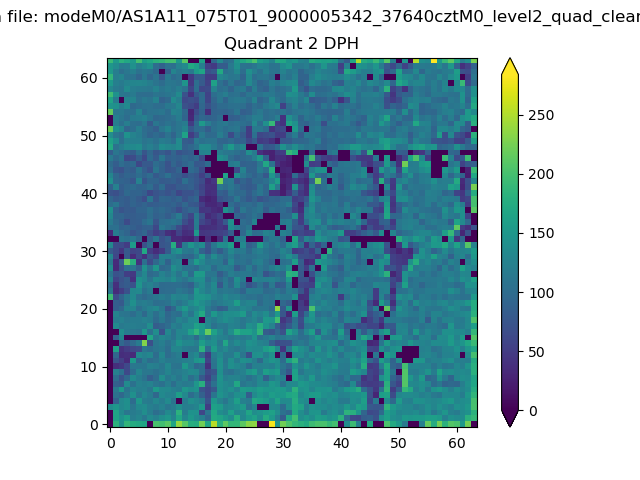 |
Quadrant C |
| Plot type | Count rate plots | Images |
|---|---|---|
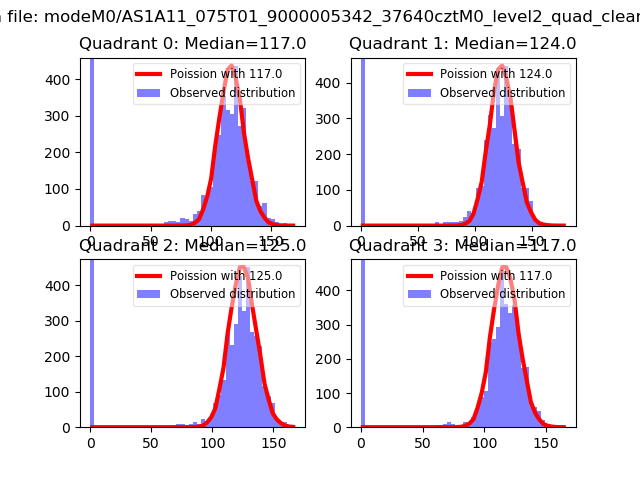
| Comparison with Poisson distribution Blue bars denote a histogram of data divided into 1 sec bins. Red curve is a Poisson curve with rate = median count rate of data. |
 |
 |
| Quadrant-wise count rates Data is divided into 100 sec bins |
 |
|
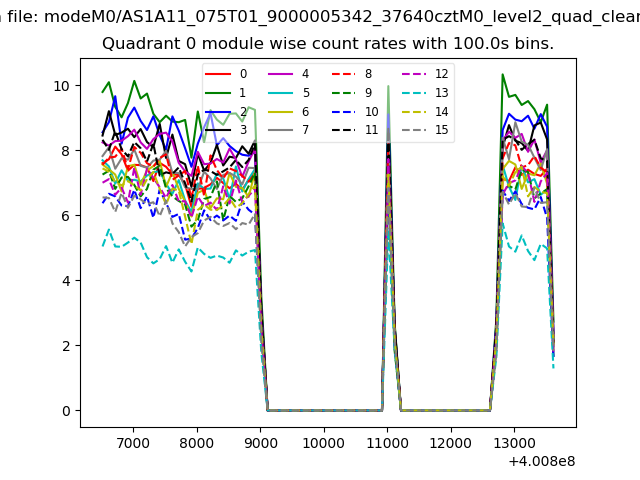
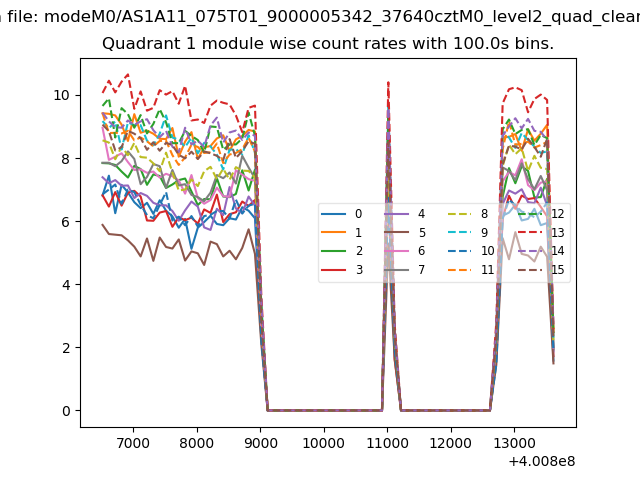
| Module-wise count rates for Quadrant A Data is divided into 100 sec bins |
 |
 |
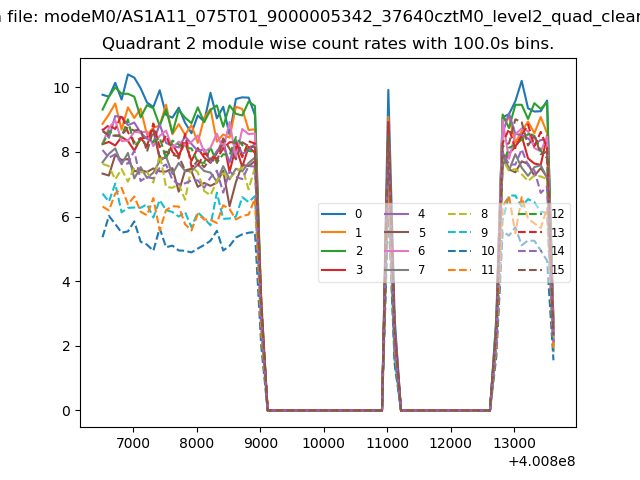
| Module-wise count rates for Quadrant B Data is divided into 100 sec bins |
 |
 |
| Module-wise count rates for Quadrant C Data is divided into 100 sec bins |
 |
 |
| Module-wise count rates for Quadrant D Data is divided into 100 sec bins |
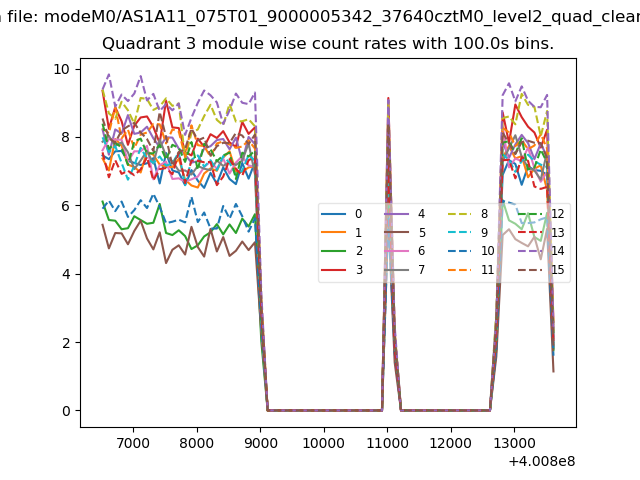 |
 |
| Parameter | Plot |
|---|---|
| CZT HV Monitor | 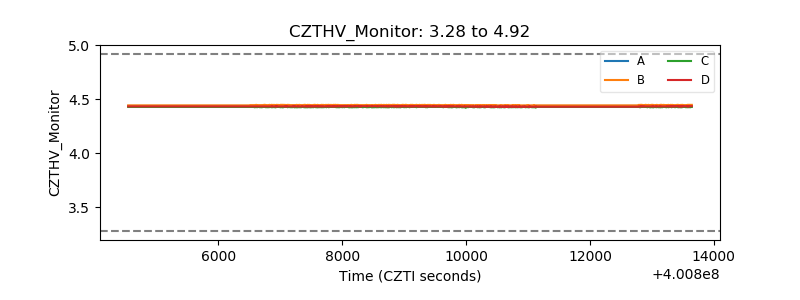 |
| D_VDD | 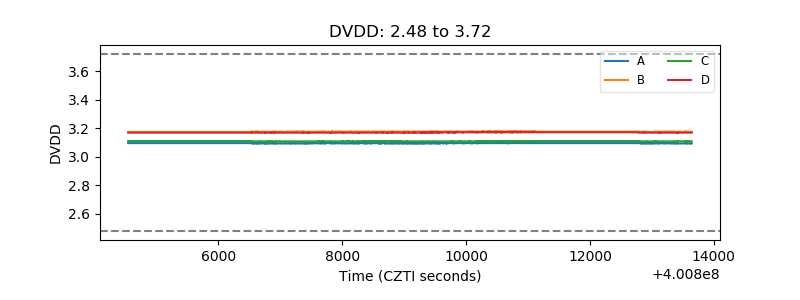 |
| Temperature 1 | 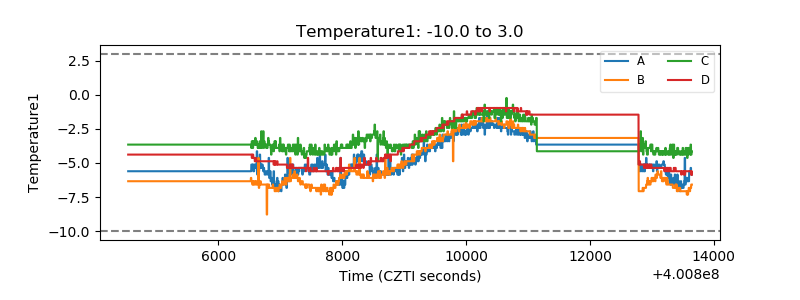 |
| Veto HV Monitor | 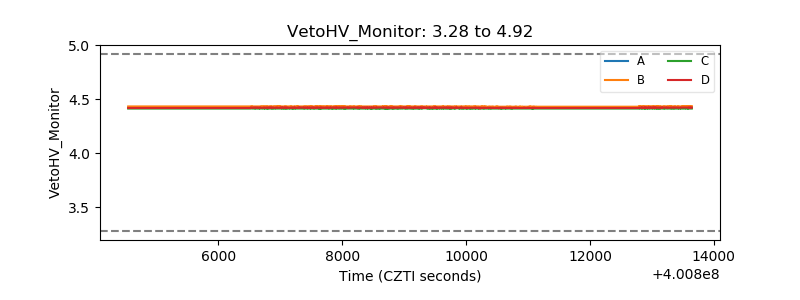 |
| Veto LLD |  |
| Alpha Counter | 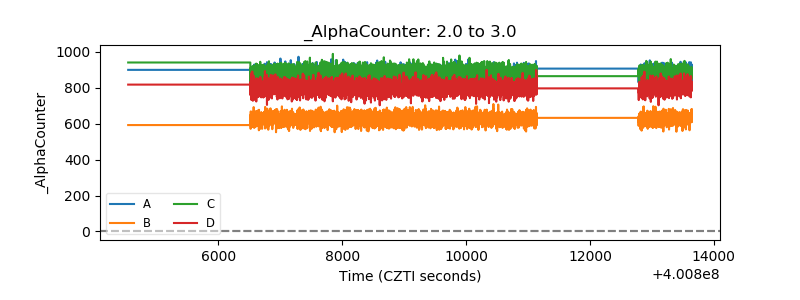 |
| _CPM_Rate | 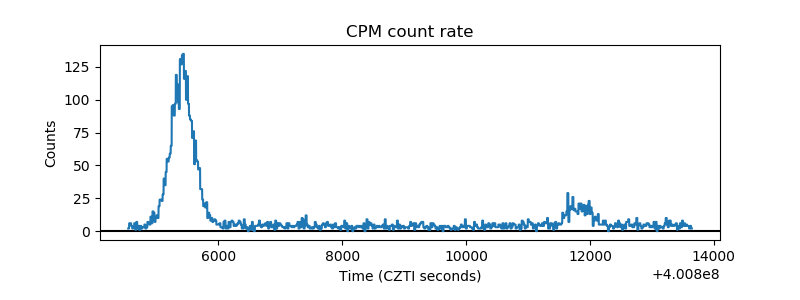 |
| CZT Counter | 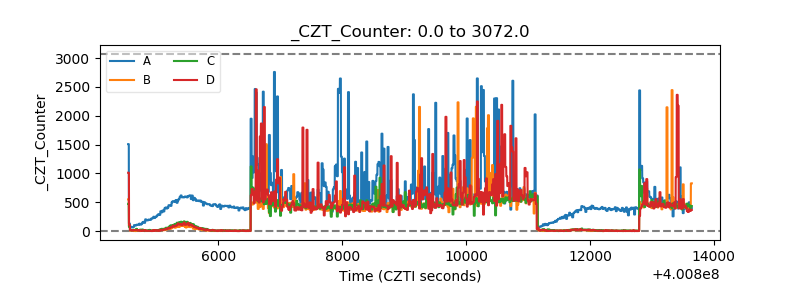 |
| +2.5 Volts monitor | 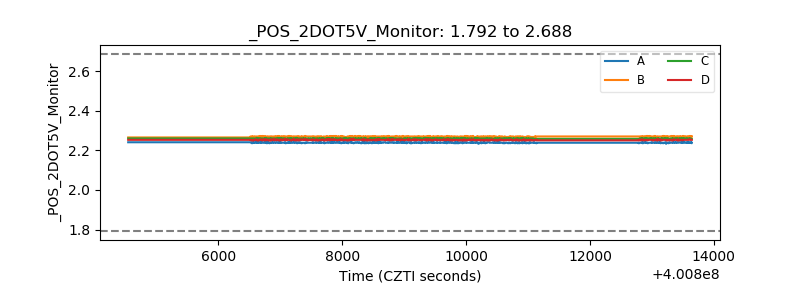 |
| +5 Volts monitor | 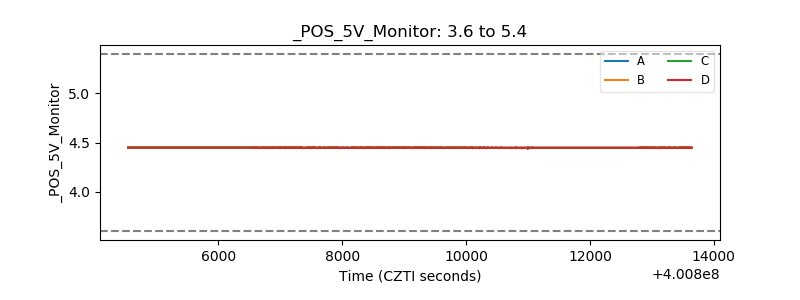 |
| _ROLL_ROT | 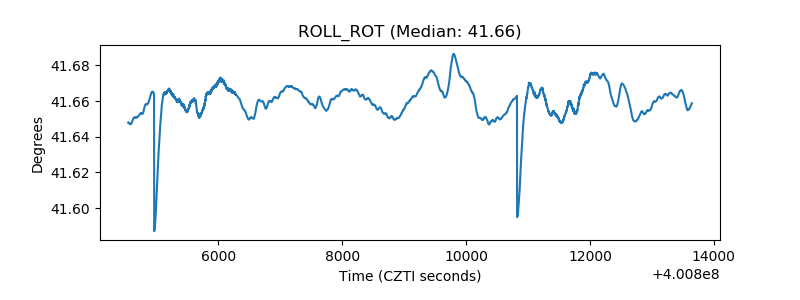 |
| _Roll_DEC | 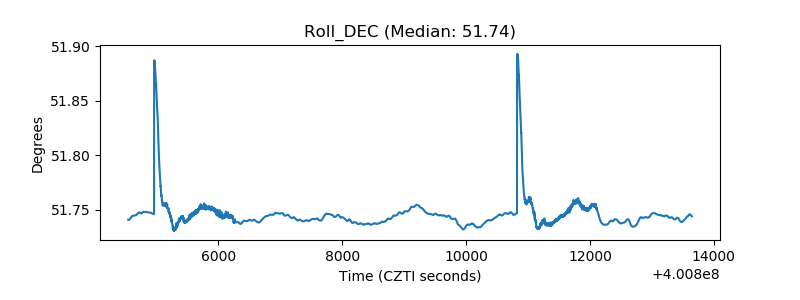 |
| _Roll_RA | 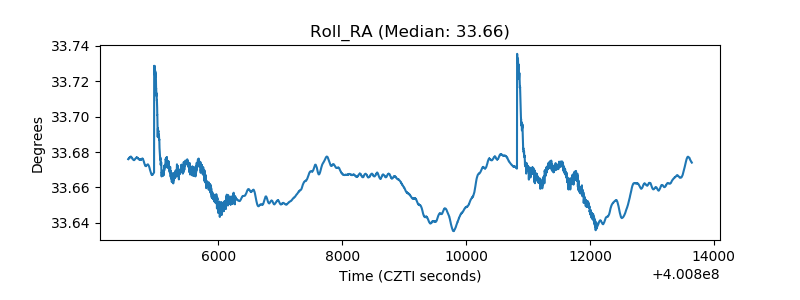 |
| Veto Counter | 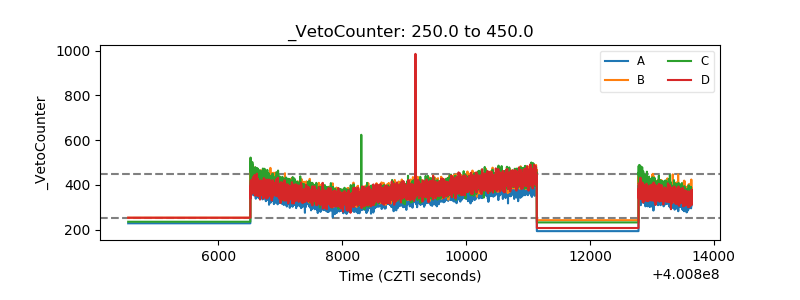 |