| Param | Original file | Final file |
|---|---|---|
| Filename | modeM0/AS1A11_075T01_9000005342_37645cztM0_level2.evt | modeM0/AS1A11_075T01_9000005342_37645cztM0_level2_quad_clean.evt |
| Size (bytes) | 1,311,073,920 | 175,780,800 |
| Size | 1.2 GB | 167.6 MB |
| Events in quadrant A | 13,578,270 | 1,043,377 |
| Events in quadrant B | 8,181,091 | 1,088,206 |
| Events in quadrant C | 7,770,148 | 1,088,823 |
| Events in quadrant D | 9,124,907 | 1,027,438 |
| Mode SS | |||
|---|---|---|---|
| Quadrant | BADHDUFLAG | Total packets | Discarded packets |
| A | 0 | 316 | 0 |
| B | 0 | 316 | 0 |
| C | 0 | 316 | 0 |
| D | 0 | 316 | 0 |
| Mode M0 | |||
|---|---|---|---|
| Quadrant | BADHDUFLAG | Total packets | Discarded packets |
| A | 0 | 50791 | 5 |
| B | 0 | 34176 | 4 |
| C | 0 | 32167 | 4 |
| D | 0 | 37694 | 4 |
| Mode M9 | |||
|---|---|---|---|
| Quadrant | BADHDUFLAG | Total packets | Discarded packets |
| A | 0 | 46 | 0 |
| B | 0 | 46 | 0 |
| C | 0 | 46 | 0 |
| D | 0 | 47 | 0 |
| Quadrant | Total seconds | Saturated seconds | Saturation percentage |
|---|---|---|---|
| A | 15595 | 1346 | 8.630971% |
| B | 15595 | 264 | 1.692850% |
| C | 15595 | 37 | 0.237256% |
| D | 15595 | 366 | 2.346906% |
Noise dominated data is calculated using 1-second bins in cleaned event files. If a bin has >2000 counts, and if more than 50% of those come from <1% of pixels, then it is considered to be noise-dominated and hence unusable.
| Quadrant | # 1 sec bins | Bins with >0 counts | Bins with >2000 counts | High rate bins dominated by noise | Noise dominated (total time) | Noise dominated (detector-on time) | Marked lightcurve |
|---|---|---|---|---|---|---|---|
| A | 19834 | 15598 | 1051 | 1051 | 5.30% | 6.74% | 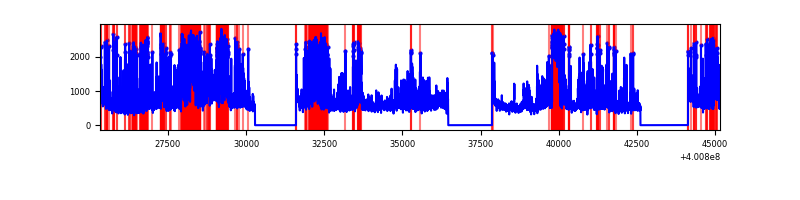 |
| B | 19833 | 15594 | 190 | 190 | 0.96% | 1.22% | 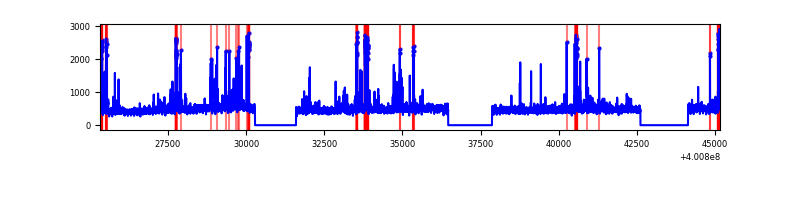 |
| C | 19833 | 15594 | 27 | 27 | 0.14% | 0.17% | 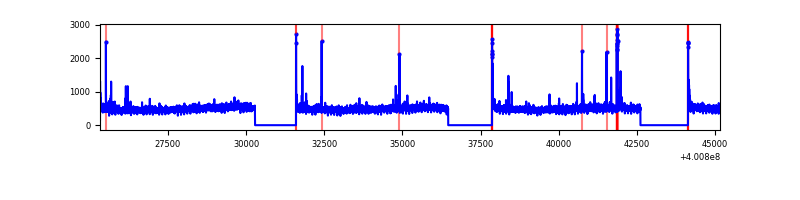 |
| D | 19833 | 15595 | 332 | 332 | 1.67% | 2.13% | 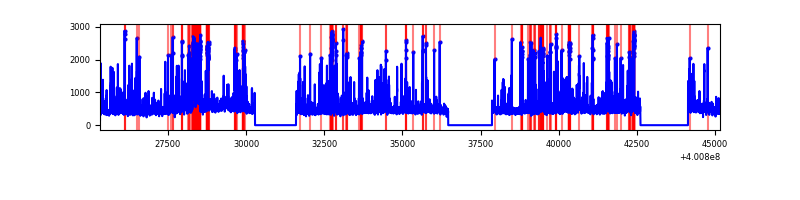 |
Top three noisy pixels from each quadrant. If the there are fewer than three noisy pixels in the level2.evt file, extra rows are filled as -1
| Pixel properties | Quadrant properties | ||||||
|---|---|---|---|---|---|---|---|
| Quadrant | DetID | PixID | Counts | Sigma | Mean | Median | Sigma |
| A | 15 | 222 | 5807209 | 16725.75 | 1733 | 1695 | 347.1 |
| A | 10 | 83 | 781060 | 2245.36 | 1733 | 1695 | 347.1 |
| A | 9 | 143 | 137486 | 391.22 | 1733 | 1695 | 347.1 |
| B | 5 | 172 | 552773 | 1612.6 | 1778 | 1727 | 341.7 |
| B | 5 | 255 | 183211 | 531.1 | 1778 | 1727 | 341.7 |
| B | 0 | 230 | 85160 | 244.16 | 1778 | 1727 | 341.7 |
| C | 15 | 214 | 718044 | 1777.7 | 1751 | 1761 | 402.9 |
| C | 14 | 254 | 110691 | 270.35 | 1751 | 1761 | 402.9 |
| C | 0 | 10 | 90010 | 219.02 | 1751 | 1761 | 402.9 |
| D | 13 | 249 | 727635 | 1731.64 | 1735 | 1686 | 419.2 |
| D | 2 | 249 | 410810 | 975.9 | 1735 | 1686 | 419.2 |
| D | 2 | 153 | 255360 | 605.1 | 1735 | 1686 | 419.2 |
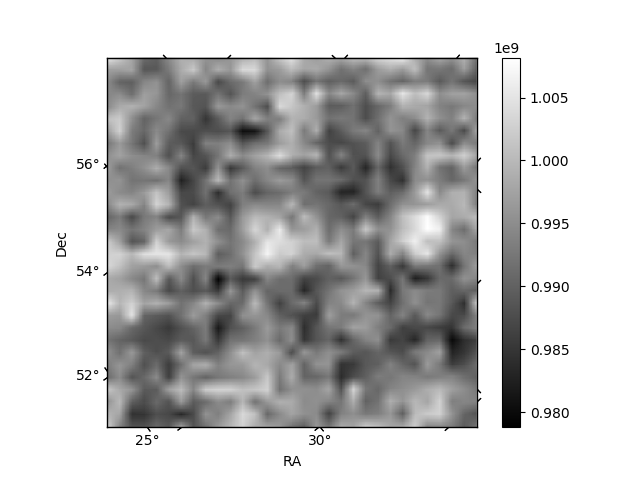
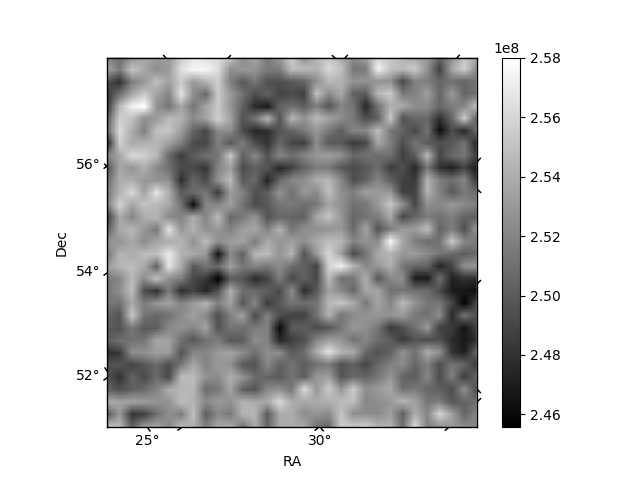
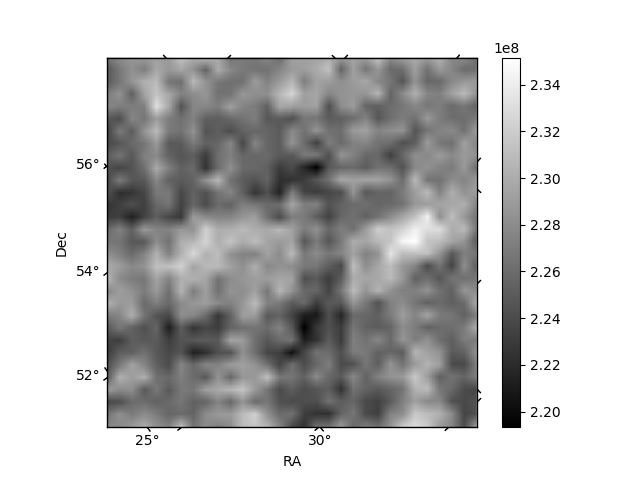
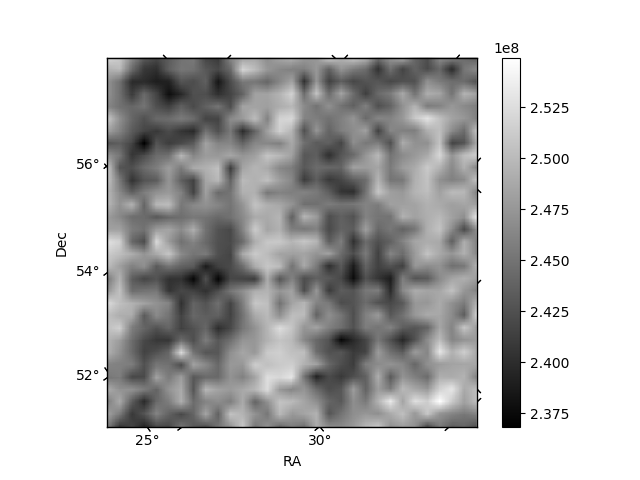
Histogram calculated using DETX and DETY for each event in the final _common_clean file
| Quadrant A | 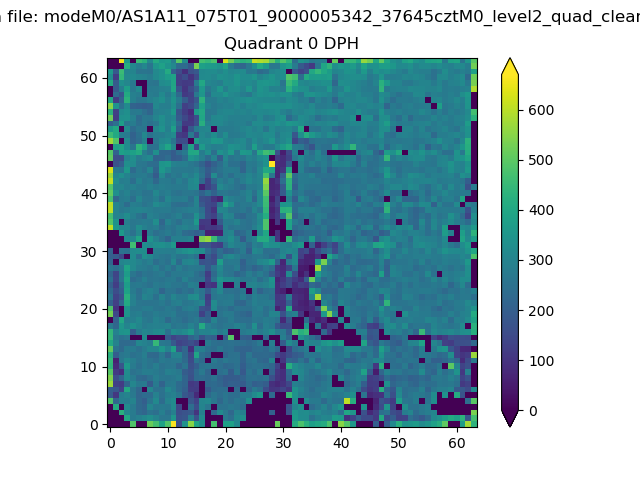 |
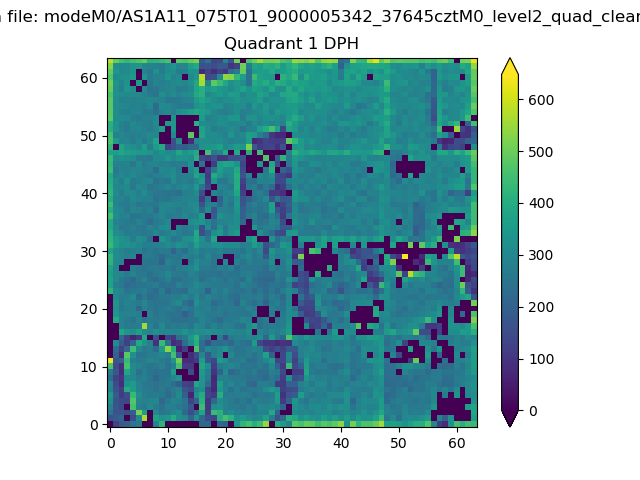 |
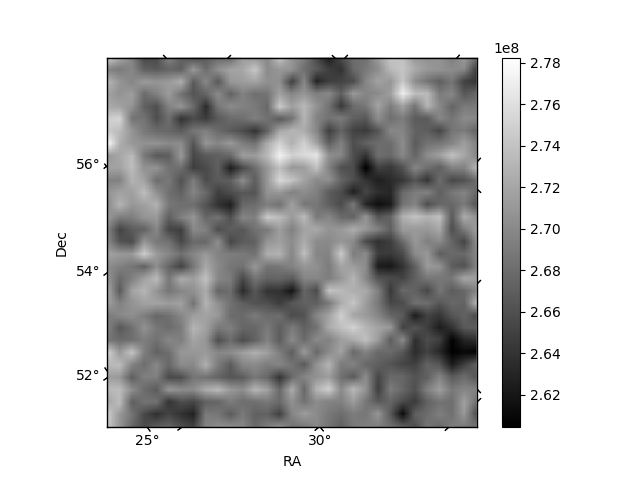
Quadrant B |
|---|---|---|---|
| Quadrant D | 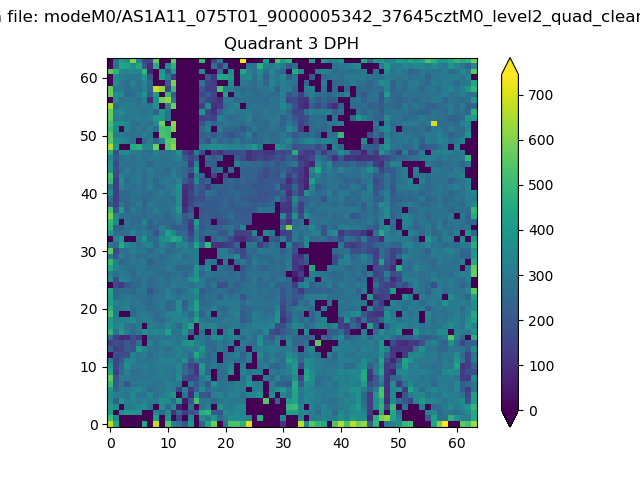 |
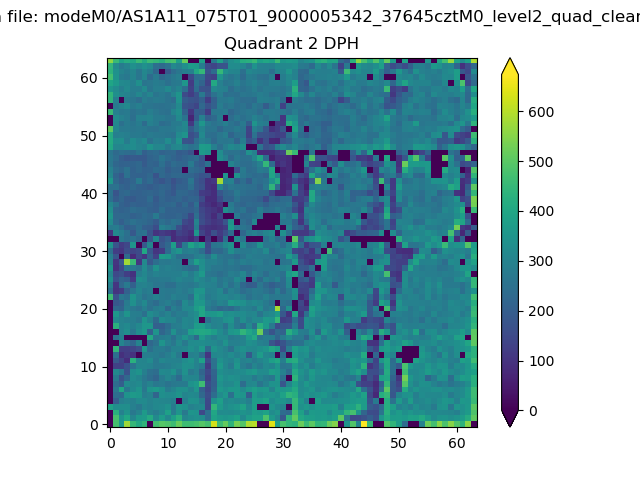 |
Quadrant C |
| Plot type | Count rate plots | Images |
|---|---|---|
| Comparison with Poisson distribution Blue bars denote a histogram of data divided into 1 sec bins. Red curve is a Poisson curve with rate = median count rate of data. |
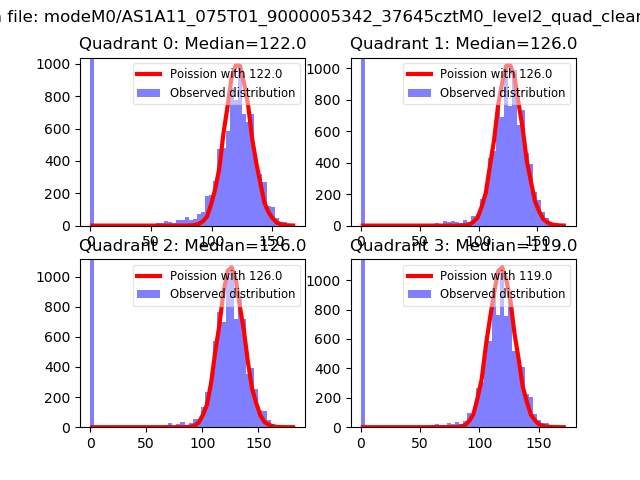 |
 |
| Quadrant-wise count rates Data is divided into 100 sec bins |
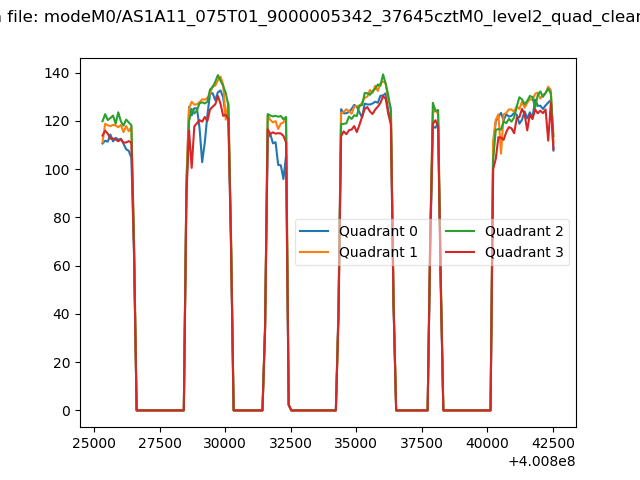 |
|
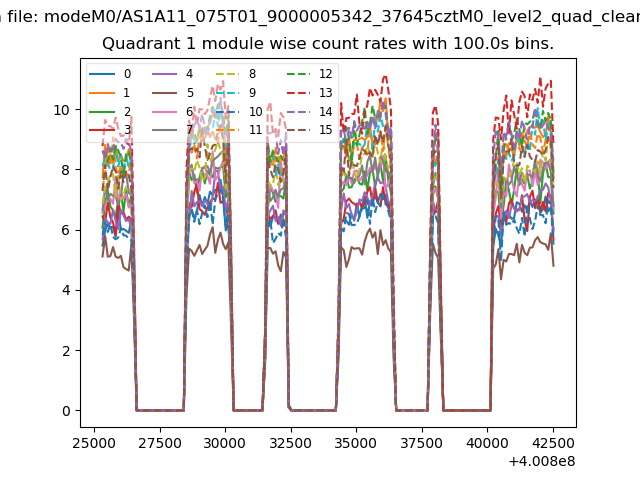
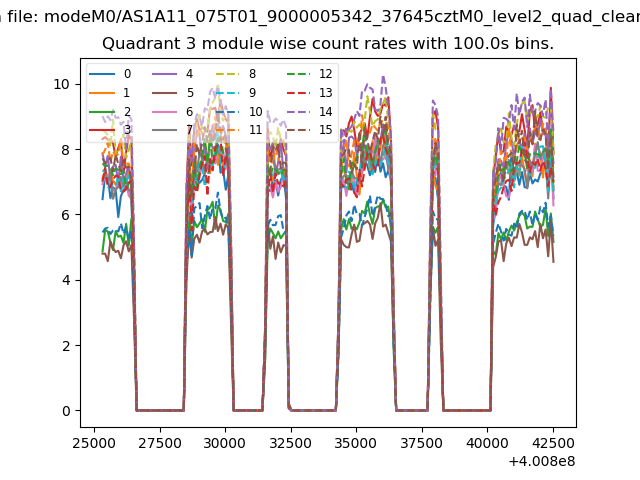
| Module-wise count rates for Quadrant A Data is divided into 100 sec bins |
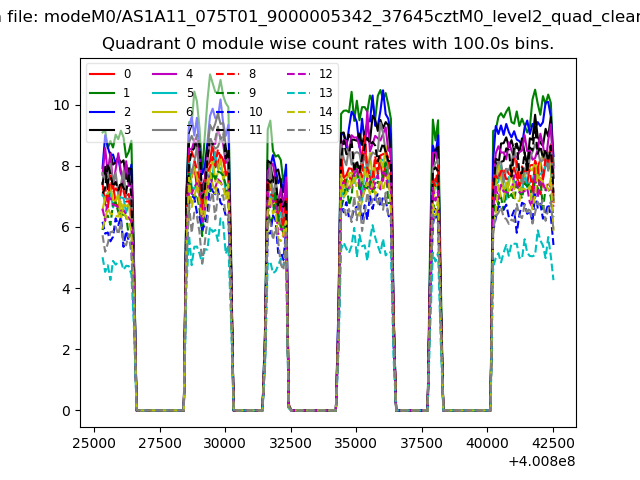 |
 |
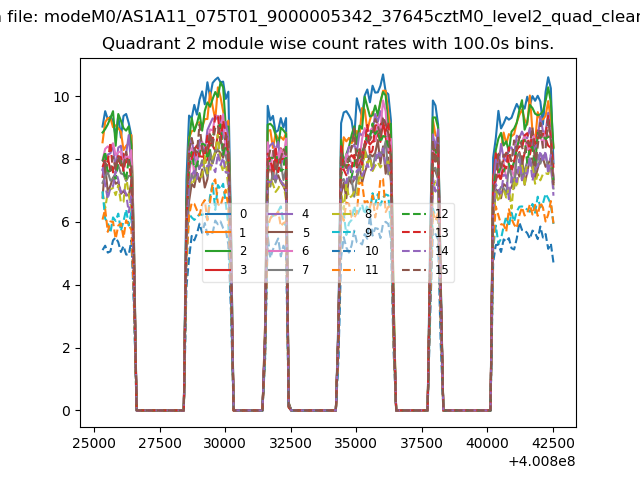
| Module-wise count rates for Quadrant B Data is divided into 100 sec bins |
 |
 |
| Module-wise count rates for Quadrant C Data is divided into 100 sec bins |
 |
 |
| Module-wise count rates for Quadrant D Data is divided into 100 sec bins |
 |
 |
| Parameter | Plot |
|---|---|
| CZT HV Monitor | 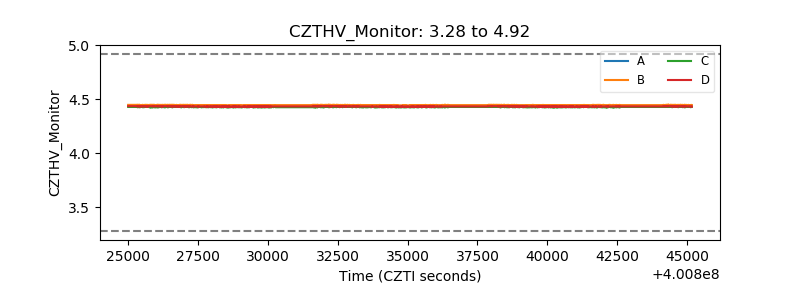 |
| D_VDD | 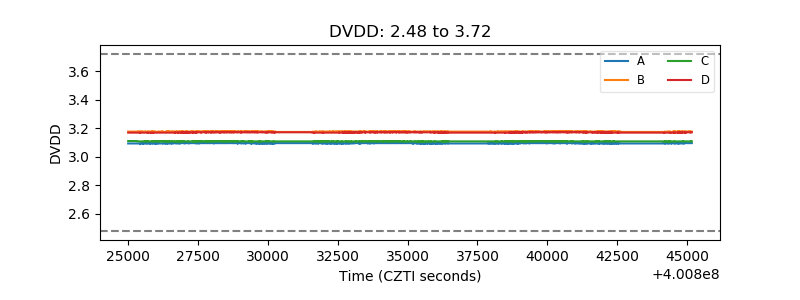 |
| Temperature 1 | 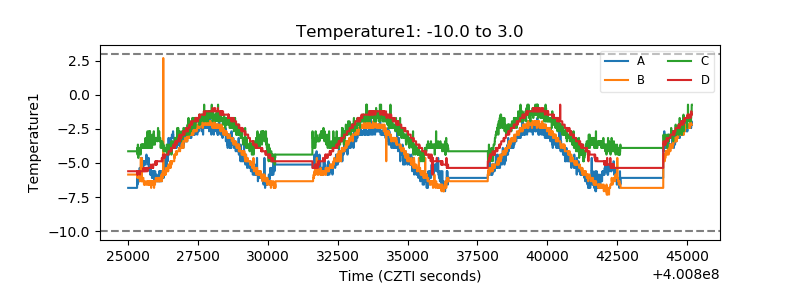 |
| Veto HV Monitor | 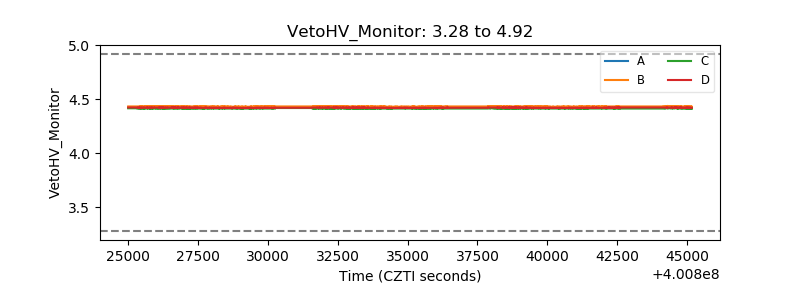 |
| Veto LLD | 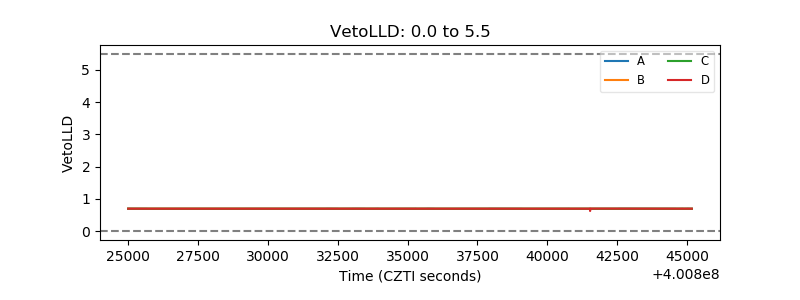 |
| Alpha Counter | 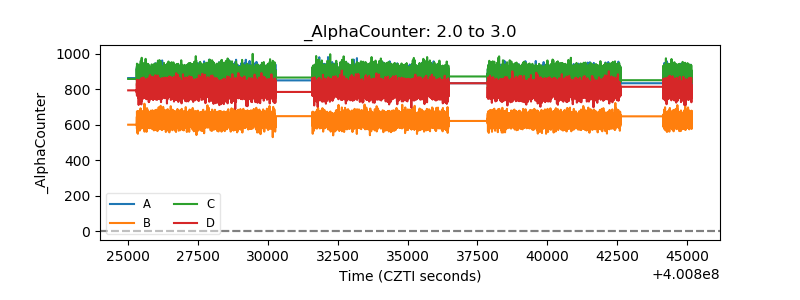 |
| _CPM_Rate | 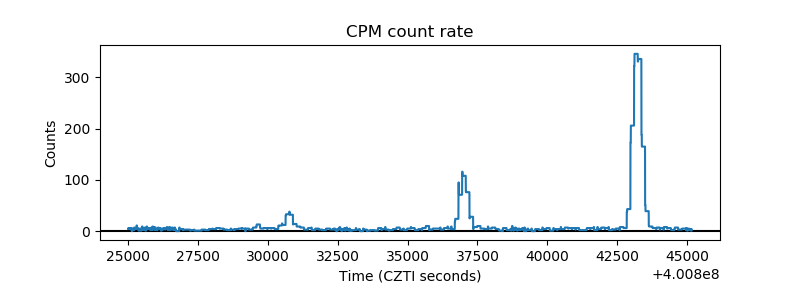 |
| CZT Counter | 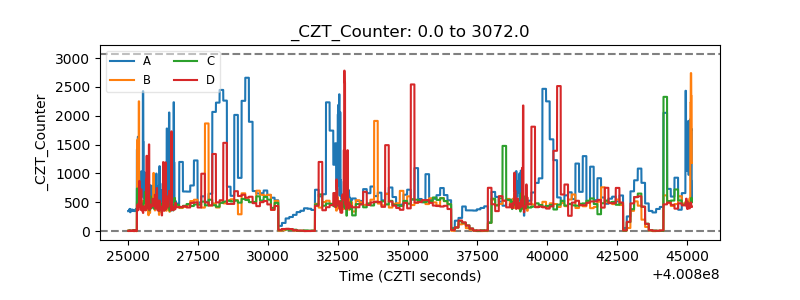 |
| +2.5 Volts monitor | 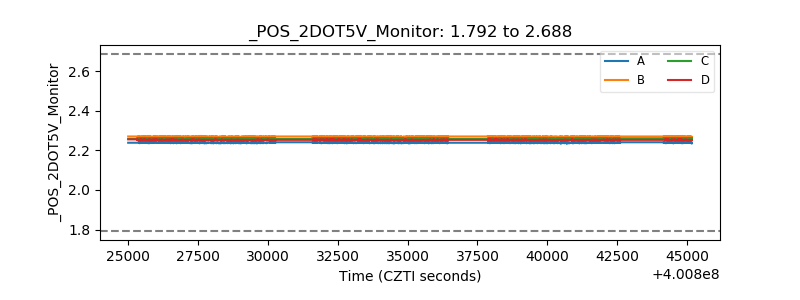 |
| +5 Volts monitor | 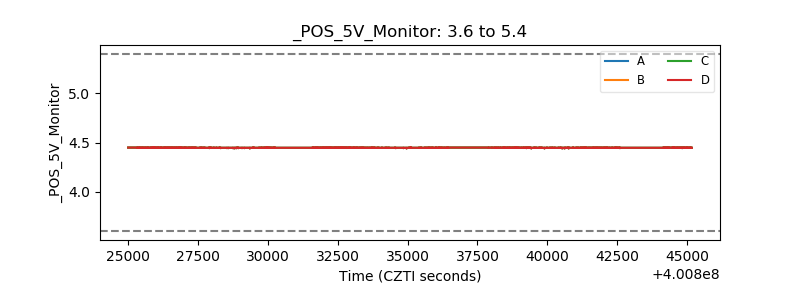 |
| _ROLL_ROT | 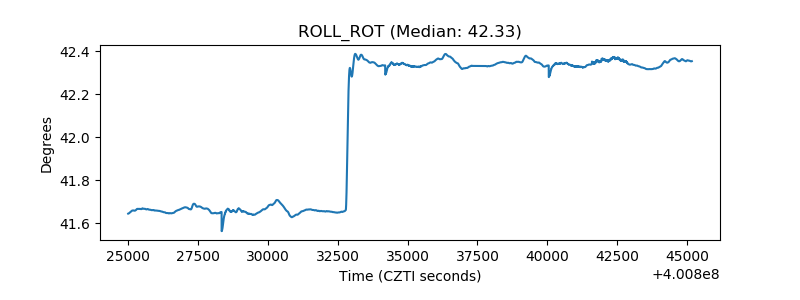 |
| _Roll_DEC | 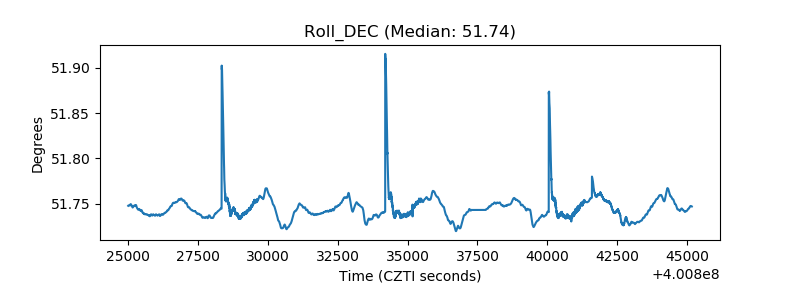 |
| _Roll_RA | 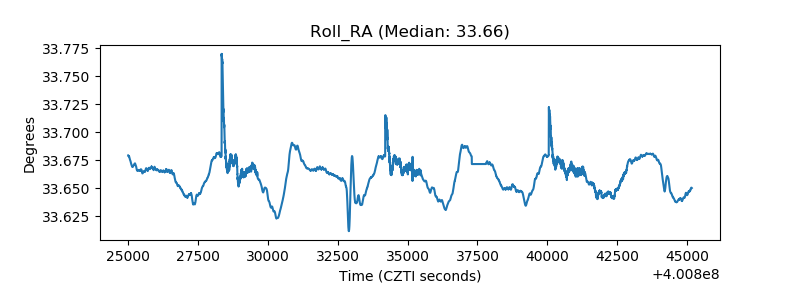 |
| Veto Counter | 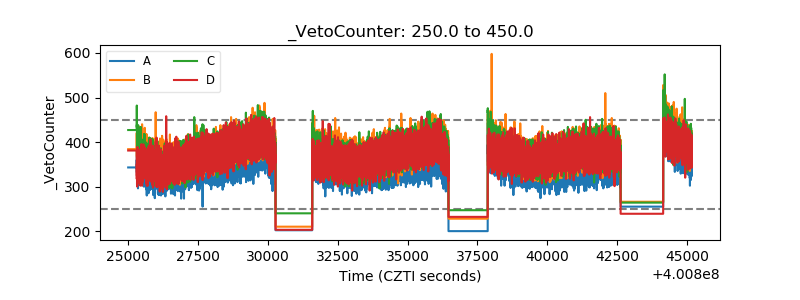 |