| Param | Original file | Final file |
|---|---|---|
| Filename | modeM0/AS1A11_075T01_9000005342_37646cztM0_level2.evt | modeM0/AS1A11_075T01_9000005342_37646cztM0_level2_quad_clean.evt |
| Size (bytes) | 503,375,040 | 56,220,480 |
| Size | 480.1 MB | 53.6 MB |
| Events in quadrant A | 5,240,543 | 327,564 |
| Events in quadrant B | 3,267,237 | 337,217 |
| Events in quadrant C | 2,819,566 | 335,825 |
| Events in quadrant D | 3,541,511 | 313,379 |
| Mode SS | |||
|---|---|---|---|
| Quadrant | BADHDUFLAG | Total packets | Discarded packets |
| A | 0 | 114 | 0 |
| B | 0 | 114 | 0 |
| C | 0 | 114 | 0 |
| D | 0 | 114 | 0 |
| Mode M0 | |||
|---|---|---|---|
| Quadrant | BADHDUFLAG | Total packets | Discarded packets |
| A | 0 | 19313 | 3 |
| B | 0 | 13153 | 2 |
| C | 0 | 11559 | 2 |
| D | 0 | 14182 | 2 |
| Mode M9 | |||
|---|---|---|---|
| Quadrant | BADHDUFLAG | Total packets | Discarded packets |
| A | 0 | 28 | 0 |
| B | 0 | 28 | 0 |
| C | 0 | 28 | 0 |
| D | 0 | 29 | 0 |
| Quadrant | Total seconds | Saturated seconds | Saturation percentage |
|---|---|---|---|
| A | 5543 | 324 | 5.845210% |
| B | 5543 | 163 | 2.940646% |
| C | 5543 | 15 | 0.270612% |
| D | 5543 | 177 | 3.193217% |
Noise dominated data is calculated using 1-second bins in cleaned event files. If a bin has >2000 counts, and if more than 50% of those come from <1% of pixels, then it is considered to be noise-dominated and hence unusable.
| Quadrant | # 1 sec bins | Bins with >0 counts | Bins with >2000 counts | High rate bins dominated by noise | Noise dominated (total time) | Noise dominated (detector-on time) | Marked lightcurve |
|---|---|---|---|---|---|---|---|
| A | 7186 | 5543 | 206 | 206 | 2.87% | 3.72% | 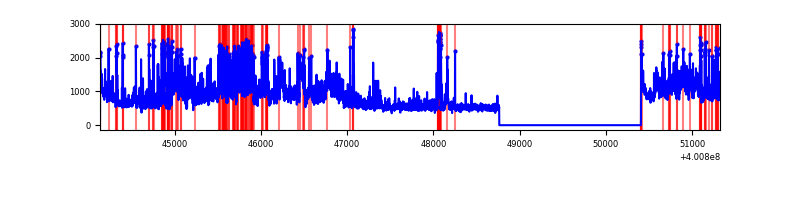 |
| B | 7185 | 5542 | 135 | 135 | 1.88% | 2.44% | 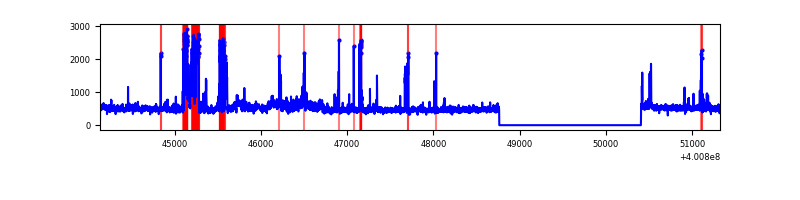 |
| C | 7185 | 5542 | 9 | 9 | 0.13% | 0.16% | 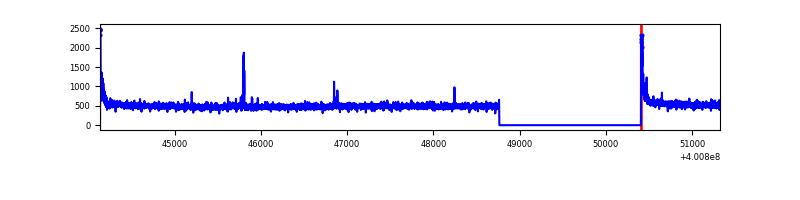 |
| D | 7185 | 5542 | 177 | 177 | 2.46% | 3.19% | 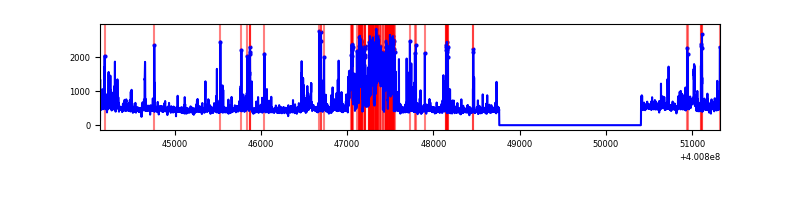 |
Top three noisy pixels from each quadrant. If the there are fewer than three noisy pixels in the level2.evt file, extra rows are filled as -1
| Pixel properties | Quadrant properties | ||||||
|---|---|---|---|---|---|---|---|
| Quadrant | DetID | PixID | Counts | Sigma | Mean | Median | Sigma |
| A | 15 | 222 | 2141620 | 16560.84 | 639 | 625 | 129.3 |
| A | 10 | 83 | 326250 | 2518.75 | 639 | 625 | 129.3 |
| A | 9 | 143 | 143392 | 1104.32 | 639 | 625 | 129.3 |
| B | 5 | 255 | 399929 | 3162.32 | 641 | 624 | 126.3 |
| B | 5 | 172 | 198285 | 1565.39 | 641 | 624 | 126.3 |
| B | 5 | 184 | 34442 | 267.82 | 641 | 624 | 126.3 |
| C | 15 | 214 | 258870 | 1764.99 | 631 | 635 | 146.3 |
| C | 0 | 10 | 73603 | 498.72 | 631 | 635 | 146.3 |
| C | 14 | 254 | 23450 | 155.94 | 631 | 635 | 146.3 |
| D | 2 | 249 | 645820 | 4270.57 | 627 | 609 | 151.1 |
| D | 13 | 249 | 206809 | 1364.81 | 627 | 609 | 151.1 |
| D | 2 | 153 | 94444 | 621.08 | 627 | 609 | 151.1 |
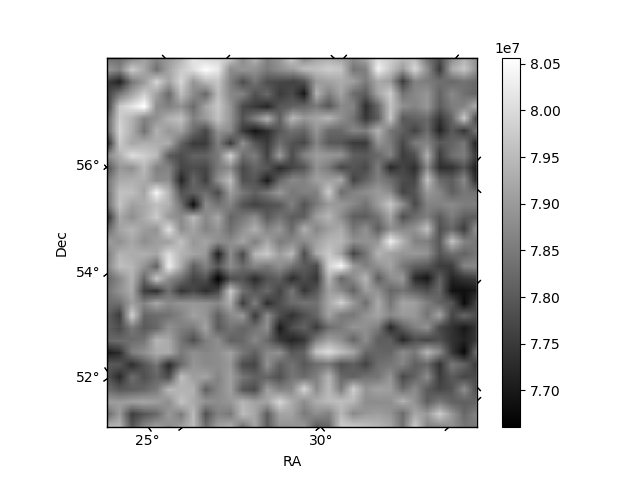
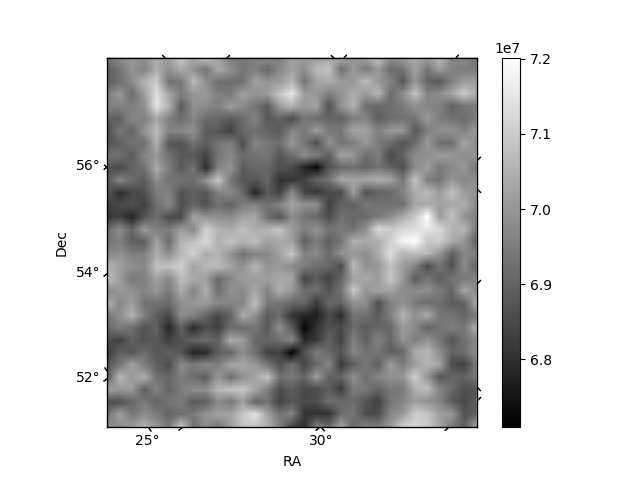
Histogram calculated using DETX and DETY for each event in the final _common_clean file
| Quadrant A | 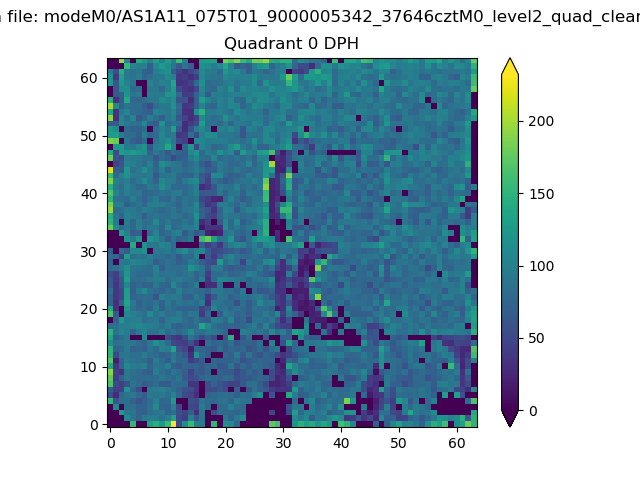 |
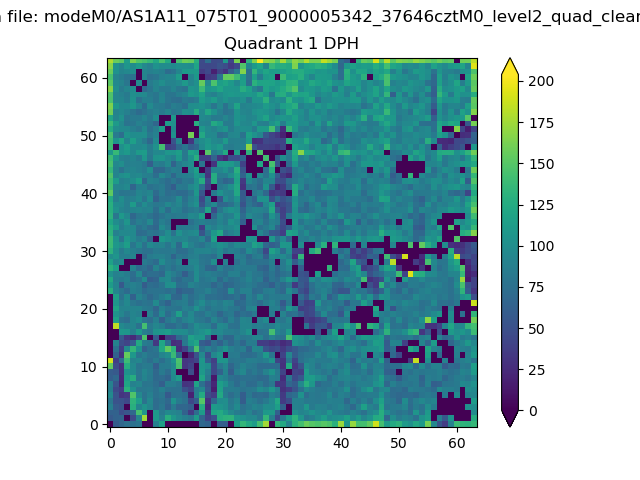 |
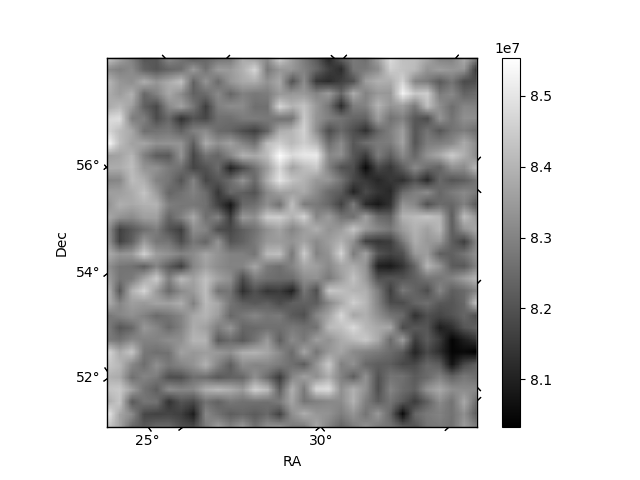
Quadrant B |
|---|---|---|---|
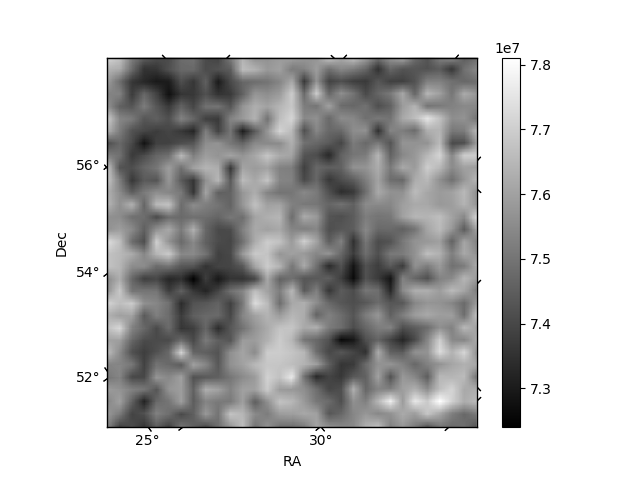
| Quadrant D | 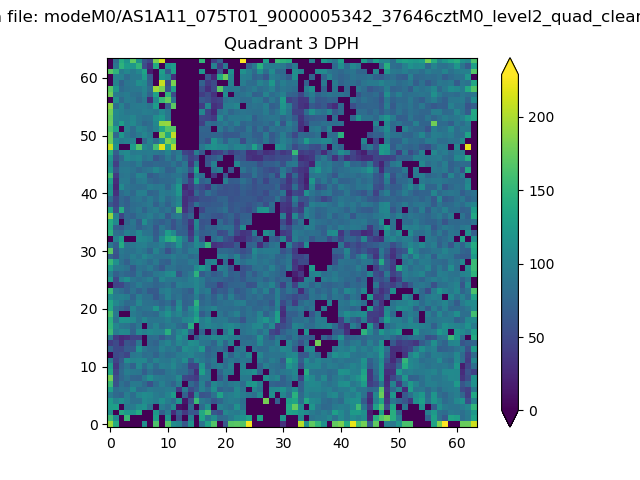 |
 |
Quadrant C |
| Plot type | Count rate plots | Images |
|---|---|---|
| Comparison with Poisson distribution Blue bars denote a histogram of data divided into 1 sec bins. Red curve is a Poisson curve with rate = median count rate of data. |
 |
 |
| Quadrant-wise count rates Data is divided into 100 sec bins |
 |
|
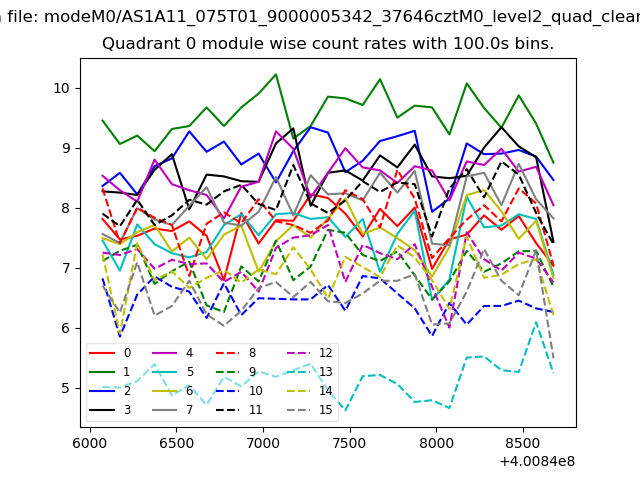
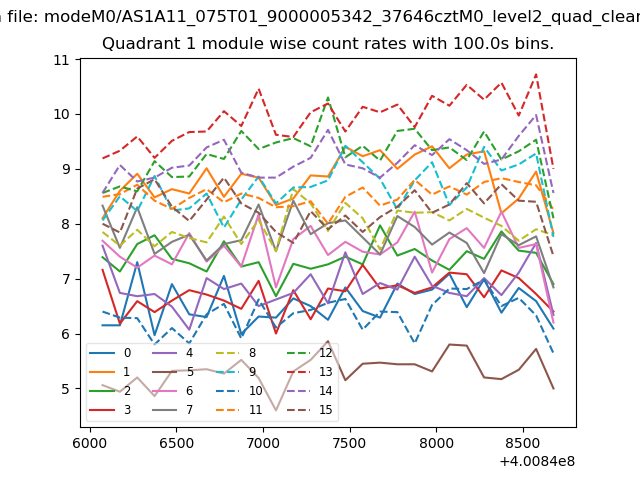
| Module-wise count rates for Quadrant A Data is divided into 100 sec bins |
 |
 |
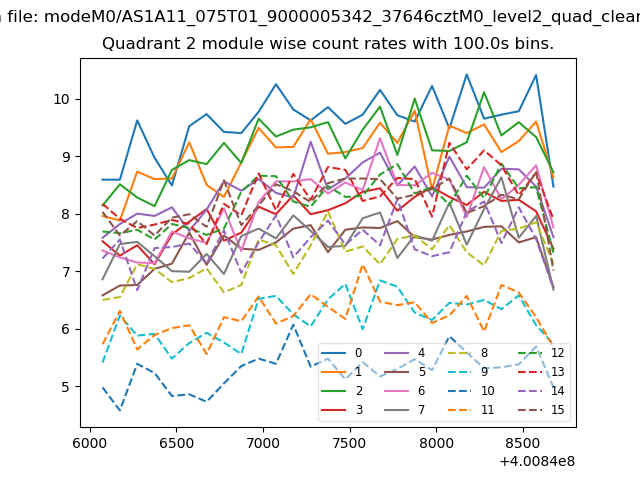
| Module-wise count rates for Quadrant B Data is divided into 100 sec bins |
 |
 |
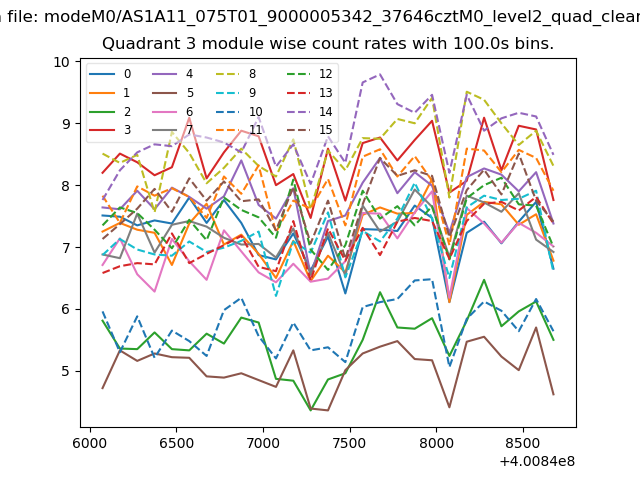
| Module-wise count rates for Quadrant C Data is divided into 100 sec bins |
 |
 |
| Module-wise count rates for Quadrant D Data is divided into 100 sec bins |
 |
 |
| Parameter | Plot |
|---|---|
| CZT HV Monitor | 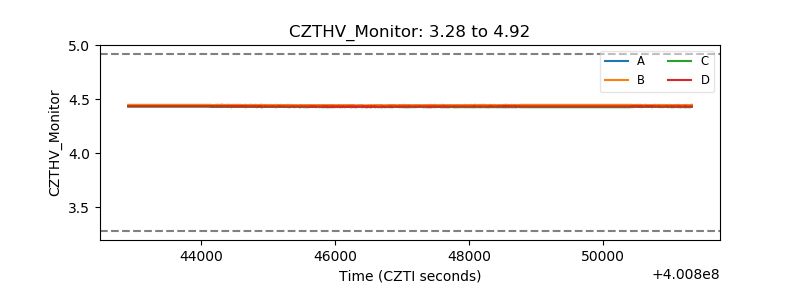 |
| D_VDD | 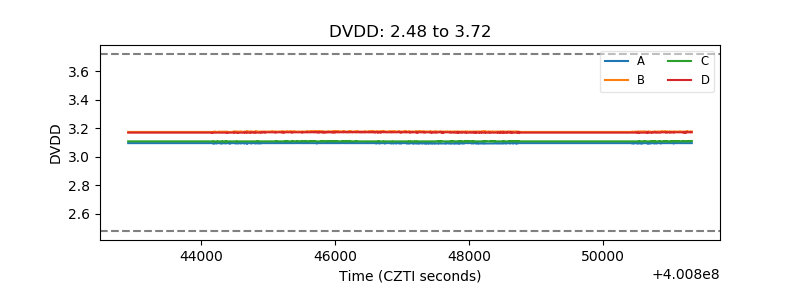 |
| Temperature 1 | 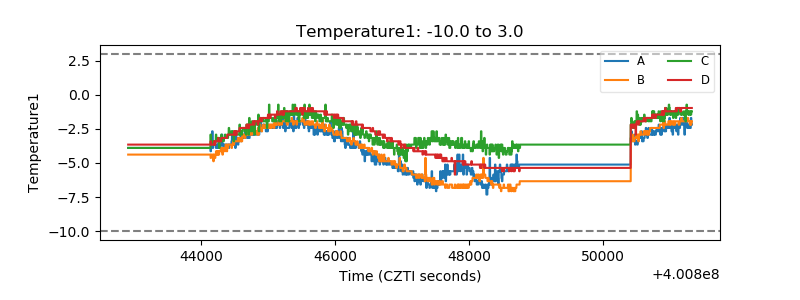 |
| Veto HV Monitor | 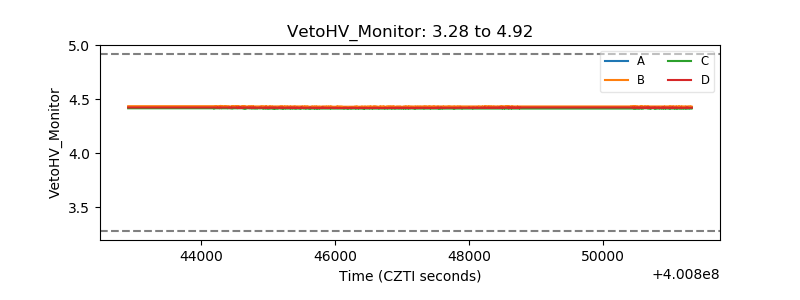 |
| Veto LLD | 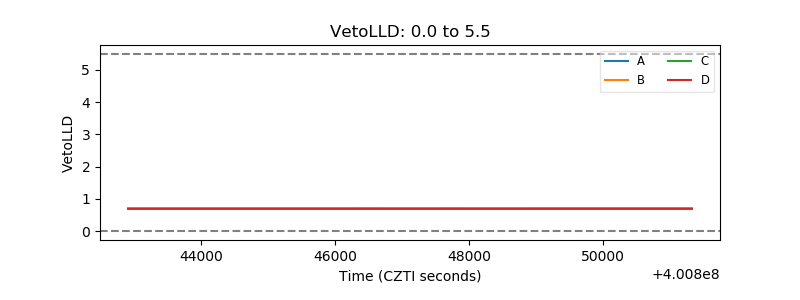 |
| Alpha Counter |  |
| _CPM_Rate |  |
| CZT Counter | 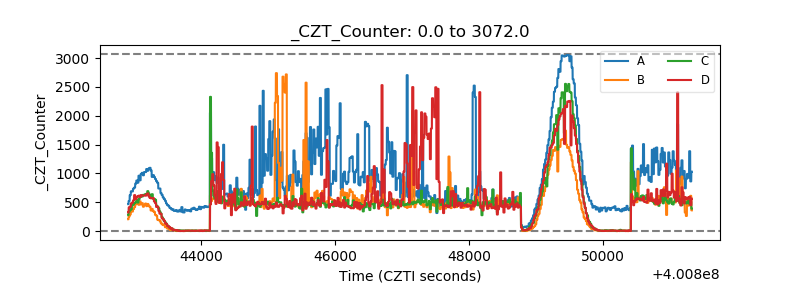 |
| +2.5 Volts monitor | 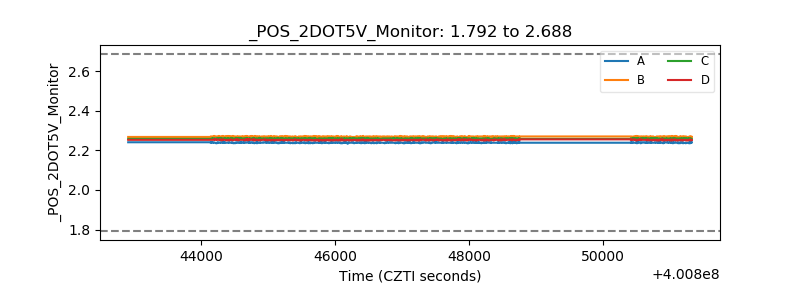 |
| +5 Volts monitor |  |
| _ROLL_ROT | 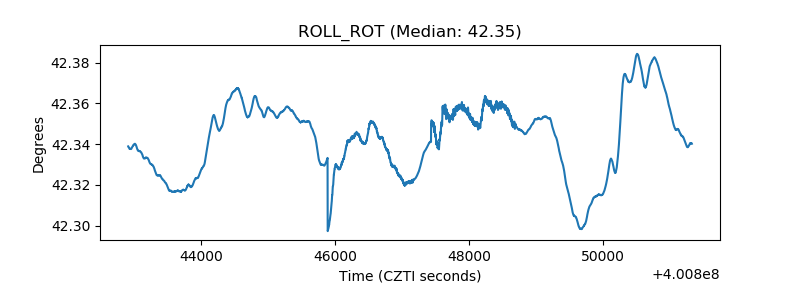 |
| _Roll_DEC | 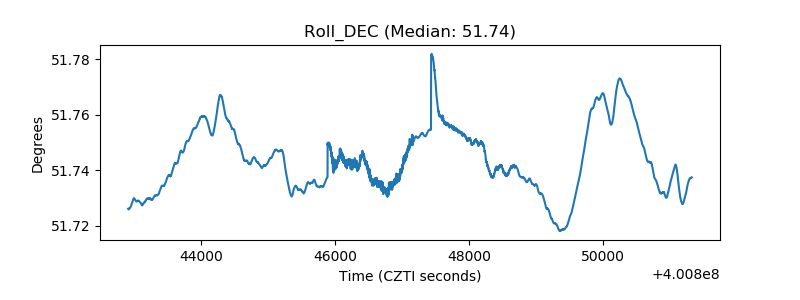 |
| _Roll_RA | 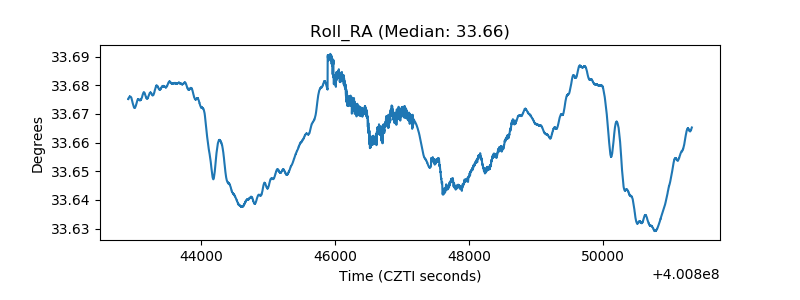 |
| Veto Counter | 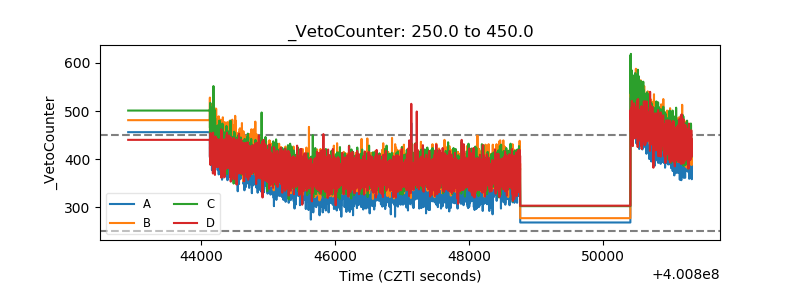 |