| Param | Original file | Final file |
|---|---|---|
| Filename | modeM0/AS1A11_075T01_9000005342_37648cztM0_level2.evt | modeM0/AS1A11_075T01_9000005342_37648cztM0_level2_quad_clean.evt |
| Size (bytes) | 476,228,160 | 61,153,920 |
| Size | 454.2 MB | 58.3 MB |
| Events in quadrant A | 4,535,839 | 369,560 |
| Events in quadrant B | 3,387,757 | 372,840 |
| Events in quadrant C | 2,835,126 | 379,134 |
| Events in quadrant D | 3,298,586 | 352,853 |
| Mode SS | |||
|---|---|---|---|
| Quadrant | BADHDUFLAG | Total packets | Discarded packets |
| A | 0 | 110 | 0 |
| B | 0 | 110 | 0 |
| C | 0 | 110 | 0 |
| D | 0 | 110 | 0 |
| Mode M0 | |||
|---|---|---|---|
| Quadrant | BADHDUFLAG | Total packets | Discarded packets |
| A | 0 | 17158 | 3 |
| B | 0 | 13554 | 2 |
| C | 0 | 11539 | 2 |
| D | 0 | 13309 | 2 |
| Mode M9 | |||
|---|---|---|---|
| Quadrant | BADHDUFLAG | Total packets | Discarded packets |
| A | 0 | 29 | 0 |
| B | 0 | 29 | 0 |
| C | 0 | 29 | 0 |
| D | 0 | 30 | 0 |
| Quadrant | Total seconds | Saturated seconds | Saturation percentage |
|---|---|---|---|
| A | 5383 | 173 | 3.213821% |
| B | 5383 | 195 | 3.622515% |
| C | 5383 | 24 | 0.445848% |
| D | 5383 | 145 | 2.693665% |
Noise dominated data is calculated using 1-second bins in cleaned event files. If a bin has >2000 counts, and if more than 50% of those come from <1% of pixels, then it is considered to be noise-dominated and hence unusable.
| Quadrant | # 1 sec bins | Bins with >0 counts | Bins with >2000 counts | High rate bins dominated by noise | Noise dominated (total time) | Noise dominated (detector-on time) | Marked lightcurve |
|---|---|---|---|---|---|---|---|
| A | 7175 | 5383 | 94 | 94 | 1.31% | 1.75% | 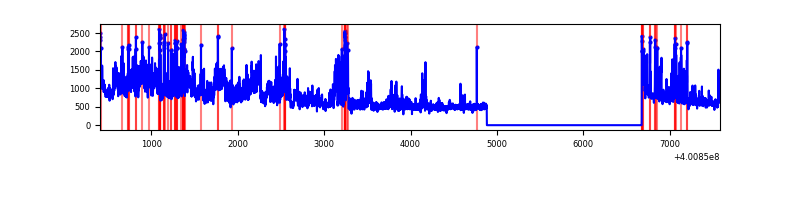 |
| B | 7175 | 5382 | 147 | 147 | 2.05% | 2.73% | 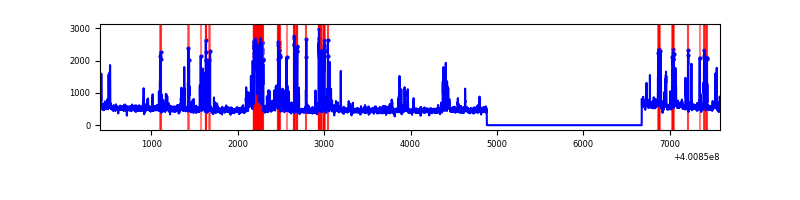 |
| C | 7175 | 5382 | 18 | 18 | 0.25% | 0.33% | 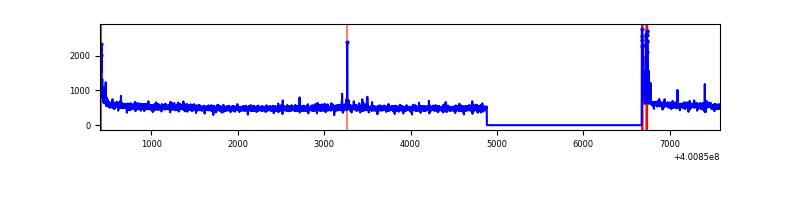 |
| D | 7175 | 5382 | 126 | 126 | 1.76% | 2.34% | 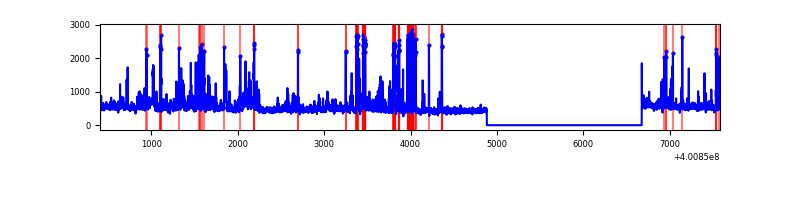 |
Top three noisy pixels from each quadrant. If the there are fewer than three noisy pixels in the level2.evt file, extra rows are filled as -1
| Pixel properties | Quadrant properties | ||||||
|---|---|---|---|---|---|---|---|
| Quadrant | DetID | PixID | Counts | Sigma | Mean | Median | Sigma |
| A | 15 | 222 | 1388464 | 10704.41 | 644 | 630 | 129.7 |
| A | 10 | 83 | 318140 | 2448.96 | 644 | 630 | 129.7 |
| A | 6 | 10 | 185677 | 1427.27 | 644 | 630 | 129.7 |
| B | 5 | 172 | 382482 | 3150.95 | 637 | 622 | 121.2 |
| B | 5 | 200 | 232753 | 1915.45 | 637 | 622 | 121.2 |
| B | 15 | 85 | 94936 | 778.24 | 637 | 622 | 121.2 |
| C | 15 | 214 | 249143 | 1704.55 | 632 | 636 | 145.8 |
| C | 0 | 10 | 77533 | 527.45 | 632 | 636 | 145.8 |
| C | 14 | 254 | 30463 | 204.59 | 632 | 636 | 145.8 |
| D | 2 | 249 | 367820 | 2394.06 | 627 | 609 | 153.4 |
| D | 13 | 249 | 188555 | 1225.33 | 627 | 609 | 153.4 |
| D | 2 | 153 | 113338 | 734.94 | 627 | 609 | 153.4 |
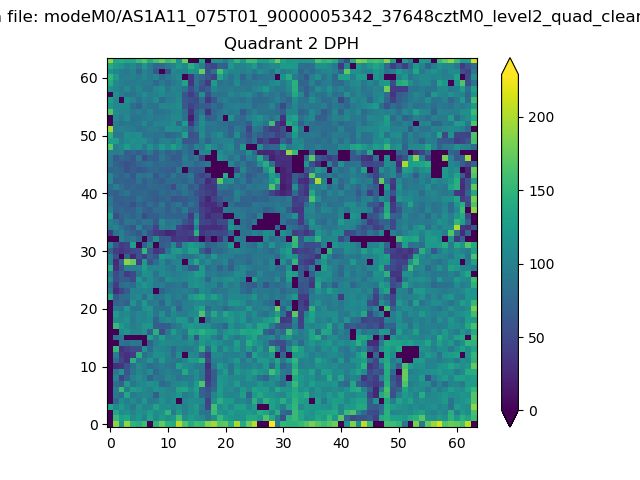
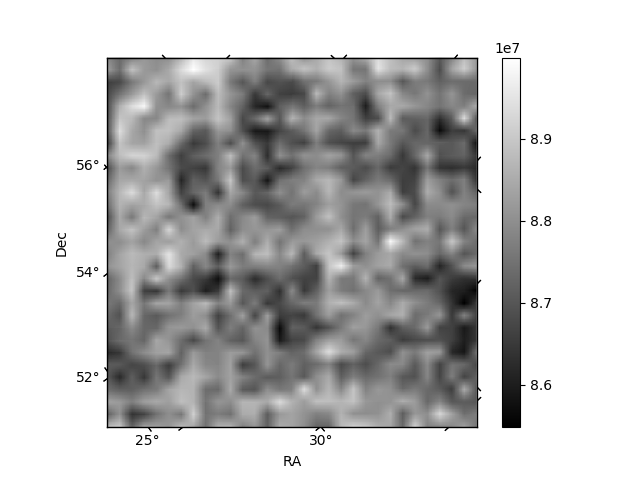
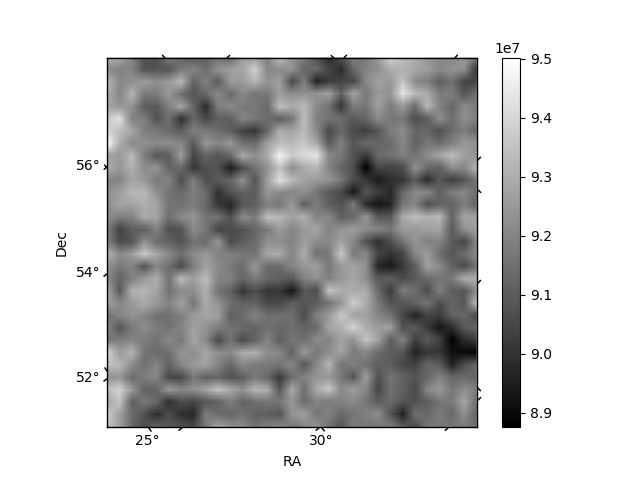
Histogram calculated using DETX and DETY for each event in the final _common_clean file
| Quadrant A | 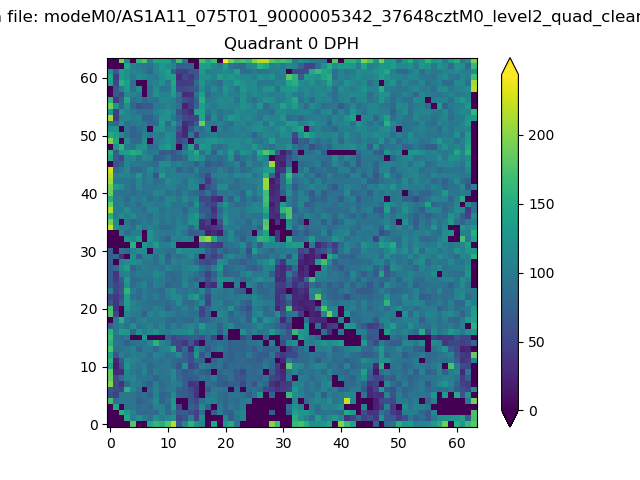 |
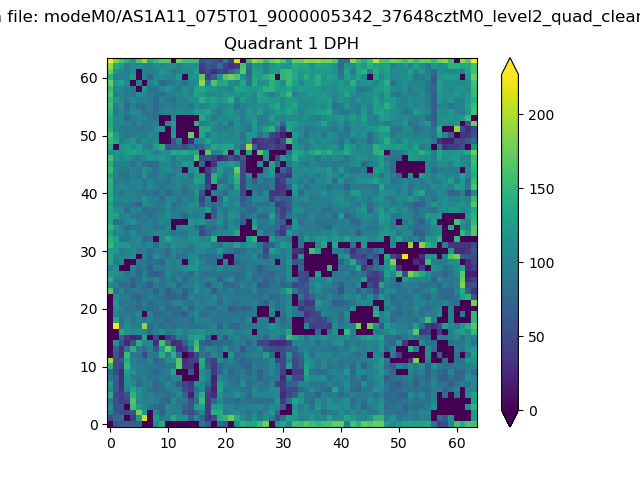 |
Quadrant B |
|---|---|---|---|
| Quadrant D | 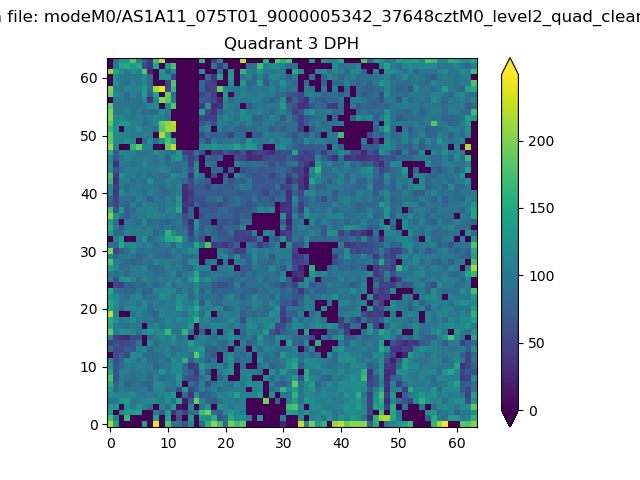 |
 |
Quadrant C |
| Plot type | Count rate plots | Images |
|---|---|---|
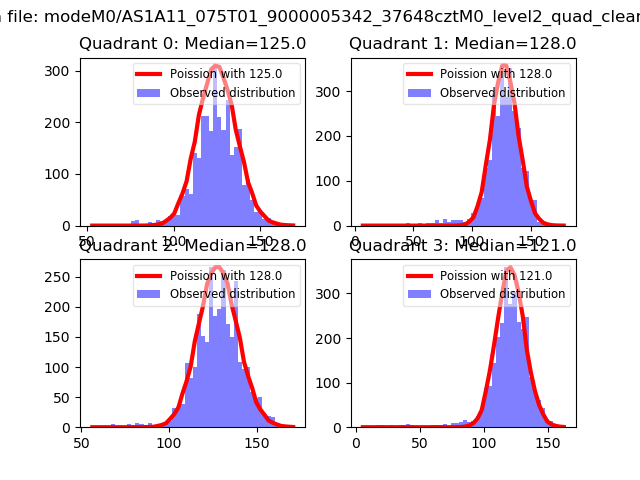
| Comparison with Poisson distribution Blue bars denote a histogram of data divided into 1 sec bins. Red curve is a Poisson curve with rate = median count rate of data. |
 |
 |
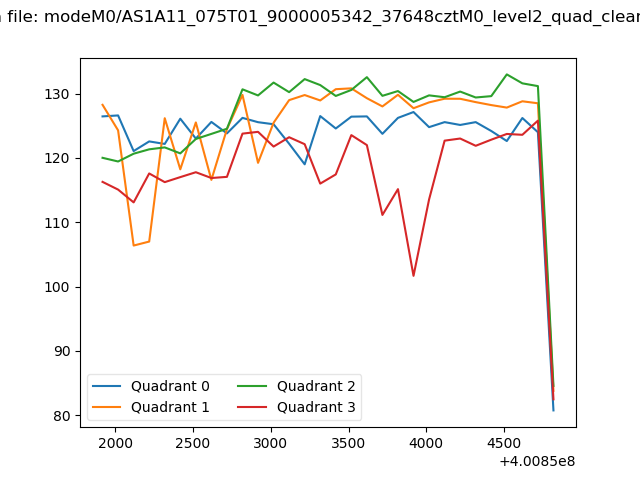
| Quadrant-wise count rates Data is divided into 100 sec bins |
 |
|
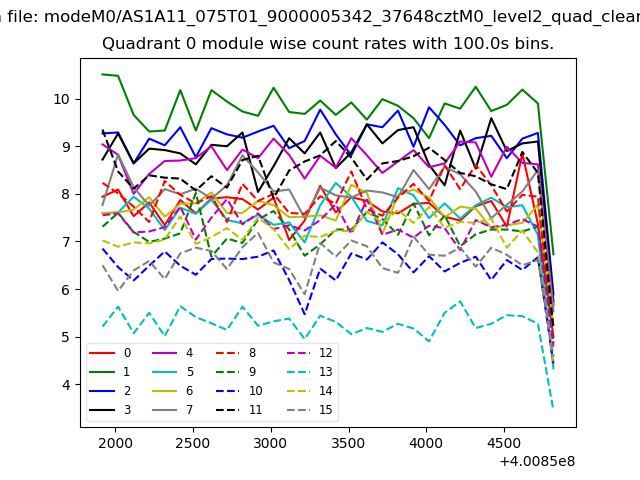
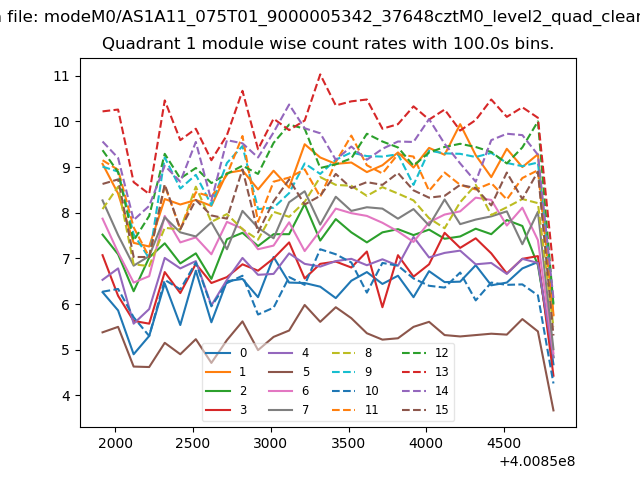
| Module-wise count rates for Quadrant A Data is divided into 100 sec bins |
 |
 |
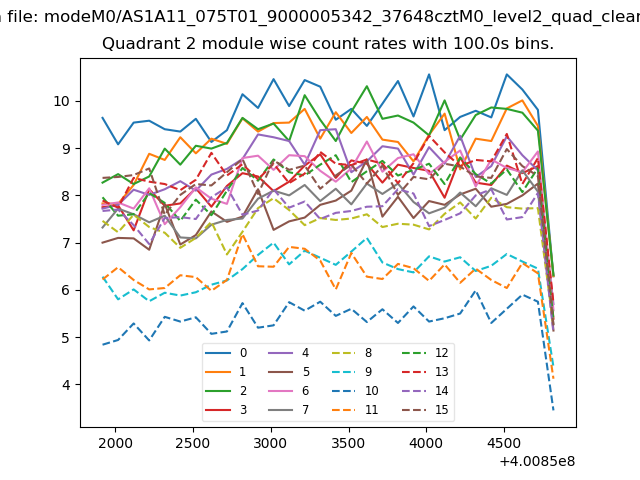
| Module-wise count rates for Quadrant B Data is divided into 100 sec bins |
 |
 |
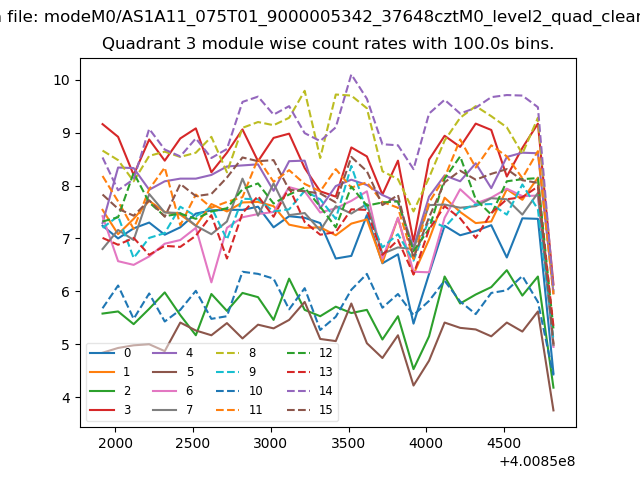
| Module-wise count rates for Quadrant C Data is divided into 100 sec bins |
 |
 |
| Module-wise count rates for Quadrant D Data is divided into 100 sec bins |
 |
 |
| Parameter | Plot |
|---|---|
| CZT HV Monitor | 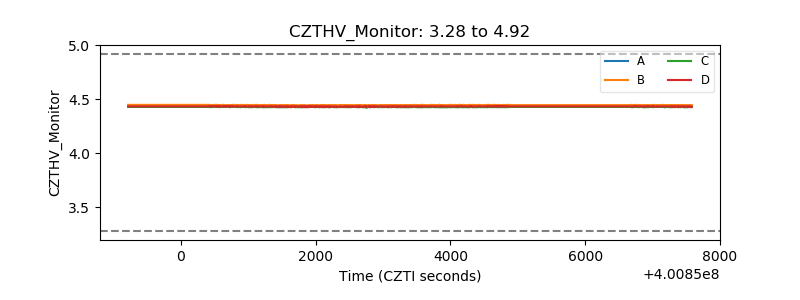 |
| D_VDD | 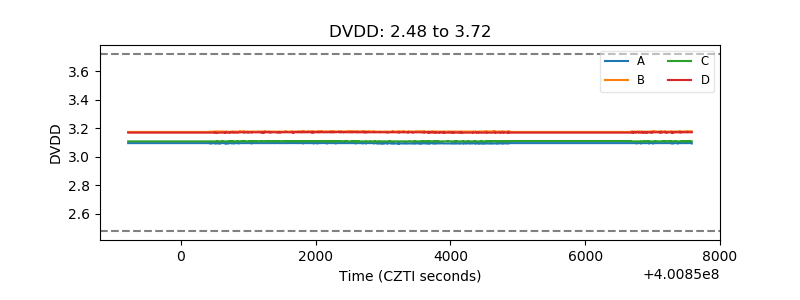 |
| Temperature 1 | 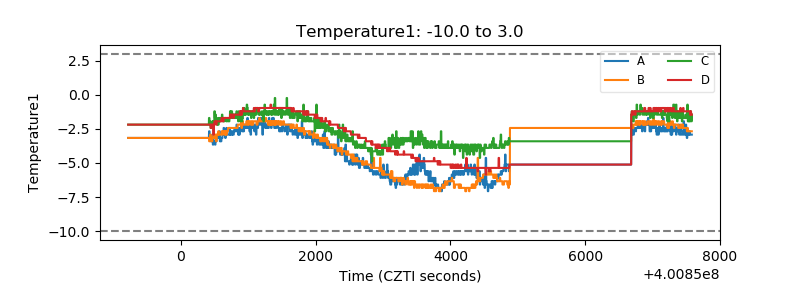 |
| Veto HV Monitor | 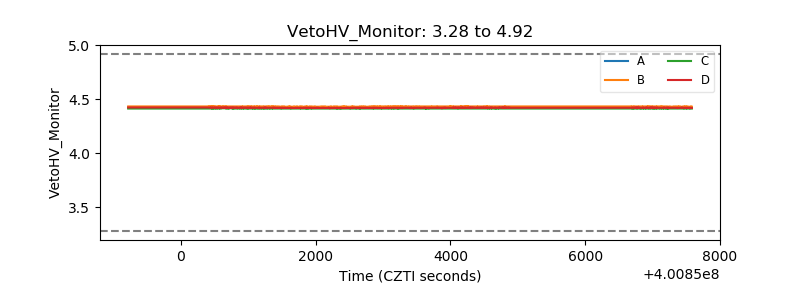 |
| Veto LLD | 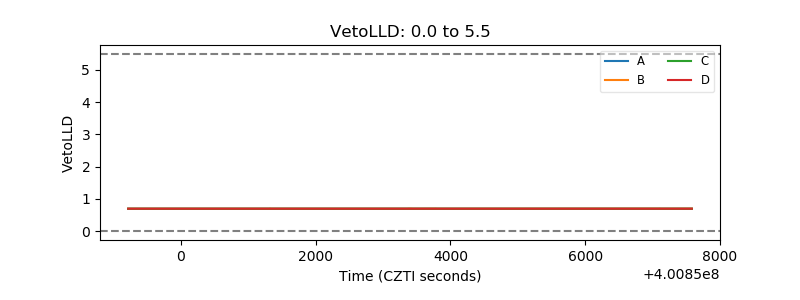 |
| Alpha Counter | 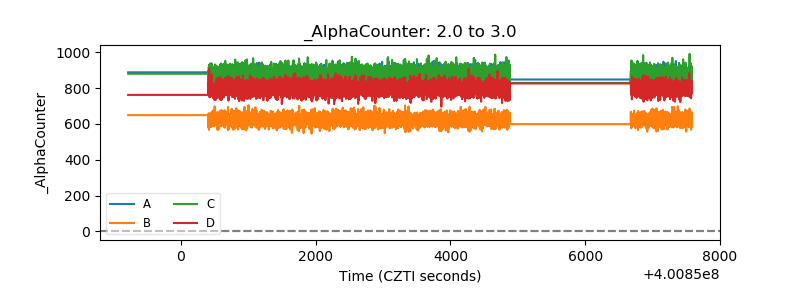 |
| _CPM_Rate |  |
| CZT Counter | 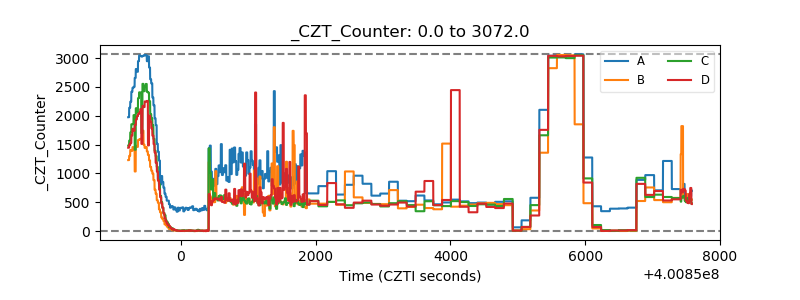 |
| +2.5 Volts monitor | 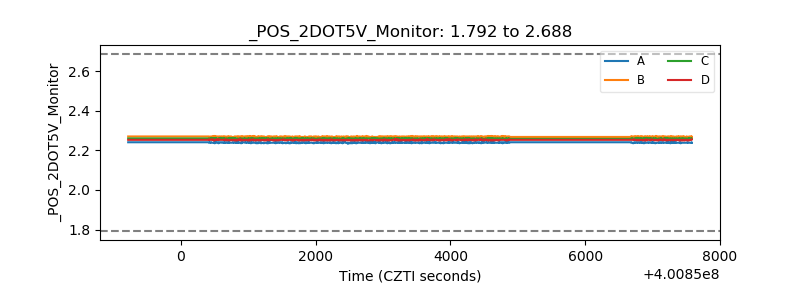 |
| +5 Volts monitor | 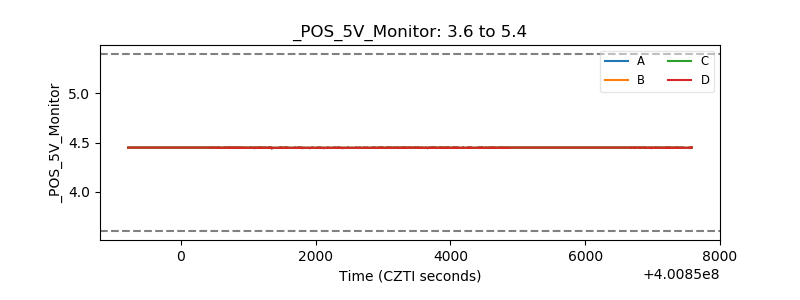 |
| _ROLL_ROT | 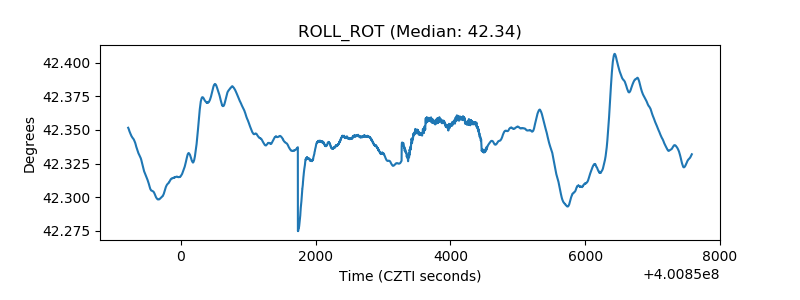 |
| _Roll_DEC | 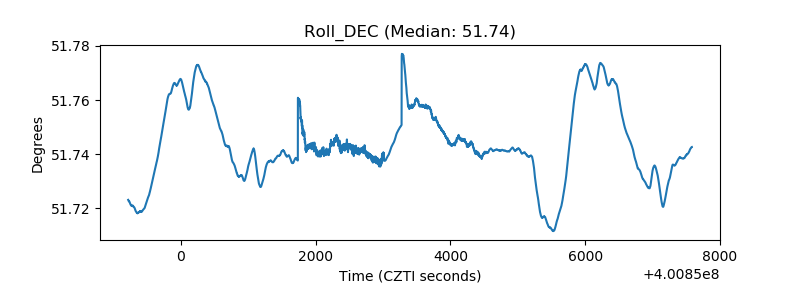 |
| _Roll_RA | 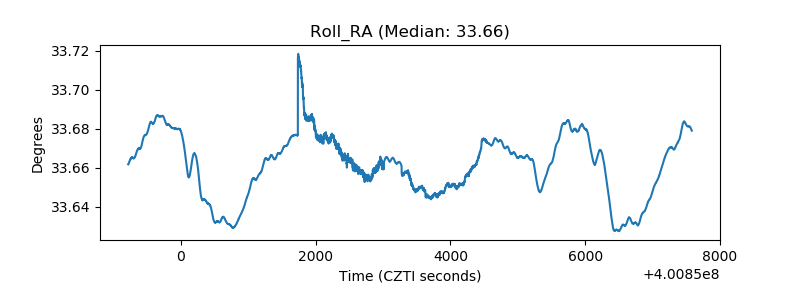 |
| Veto Counter | 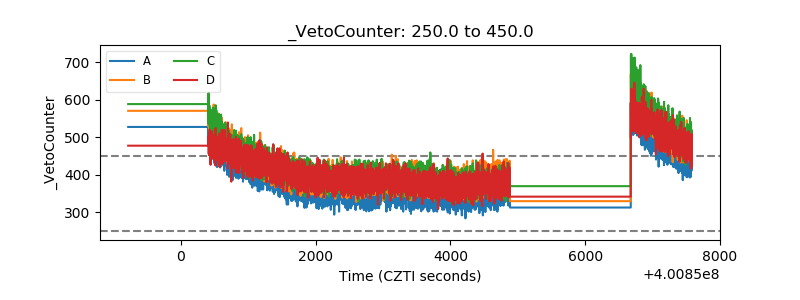 |