| Param | Original file | Final file |
|---|---|---|
| Filename | modeM0/AS1A11_075T01_9000005342_37649cztM0_level2.evt | modeM0/AS1A11_075T01_9000005342_37649cztM0_level2_quad_clean.evt |
| Size (bytes) | 464,163,840 | 74,085,120 |
| Size | 442.7 MB | 70.7 MB |
| Events in quadrant A | 4,640,275 | 462,566 |
| Events in quadrant B | 3,162,762 | 479,894 |
| Events in quadrant C | 2,957,997 | 478,606 |
| Events in quadrant D | 2,939,749 | 454,329 |
| Mode SS | |||
|---|---|---|---|
| Quadrant | BADHDUFLAG | Total packets | Discarded packets |
| A | 0 | 108 | 0 |
| B | 0 | 108 | 0 |
| C | 0 | 108 | 0 |
| D | 0 | 108 | 0 |
| Mode M0 | |||
|---|---|---|---|
| Quadrant | BADHDUFLAG | Total packets | Discarded packets |
| A | 0 | 17638 | 3 |
| B | 0 | 12829 | 2 |
| C | 0 | 11893 | 2 |
| D | 0 | 12196 | 2 |
| Mode M9 | |||
|---|---|---|---|
| Quadrant | BADHDUFLAG | Total packets | Discarded packets |
| A | 0 | 29 | 0 |
| B | 0 | 29 | 0 |
| C | 0 | 29 | 0 |
| D | 0 | 30 | 0 |
| Quadrant | Total seconds | Saturated seconds | Saturation percentage |
|---|---|---|---|
| A | 5250 | 548 | 10.438095% |
| B | 5250 | 143 | 2.723810% |
| C | 5250 | 39 | 0.742857% |
| D | 5250 | 55 | 1.047619% |
Noise dominated data is calculated using 1-second bins in cleaned event files. If a bin has >2000 counts, and if more than 50% of those come from <1% of pixels, then it is considered to be noise-dominated and hence unusable.
| Quadrant | # 1 sec bins | Bins with >0 counts | Bins with >2000 counts | High rate bins dominated by noise | Noise dominated (total time) | Noise dominated (detector-on time) | Marked lightcurve |
|---|---|---|---|---|---|---|---|
| A | 7163 | 5251 | 373 | 373 | 5.21% | 7.10% | 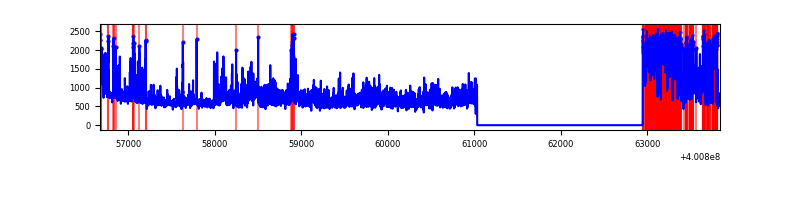 |
| B | 7162 | 5249 | 102 | 102 | 1.42% | 1.94% | 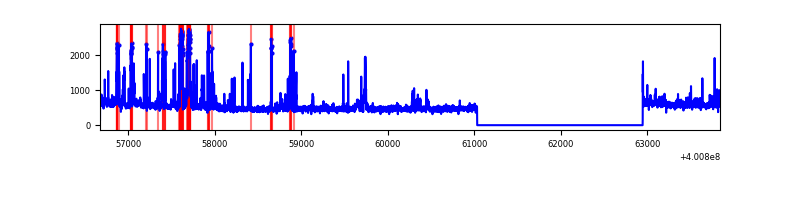 |
| C | 7162 | 5249 | 28 | 28 | 0.39% | 0.53% | 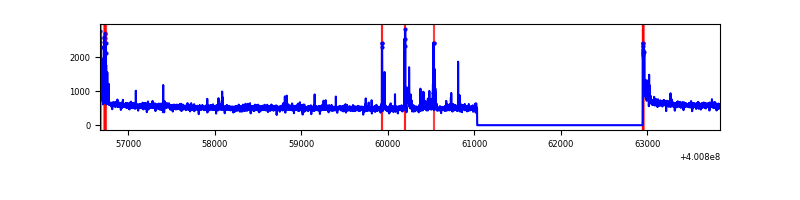 |
| D | 7162 | 5249 | 34 | 34 | 0.47% | 0.65% | 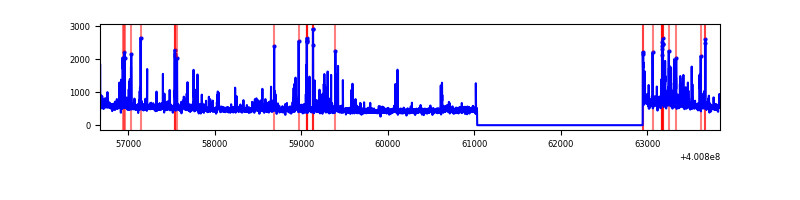 |
Top three noisy pixels from each quadrant. If the there are fewer than three noisy pixels in the level2.evt file, extra rows are filled as -1
| Pixel properties | Quadrant properties | ||||||
|---|---|---|---|---|---|---|---|
| Quadrant | DetID | PixID | Counts | Sigma | Mean | Median | Sigma |
| A | 15 | 222 | 1718147 | 13833.07 | 622 | 611 | 124.2 |
| A | 10 | 83 | 290971 | 2338.57 | 622 | 611 | 124.2 |
| A | 9 | 143 | 92740 | 742.01 | 622 | 611 | 124.2 |
| B | 5 | 172 | 455631 | 3754.68 | 646 | 629 | 121.2 |
| B | 15 | 35 | 51366 | 418.68 | 646 | 629 | 121.2 |
| B | 0 | 230 | 37476 | 304.06 | 646 | 629 | 121.2 |
| C | 15 | 214 | 242481 | 1639.66 | 644 | 650 | 147.5 |
| C | 14 | 254 | 116929 | 788.39 | 644 | 650 | 147.5 |
| C | 0 | 10 | 77789 | 523.02 | 644 | 650 | 147.5 |
| D | 13 | 249 | 108378 | 698.15 | 640 | 624 | 154.3 |
| D | 2 | 249 | 102107 | 657.52 | 640 | 624 | 154.3 |
| D | 2 | 250 | 93348 | 600.77 | 640 | 624 | 154.3 |
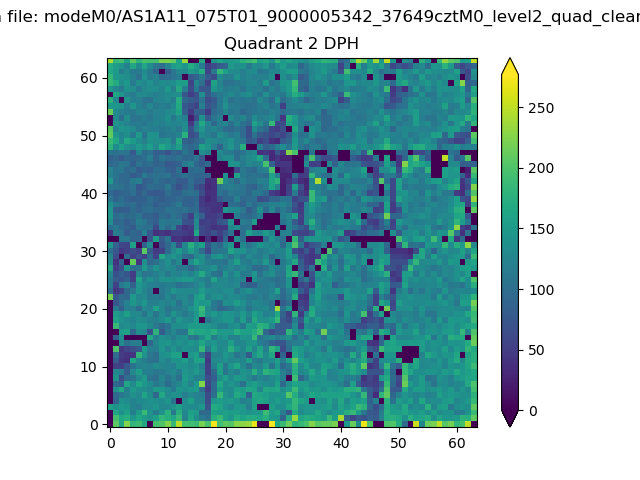
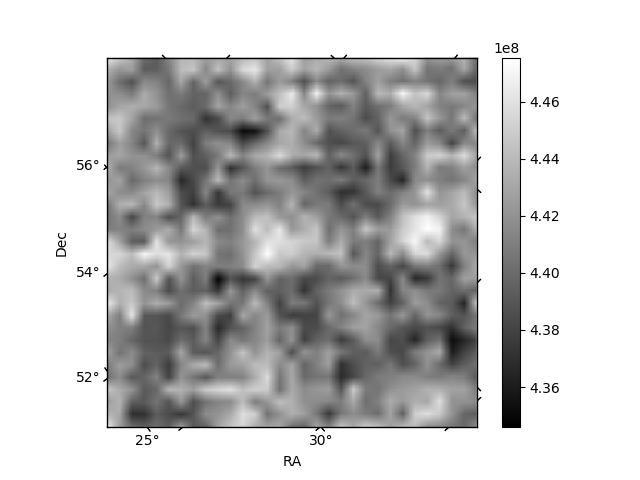
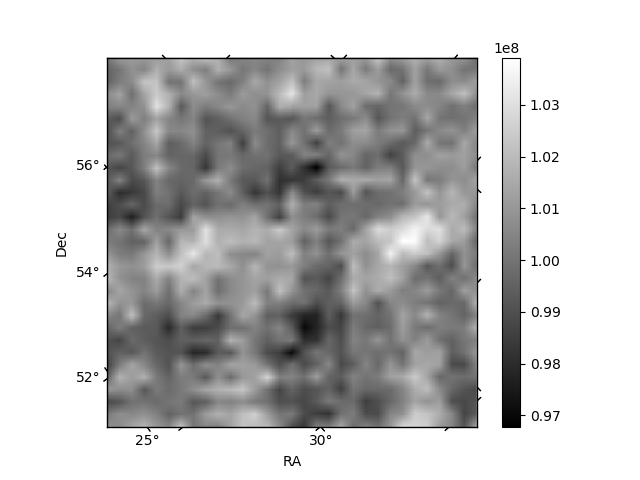
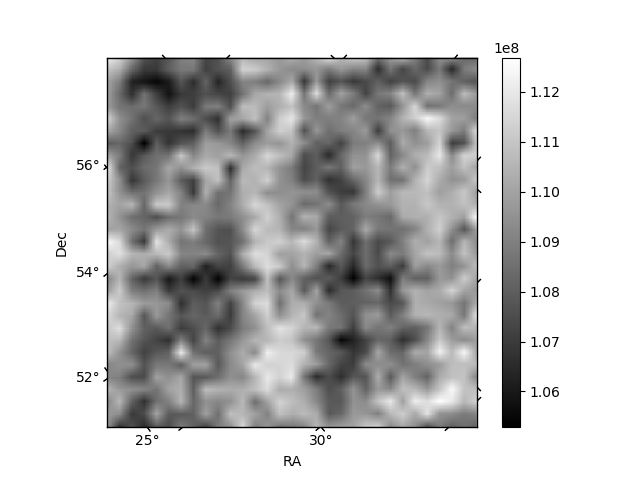
Histogram calculated using DETX and DETY for each event in the final _common_clean file
| Quadrant A | 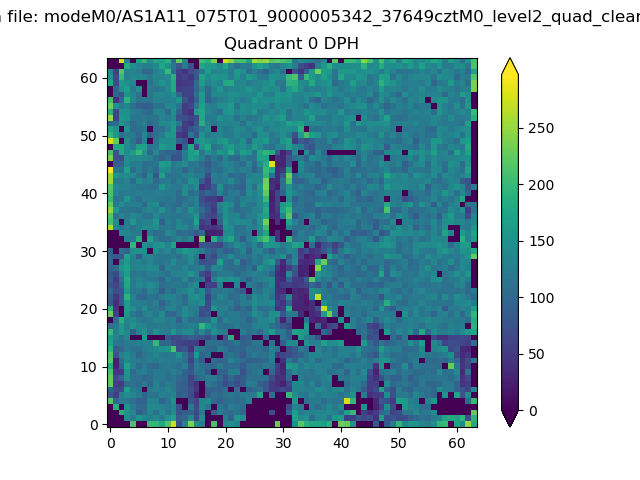 |
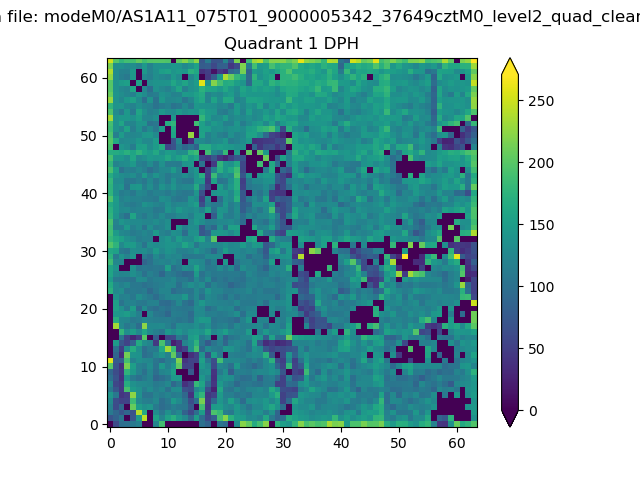 |
Quadrant B |
|---|---|---|---|
| Quadrant D | 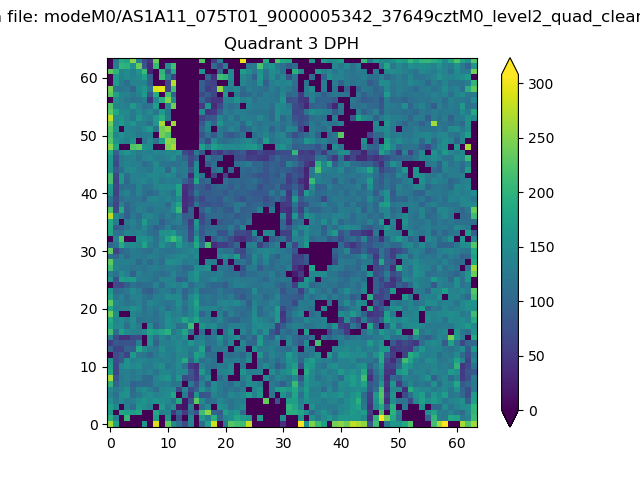 |
 |
Quadrant C |
| Plot type | Count rate plots | Images |
|---|---|---|
| Comparison with Poisson distribution Blue bars denote a histogram of data divided into 1 sec bins. Red curve is a Poisson curve with rate = median count rate of data. |
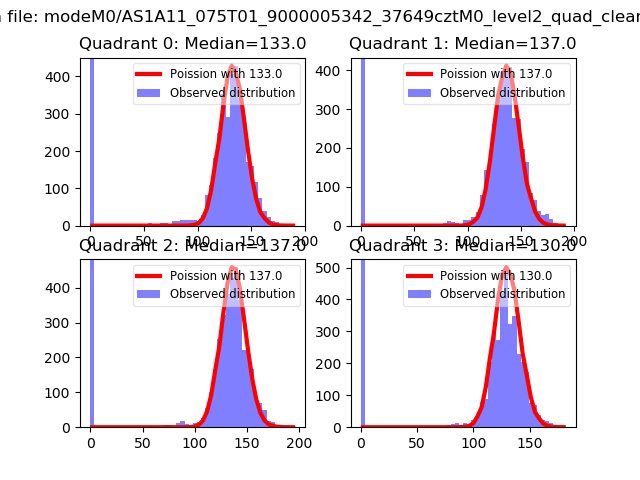 |
 |
| Quadrant-wise count rates Data is divided into 100 sec bins |
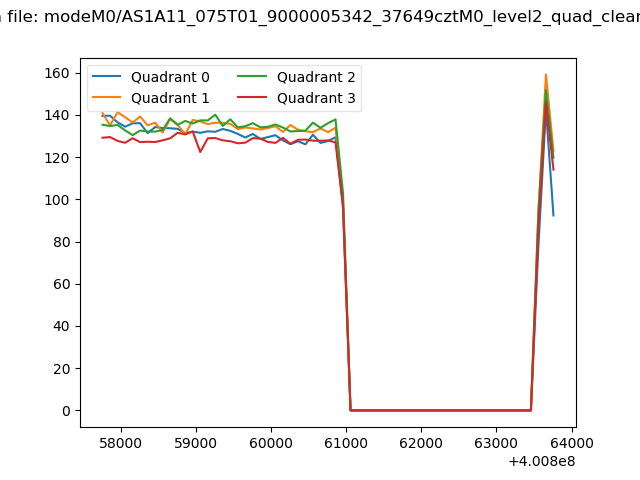 |
|
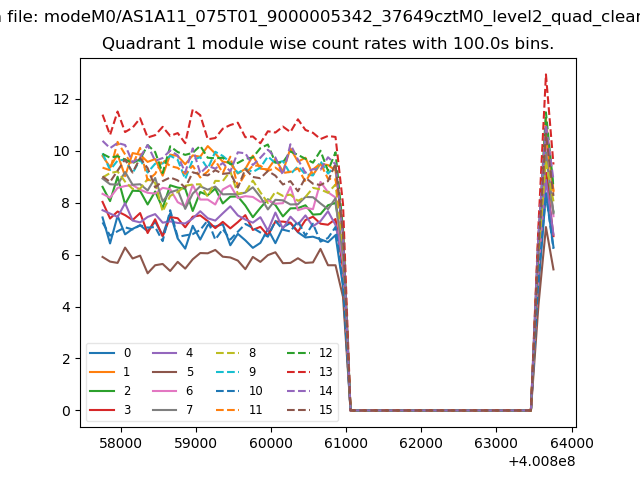
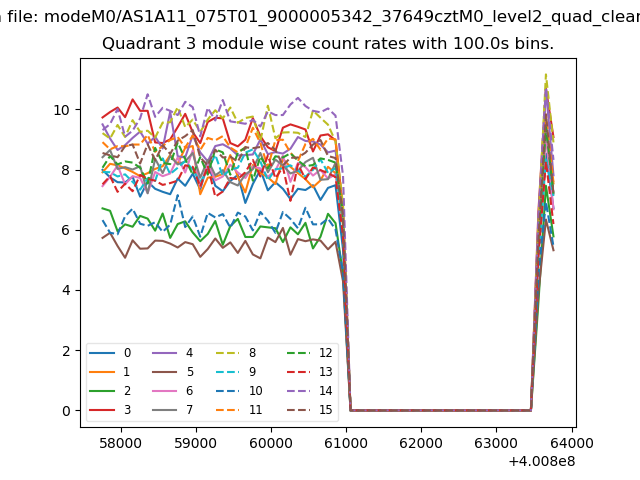
| Module-wise count rates for Quadrant A Data is divided into 100 sec bins |
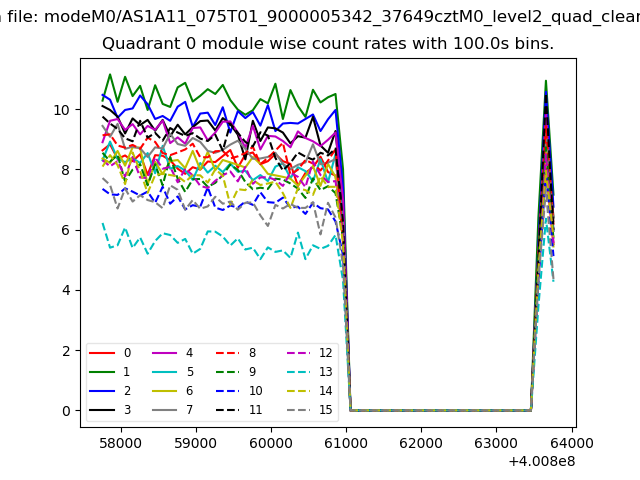 |
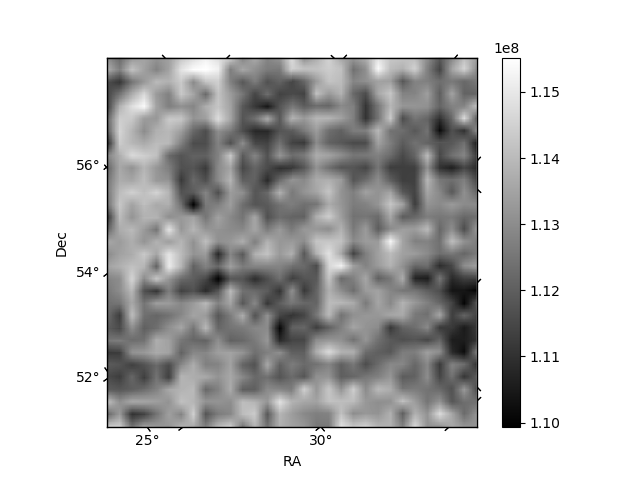 |
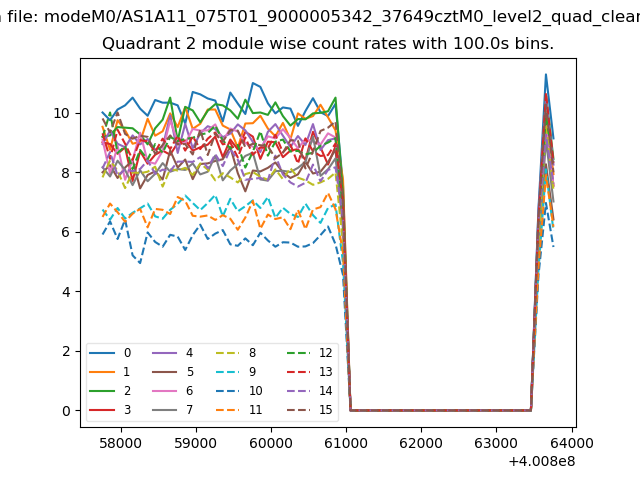
| Module-wise count rates for Quadrant B Data is divided into 100 sec bins |
 |
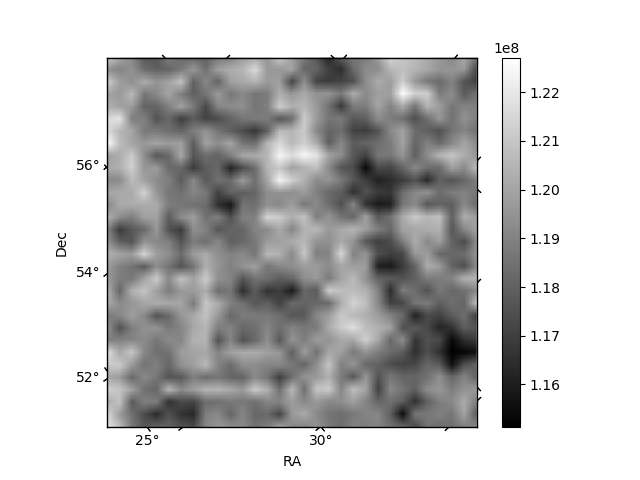 |
| Module-wise count rates for Quadrant C Data is divided into 100 sec bins |
 |
 |
| Module-wise count rates for Quadrant D Data is divided into 100 sec bins |
 |
 |
| Parameter | Plot |
|---|---|
| CZT HV Monitor | 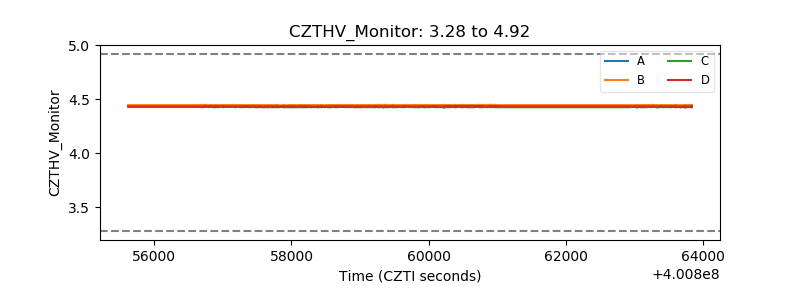 |
| D_VDD | 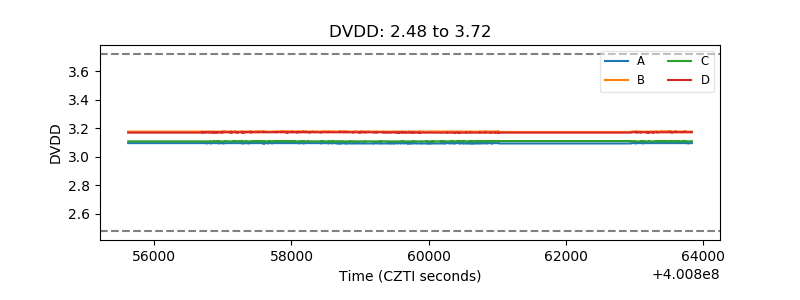 |
| Temperature 1 | 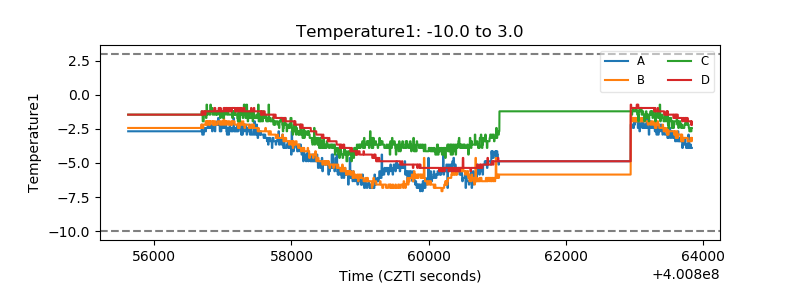 |
| Veto HV Monitor |  |
| Veto LLD | 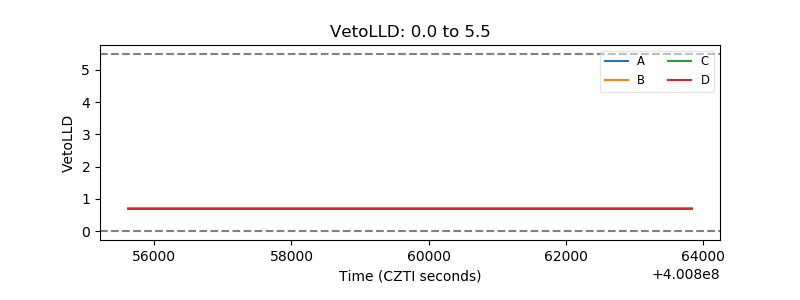 |
| Alpha Counter | 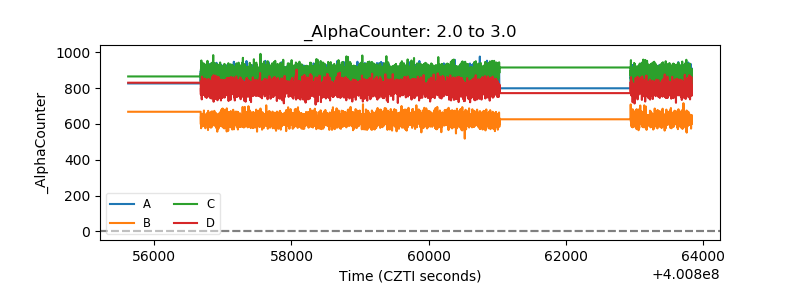 |
| _CPM_Rate | 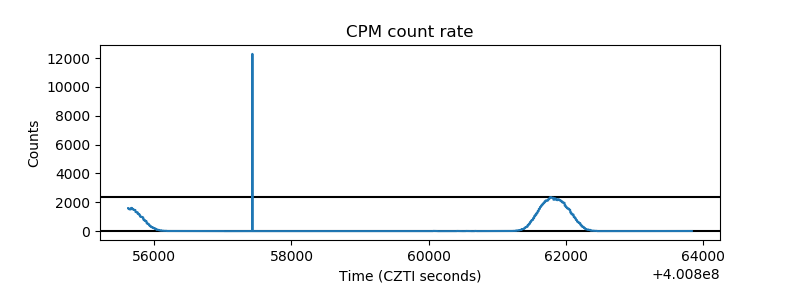 |
| CZT Counter | 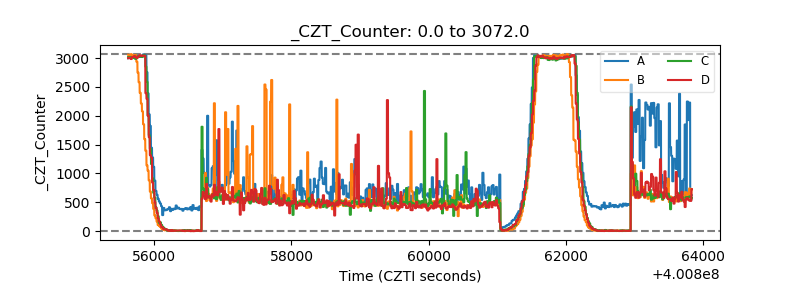 |
| +2.5 Volts monitor | 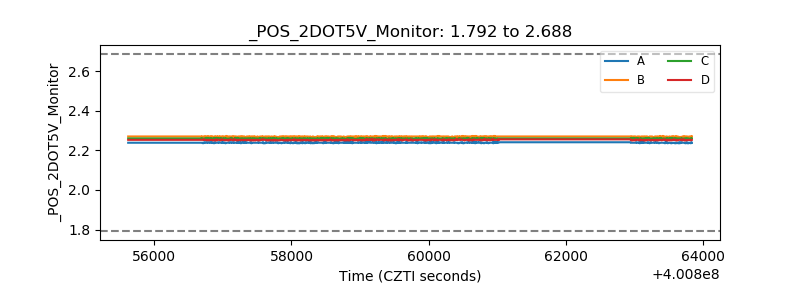 |
| +5 Volts monitor | 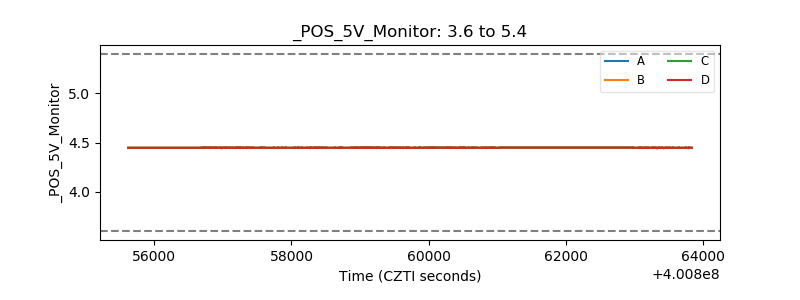 |
| _ROLL_ROT | 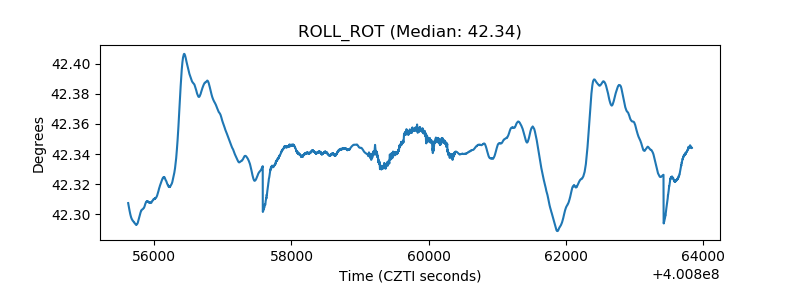 |
| _Roll_DEC | 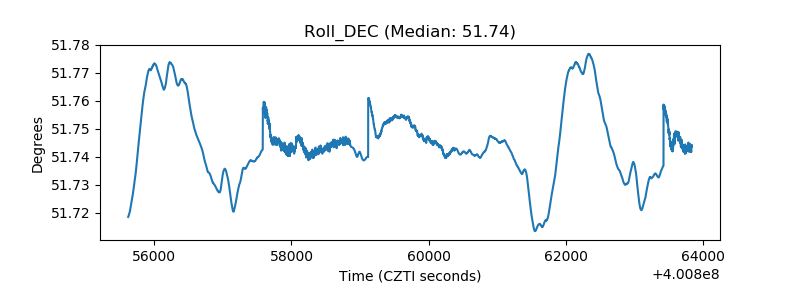 |
| _Roll_RA | 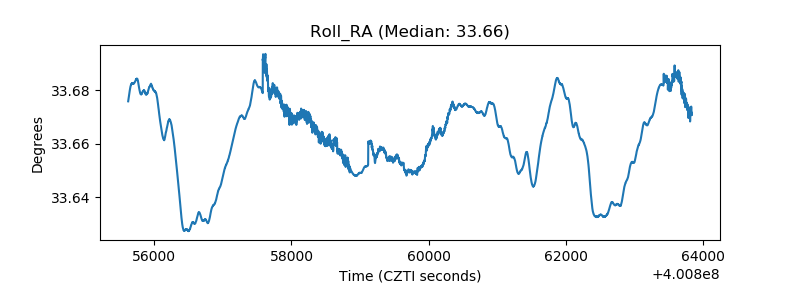 |
| Veto Counter | 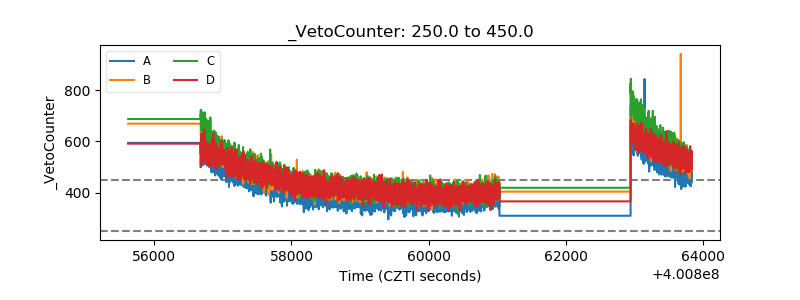 |