| Param | Original file | Final file |
|---|---|---|
| Filename | modeM0/AS1A11_075T01_9000005342_37650cztM0_level2.evt | modeM0/AS1A11_075T01_9000005342_37650cztM0_level2_quad_clean.evt |
| Size (bytes) | 524,393,280 | 87,984,000 |
| Size | 500.1 MB | 83.9 MB |
| Events in quadrant A | 6,380,188 | 531,037 |
| Events in quadrant B | 3,035,438 | 603,247 |
| Events in quadrant C | 2,846,707 | 608,526 |
| Events in quadrant D | 3,277,212 | 568,095 |
| Mode SS | |||
|---|---|---|---|
| Quadrant | BADHDUFLAG | Total packets | Discarded packets |
| A | 0 | 104 | 0 |
| B | 0 | 104 | 0 |
| C | 0 | 104 | 0 |
| D | 0 | 104 | 0 |
| Mode M0 | |||
|---|---|---|---|
| Quadrant | BADHDUFLAG | Total packets | Discarded packets |
| A | 0 | 22484 | 3 |
| B | 0 | 12256 | 2 |
| C | 0 | 11469 | 2 |
| D | 0 | 13144 | 2 |
| Mode M9 | |||
|---|---|---|---|
| Quadrant | BADHDUFLAG | Total packets | Discarded packets |
| A | 0 | 39 | 0 |
| B | 0 | 39 | 0 |
| C | 0 | 39 | 0 |
| D | 0 | 39 | 0 |
| Quadrant | Total seconds | Saturated seconds | Saturation percentage |
|---|---|---|---|
| A | 5041 | 1452 | 28.803809% |
| B | 5041 | 132 | 2.618528% |
| C | 5041 | 40 | 0.793493% |
| D | 5041 | 136 | 2.697877% |
Noise dominated data is calculated using 1-second bins in cleaned event files. If a bin has >2000 counts, and if more than 50% of those come from <1% of pixels, then it is considered to be noise-dominated and hence unusable.
| Quadrant | # 1 sec bins | Bins with >0 counts | Bins with >2000 counts | High rate bins dominated by noise | Noise dominated (total time) | Noise dominated (detector-on time) | Marked lightcurve |
|---|---|---|---|---|---|---|---|
| A | 8986 | 5043 | 1137 | 1137 | 12.65% | 22.55% | 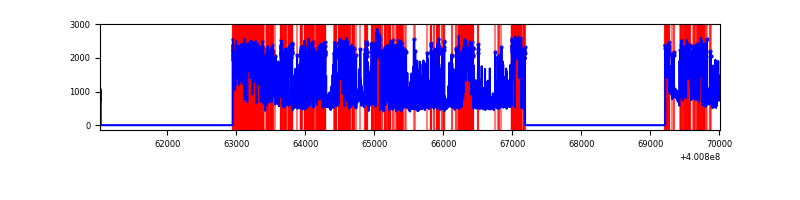 |
| B | 8986 | 5041 | 92 | 92 | 1.02% | 1.83% | 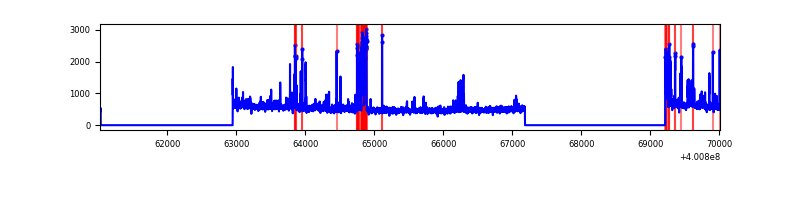 |
| C | 8986 | 5041 | 30 | 30 | 0.33% | 0.60% | 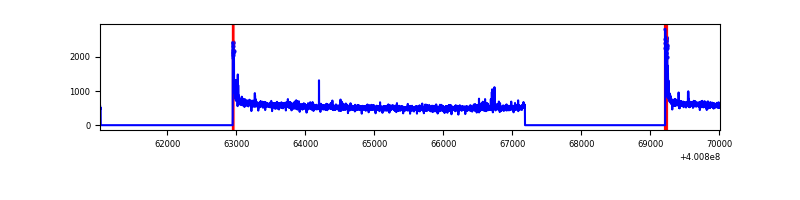 |
| D | 8986 | 5041 | 130 | 130 | 1.45% | 2.58% | 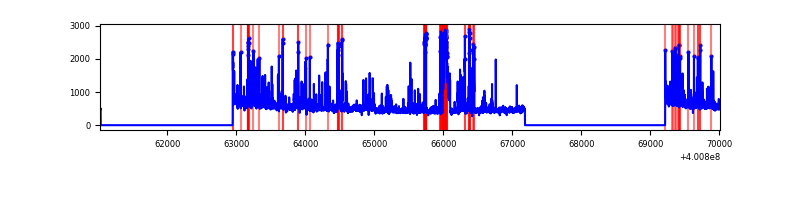 |
Top three noisy pixels from each quadrant. If the there are fewer than three noisy pixels in the level2.evt file, extra rows are filled as -1
| Pixel properties | Quadrant properties | ||||||
|---|---|---|---|---|---|---|---|
| Quadrant | DetID | PixID | Counts | Sigma | Mean | Median | Sigma |
| A | 15 | 222 | 3812965 | 33901.86 | 567 | 558 | 112.5 |
| A | 10 | 83 | 271930 | 2413.18 | 567 | 558 | 112.5 |
| A | 9 | 143 | 25263 | 219.69 | 567 | 558 | 112.5 |
| B | 5 | 172 | 246732 | 2068.88 | 636 | 621 | 119.0 |
| B | 4 | 232 | 64712 | 538.77 | 636 | 621 | 119.0 |
| B | 15 | 85 | 39935 | 330.48 | 636 | 621 | 119.0 |
| C | 15 | 214 | 233120 | 1608.49 | 634 | 639 | 144.5 |
| C | 0 | 10 | 112183 | 771.75 | 634 | 639 | 144.5 |
| C | 14 | 254 | 21607 | 145.07 | 634 | 639 | 144.5 |
| D | 2 | 250 | 195793 | 1303.88 | 625 | 610 | 149.7 |
| D | 2 | 249 | 189701 | 1263.18 | 625 | 610 | 149.7 |
| D | 7 | 38 | 175910 | 1171.05 | 625 | 610 | 149.7 |
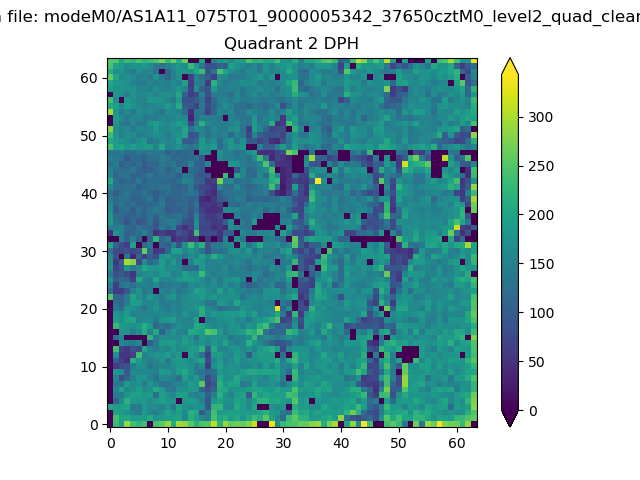
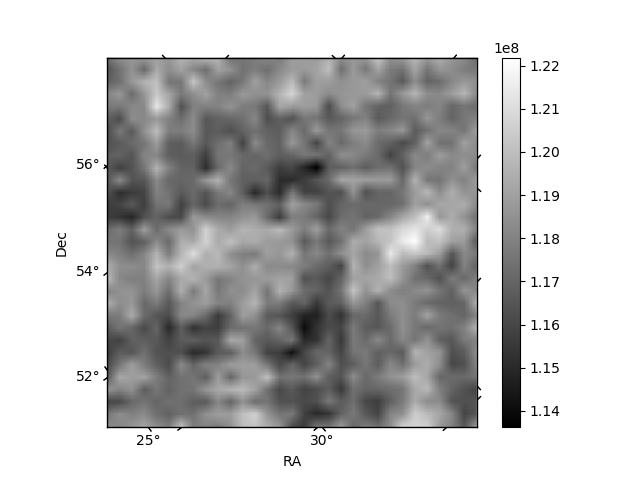
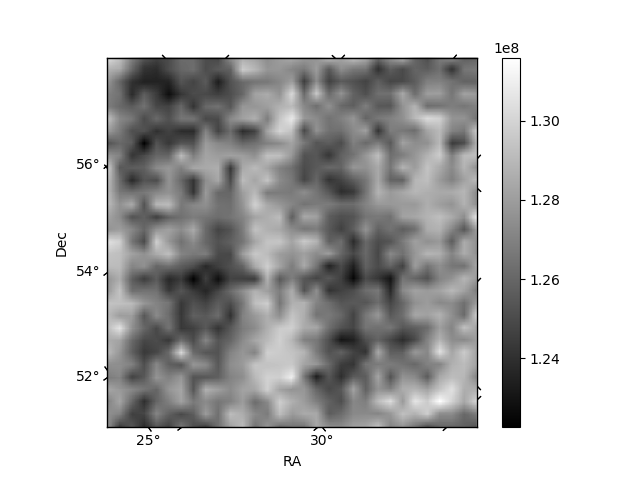
Histogram calculated using DETX and DETY for each event in the final _common_clean file
| Quadrant A | 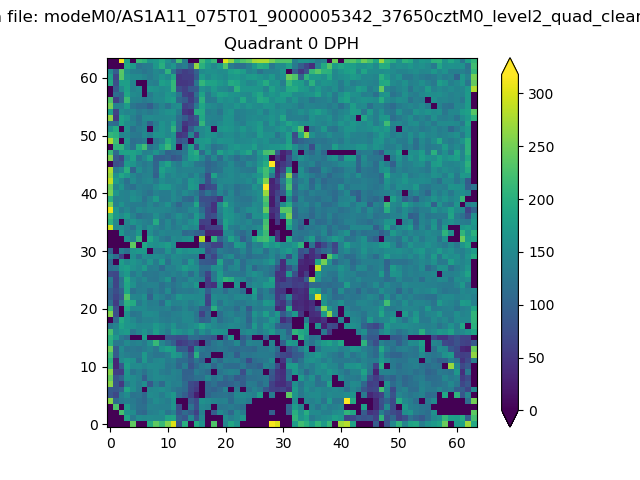 |
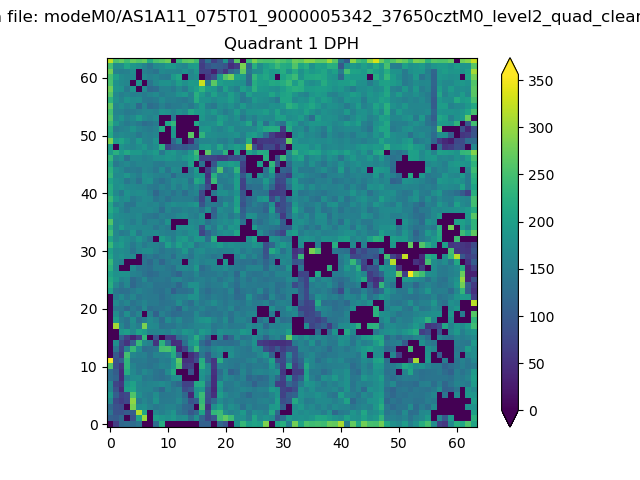 |
Quadrant B |
|---|---|---|---|
| Quadrant D | 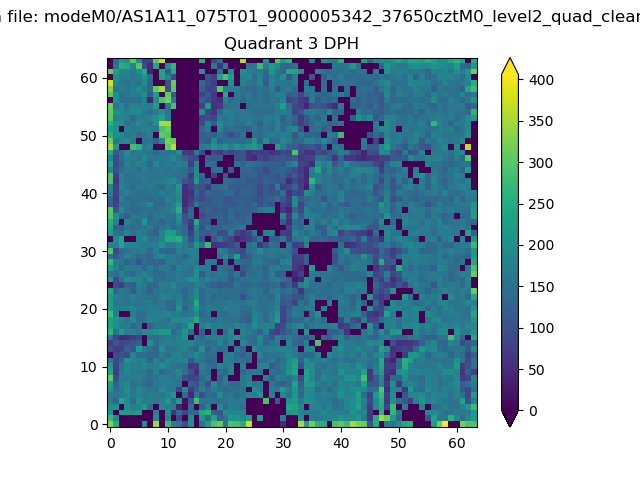 |
 |
Quadrant C |
| Plot type | Count rate plots | Images |
|---|---|---|
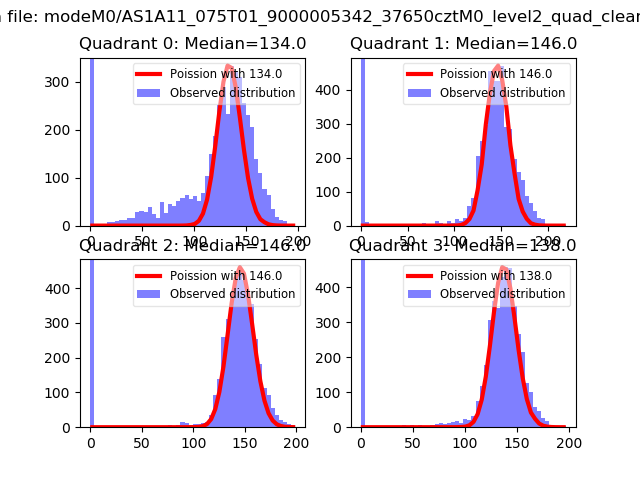
| Comparison with Poisson distribution Blue bars denote a histogram of data divided into 1 sec bins. Red curve is a Poisson curve with rate = median count rate of data. |
 |
 |
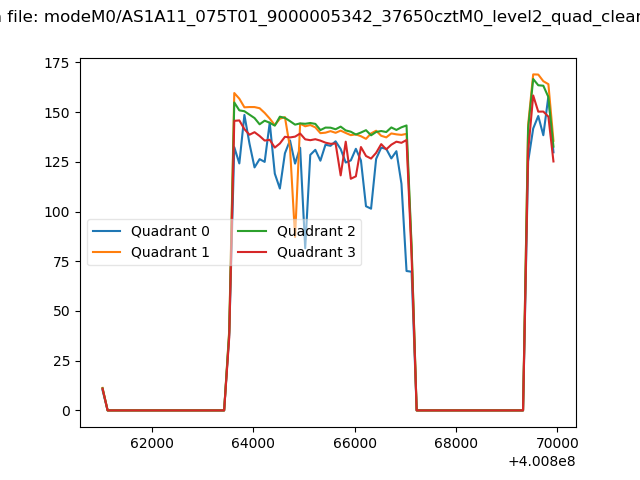
| Quadrant-wise count rates Data is divided into 100 sec bins |
 |
|
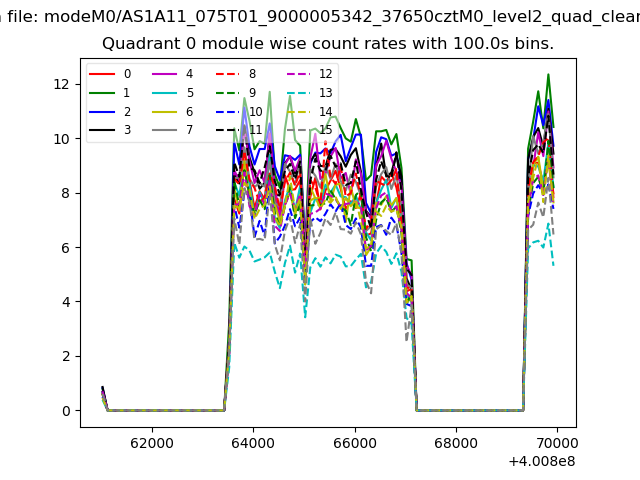
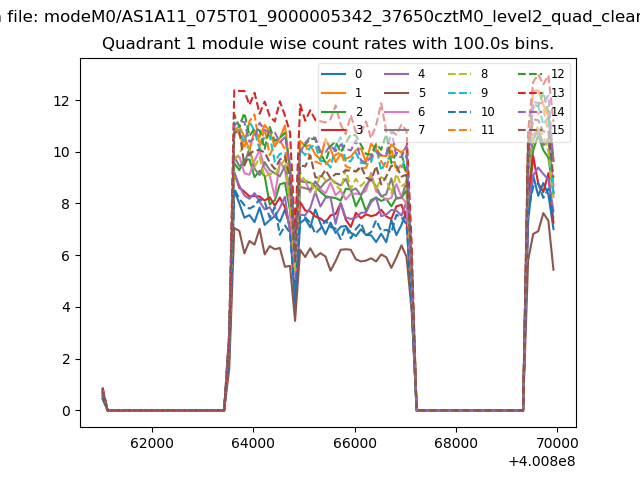
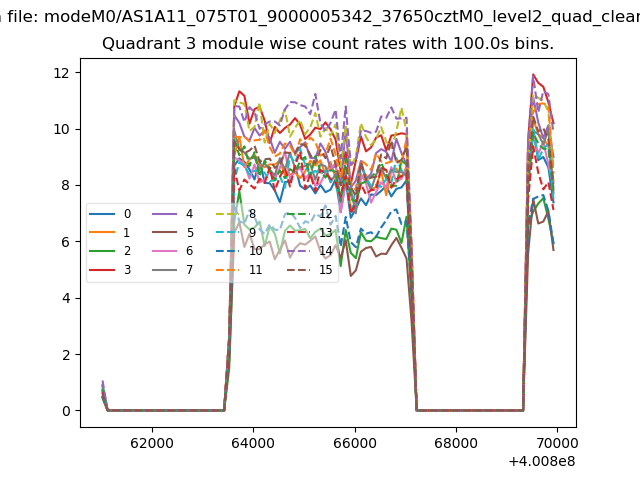
| Module-wise count rates for Quadrant A Data is divided into 100 sec bins |
 |
 |
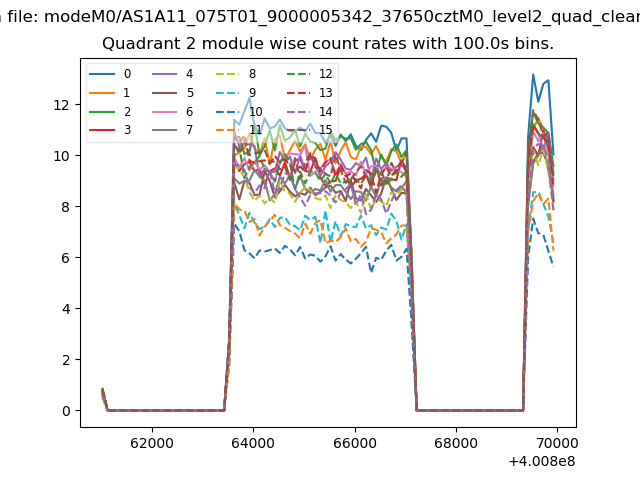
| Module-wise count rates for Quadrant B Data is divided into 100 sec bins |
 |
 |
| Module-wise count rates for Quadrant C Data is divided into 100 sec bins |
 |
 |
| Module-wise count rates for Quadrant D Data is divided into 100 sec bins |
 |
 |
| Parameter | Plot |
|---|---|
| CZT HV Monitor | 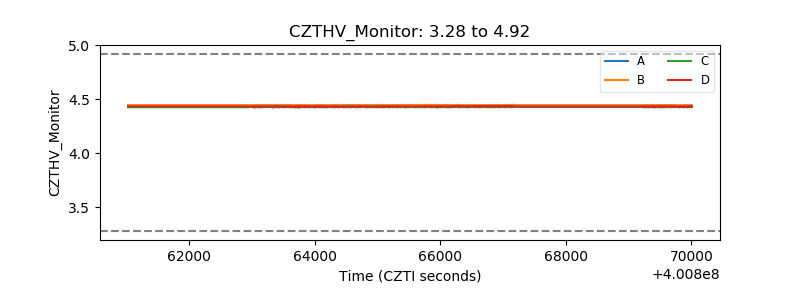 |
| D_VDD | 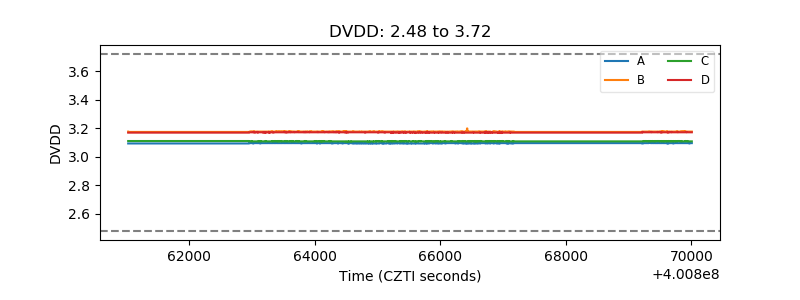 |
| Temperature 1 | 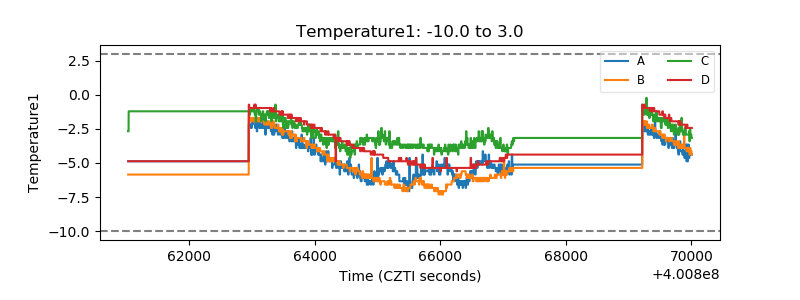 |
| Veto HV Monitor | 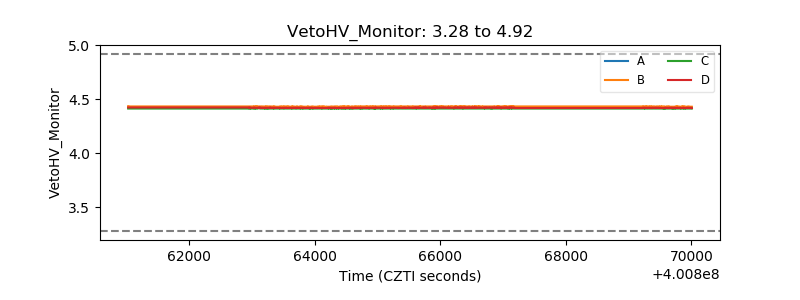 |
| Veto LLD | 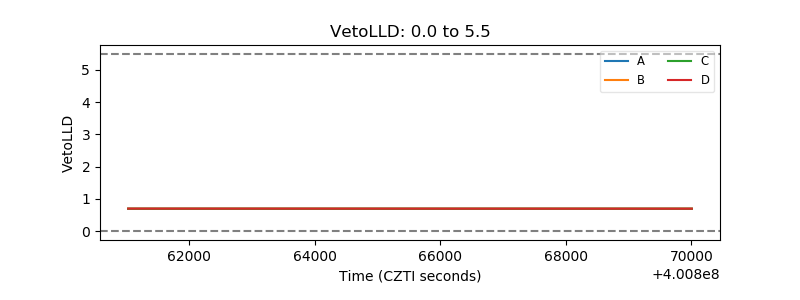 |
| Alpha Counter | 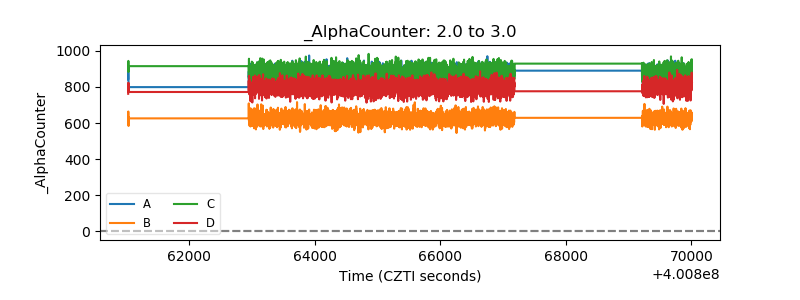 |
| _CPM_Rate | 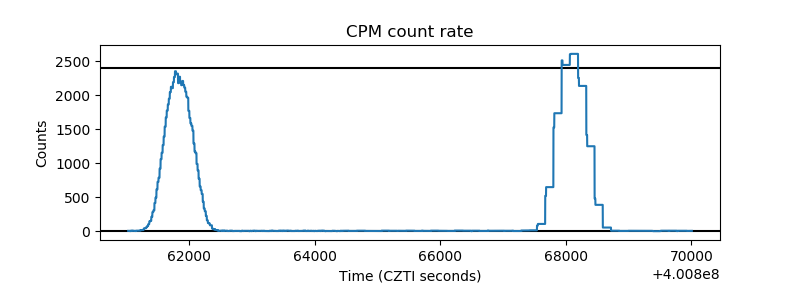 |
| CZT Counter | 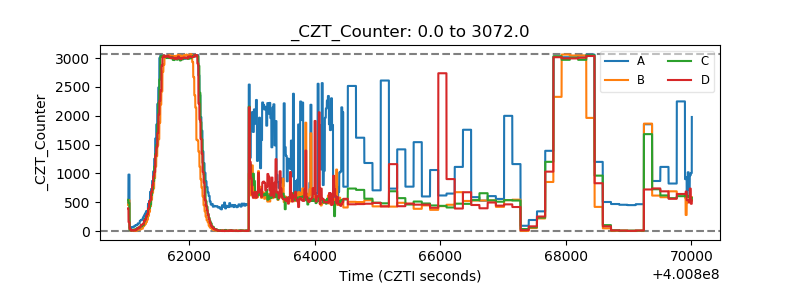 |
| +2.5 Volts monitor |  |
| +5 Volts monitor | 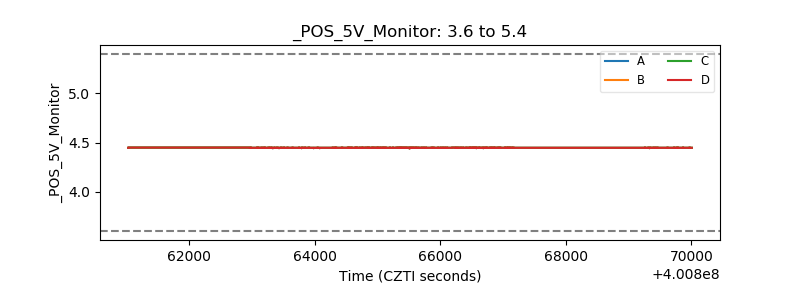 |
| _ROLL_ROT | 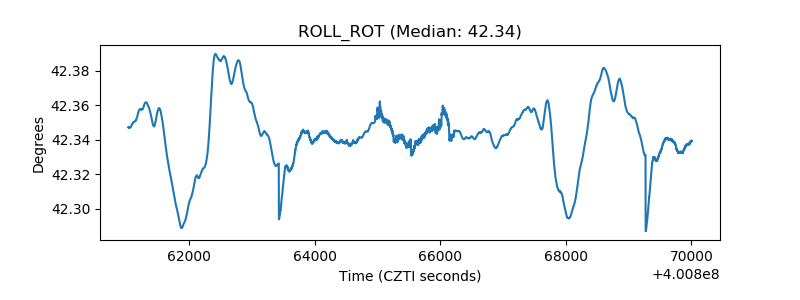 |
| _Roll_DEC | 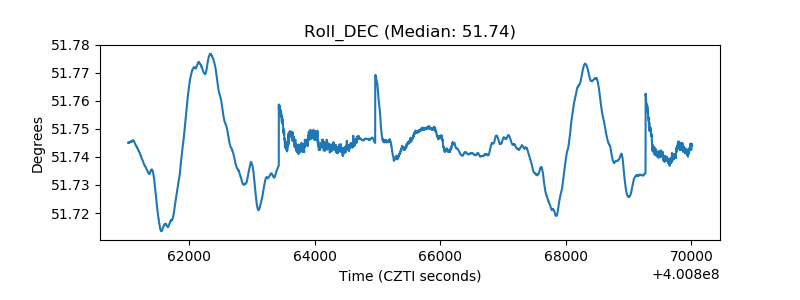 |
| _Roll_RA | 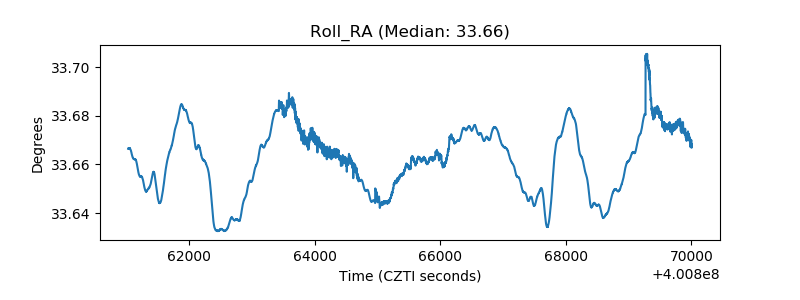 |
| Veto Counter | 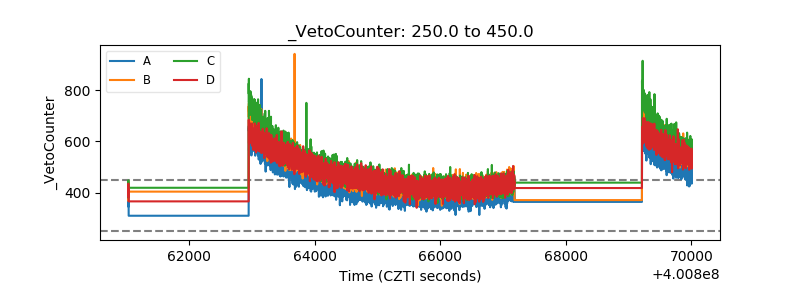 |