| Param | Original file | Final file |
|---|---|---|
| Filename | modeM0/AS1A11_075T01_9000005342_37652cztM0_level2.evt | modeM0/AS1A11_075T01_9000005342_37652cztM0_level2_quad_clean.evt |
| Size (bytes) | 405,504,000 | 92,361,600 |
| Size | 386.7 MB | 88.1 MB |
| Events in quadrant A | 3,179,995 | 607,890 |
| Events in quadrant B | 2,739,166 | 632,419 |
| Events in quadrant C | 2,779,724 | 638,276 |
| Events in quadrant D | 3,251,380 | 577,386 |
| Mode SS | |||
|---|---|---|---|
| Quadrant | BADHDUFLAG | Total packets | Discarded packets |
| A | 0 | 98 | 0 |
| B | 0 | 98 | 0 |
| C | 0 | 98 | 0 |
| D | 0 | 98 | 0 |
| Mode M0 | |||
|---|---|---|---|
| Quadrant | BADHDUFLAG | Total packets | Discarded packets |
| A | 0 | 12639 | 3 |
| B | 0 | 11156 | 2 |
| C | 0 | 11114 | 2 |
| D | 0 | 12946 | 2 |
| Mode M9 | |||
|---|---|---|---|
| Quadrant | BADHDUFLAG | Total packets | Discarded packets |
| A | 0 | 27 | 0 |
| B | 0 | 27 | 0 |
| C | 0 | 27 | 0 |
| D | 0 | 28 | 0 |
| Quadrant | Total seconds | Saturated seconds | Saturation percentage |
|---|---|---|---|
| A | 4867 | 71 | 1.458804% |
| B | 4867 | 76 | 1.561537% |
| C | 4867 | 75 | 1.540990% |
| D | 4867 | 299 | 6.143415% |
Noise dominated data is calculated using 1-second bins in cleaned event files. If a bin has >2000 counts, and if more than 50% of those come from <1% of pixels, then it is considered to be noise-dominated and hence unusable.
| Quadrant | # 1 sec bins | Bins with >0 counts | Bins with >2000 counts | High rate bins dominated by noise | Noise dominated (total time) | Noise dominated (detector-on time) | Marked lightcurve |
|---|---|---|---|---|---|---|---|
| A | 6990 | 4868 | 52 | 52 | 0.74% | 1.07% | 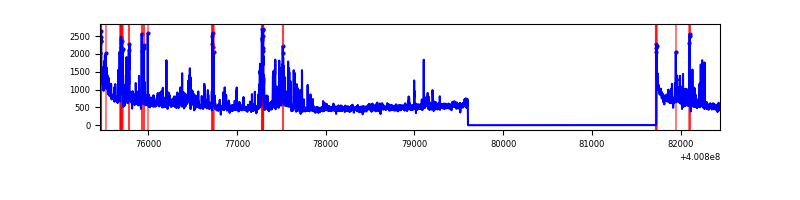 |
| B | 6989 | 4866 | 39 | 39 | 0.56% | 0.80% | 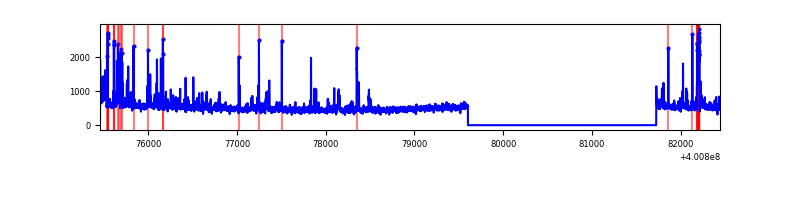 |
| C | 6989 | 4866 | 60 | 60 | 0.86% | 1.23% | 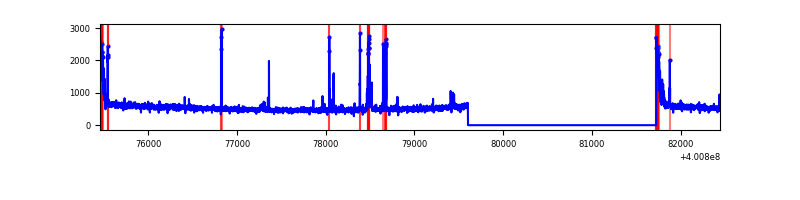 |
| D | 6989 | 4866 | 290 | 290 | 4.15% | 5.96% | 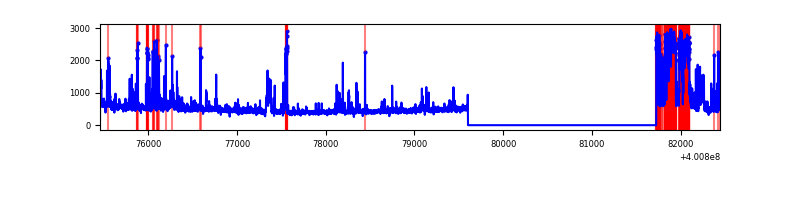 |
Top three noisy pixels from each quadrant. If the there are fewer than three noisy pixels in the level2.evt file, extra rows are filled as -1
| Pixel properties | Quadrant properties | ||||||
|---|---|---|---|---|---|---|---|
| Quadrant | DetID | PixID | Counts | Sigma | Mean | Median | Sigma |
| A | 15 | 222 | 447364 | 3851.29 | 577 | 567 | 116.0 |
| A | 10 | 83 | 295777 | 2544.65 | 577 | 567 | 116.0 |
| A | 9 | 143 | 191577 | 1646.46 | 577 | 567 | 116.0 |
| B | 5 | 172 | 104409 | 949.36 | 583 | 569 | 109.4 |
| B | 4 | 232 | 53950 | 488.04 | 583 | 569 | 109.4 |
| B | 0 | 230 | 52667 | 476.31 | 583 | 569 | 109.4 |
| C | 15 | 214 | 223746 | 1677.51 | 583 | 588 | 133.0 |
| C | 0 | 10 | 141762 | 1061.23 | 583 | 588 | 133.0 |
| C | 14 | 254 | 131311 | 982.66 | 583 | 588 | 133.0 |
| D | 12 | 227 | 482564 | 3572.54 | 559 | 546 | 134.9 |
| D | 2 | 249 | 280720 | 2076.54 | 559 | 546 | 134.9 |
| D | 2 | 250 | 100956 | 744.2 | 559 | 546 | 134.9 |
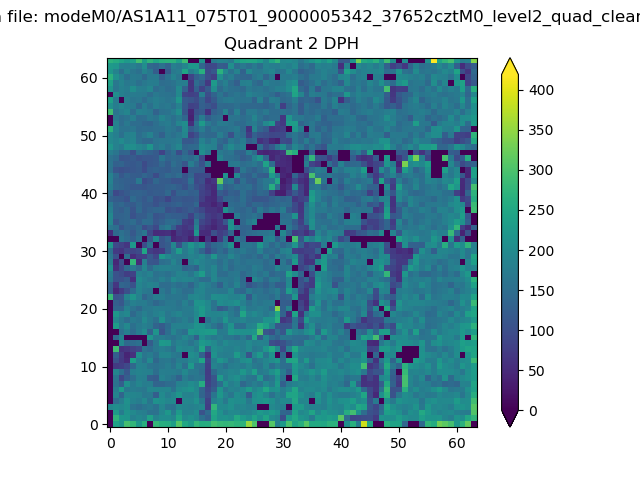
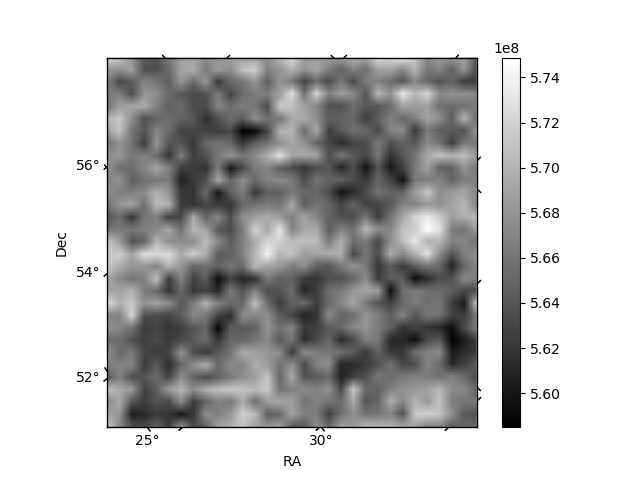
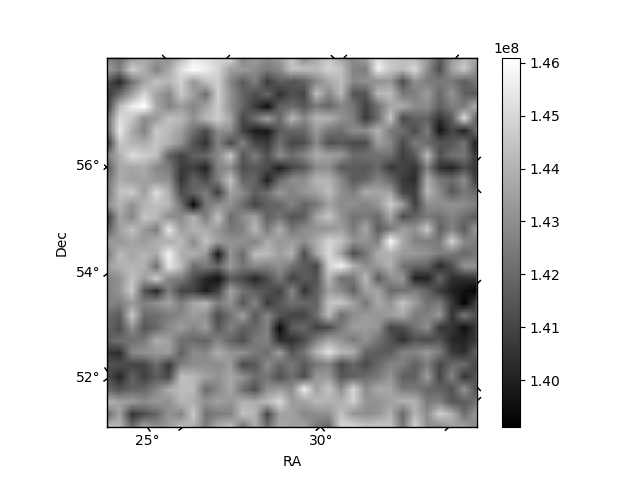
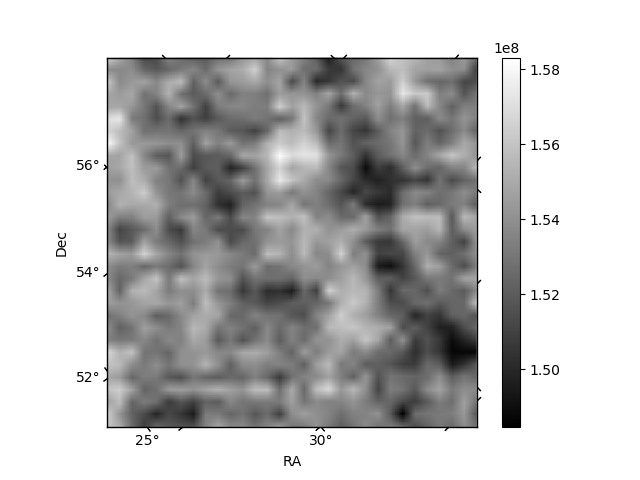
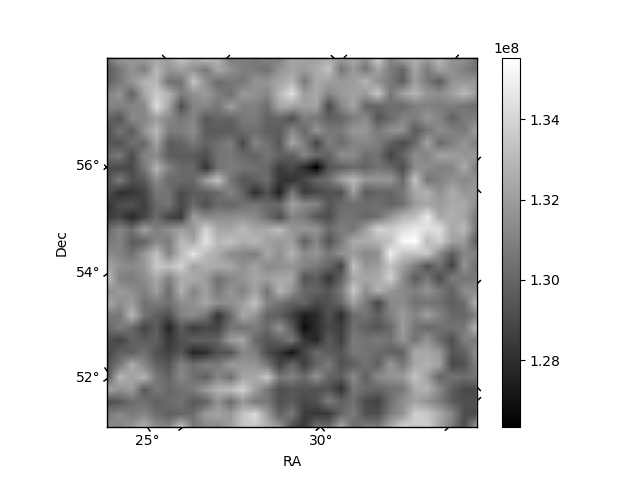
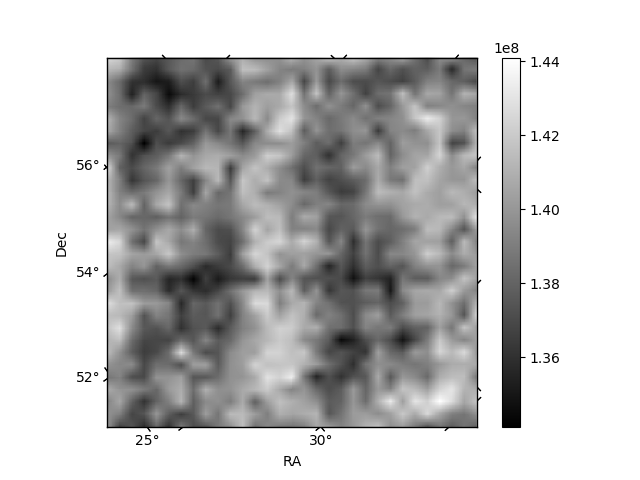
Histogram calculated using DETX and DETY for each event in the final _common_clean file
| Quadrant A | 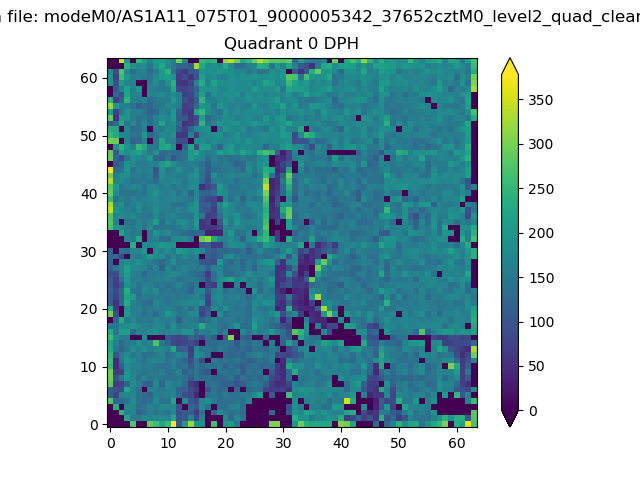 |
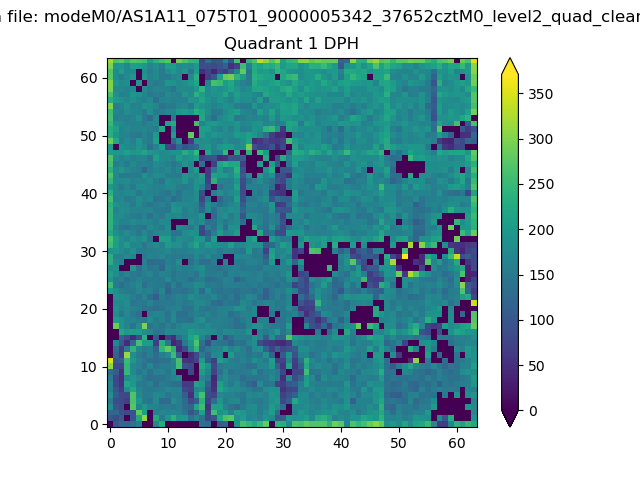 |
Quadrant B |
|---|---|---|---|
| Quadrant D | 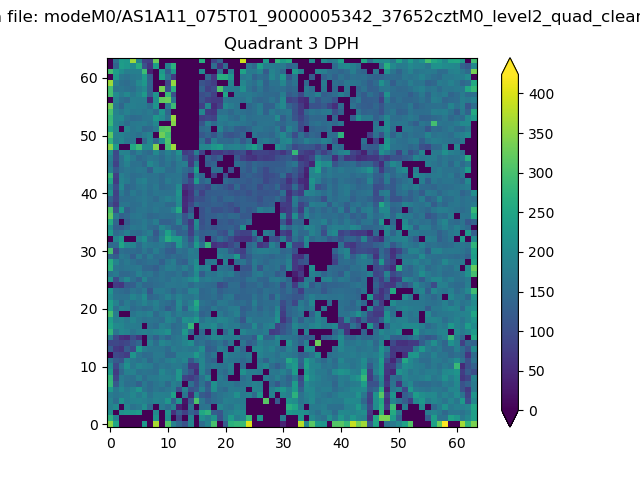 |
 |
Quadrant C |
| Plot type | Count rate plots | Images |
|---|---|---|
| Comparison with Poisson distribution Blue bars denote a histogram of data divided into 1 sec bins. Red curve is a Poisson curve with rate = median count rate of data. |
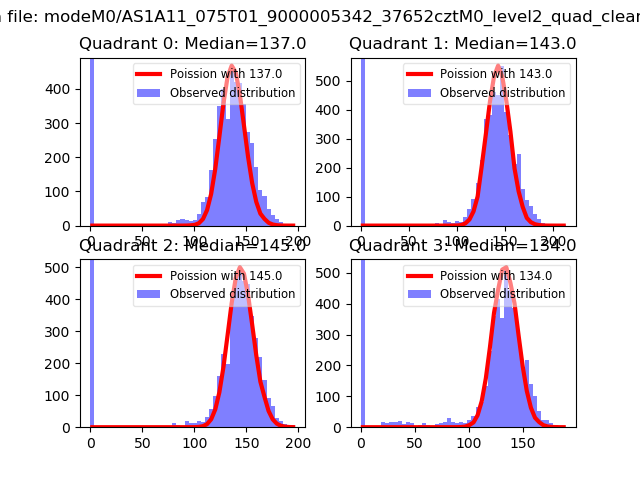 |
 |
| Quadrant-wise count rates Data is divided into 100 sec bins |
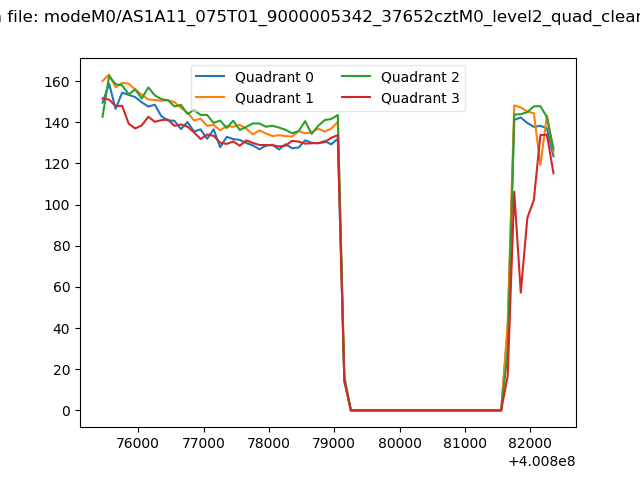 |
|
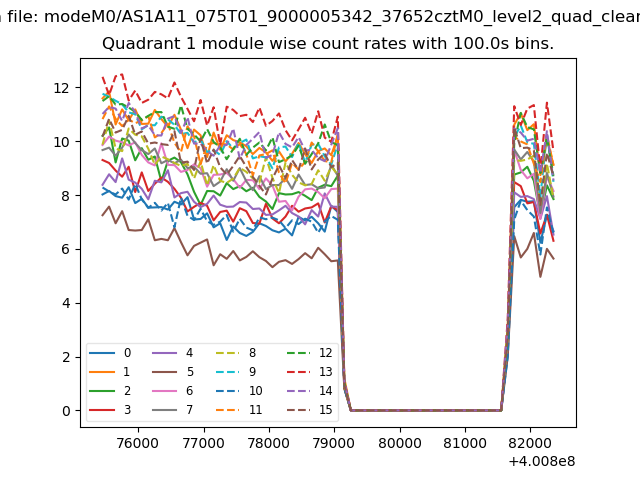
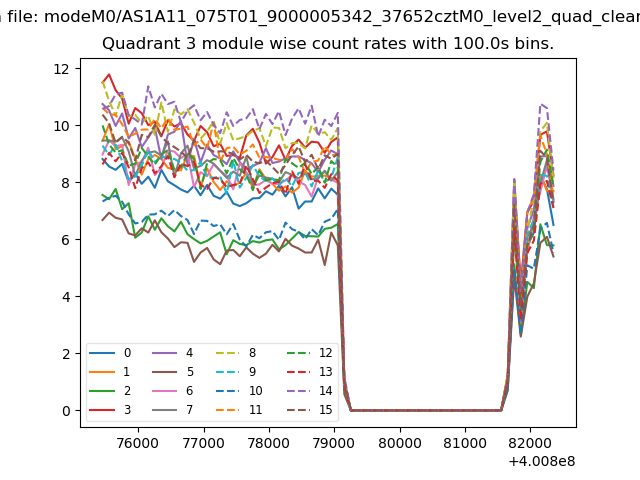
| Module-wise count rates for Quadrant A Data is divided into 100 sec bins |
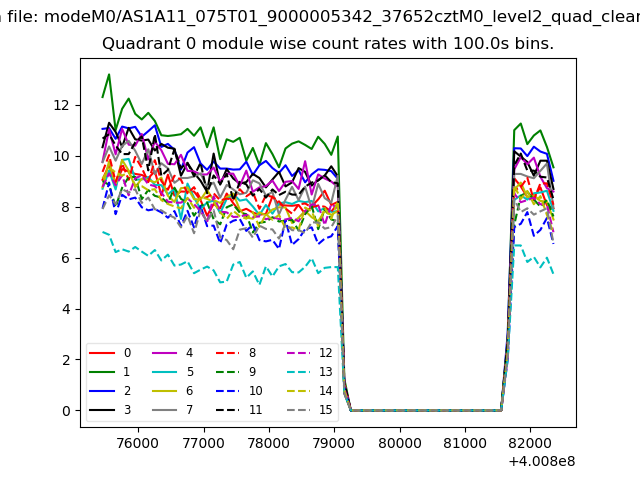 |
 |
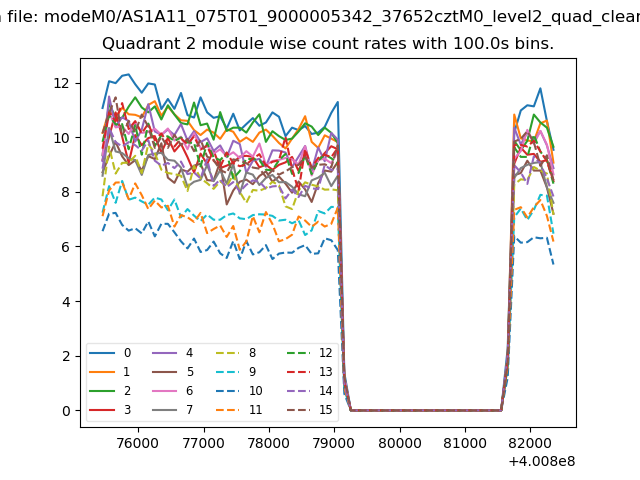
| Module-wise count rates for Quadrant B Data is divided into 100 sec bins |
 |
 |
| Module-wise count rates for Quadrant C Data is divided into 100 sec bins |
 |
 |
| Module-wise count rates for Quadrant D Data is divided into 100 sec bins |
 |
 |
| Parameter | Plot |
|---|---|
| CZT HV Monitor | 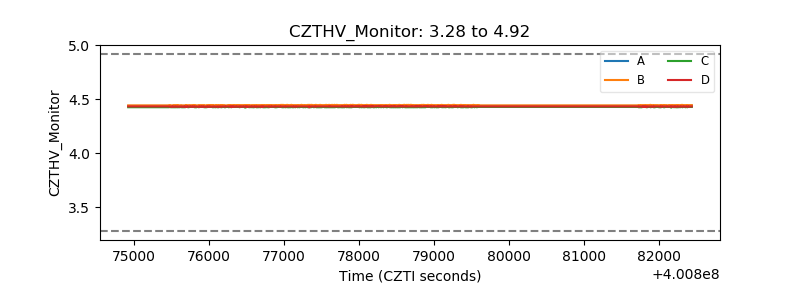 |
| D_VDD | 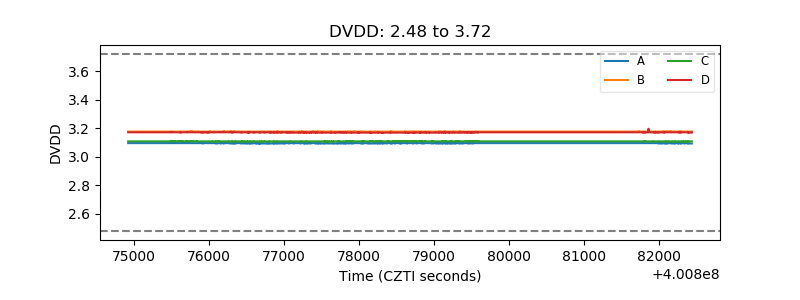 |
| Temperature 1 | 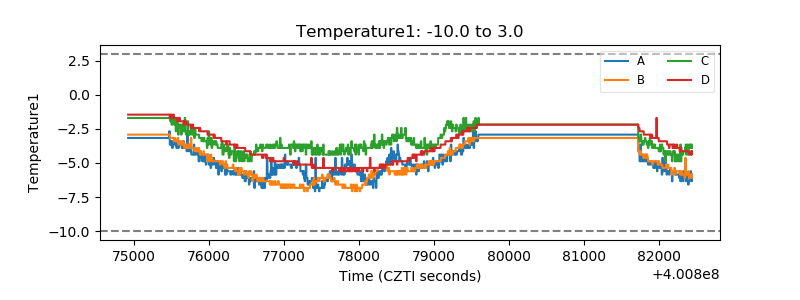 |
| Veto HV Monitor | 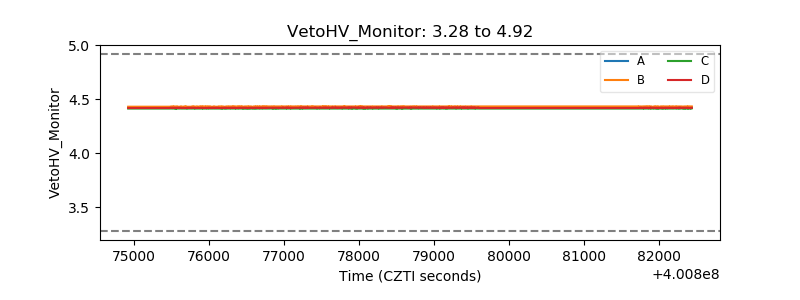 |
| Veto LLD | 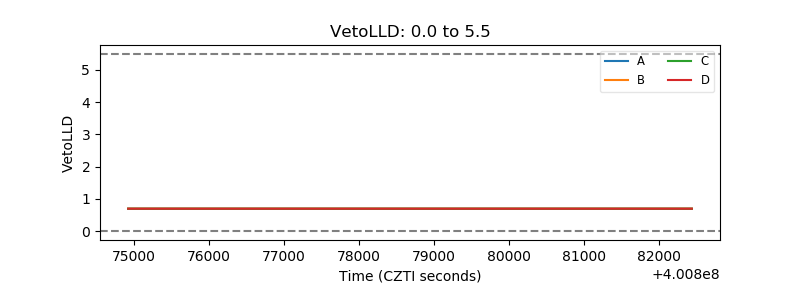 |
| Alpha Counter | 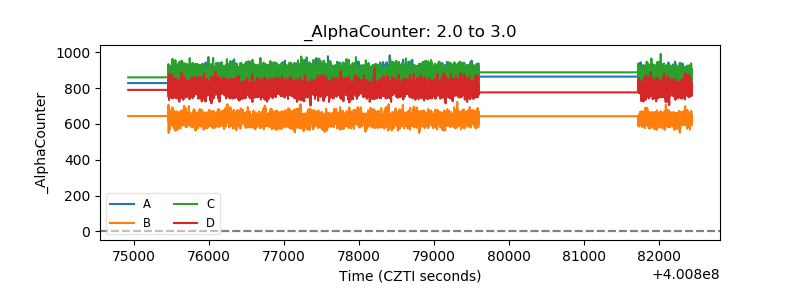 |
| _CPM_Rate | 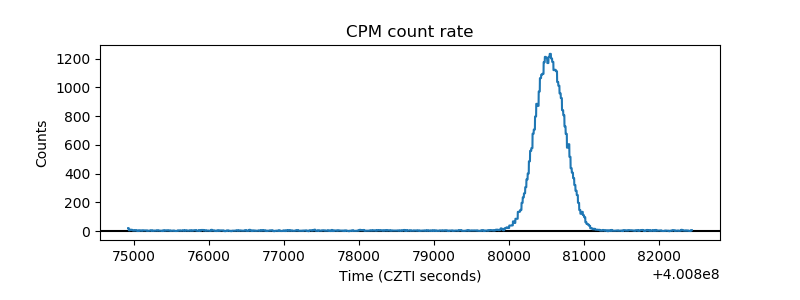 |
| CZT Counter | 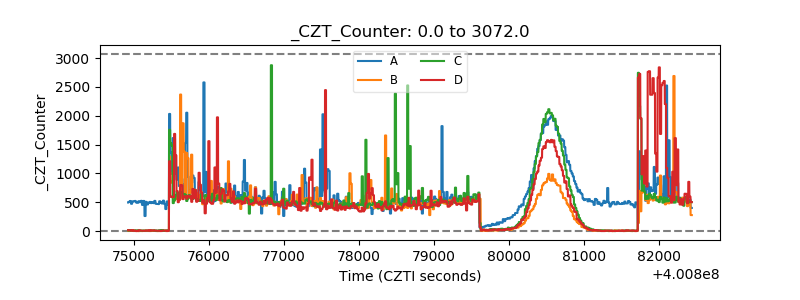 |
| +2.5 Volts monitor | 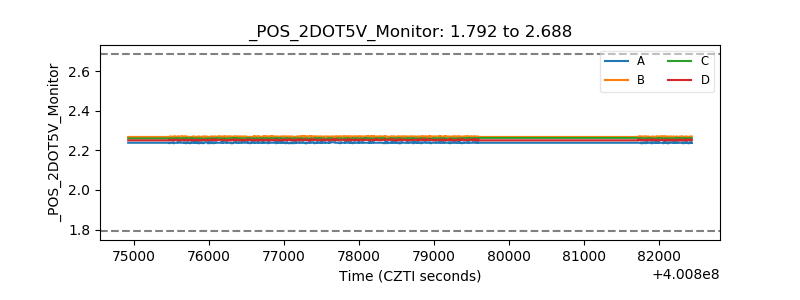 |
| +5 Volts monitor | 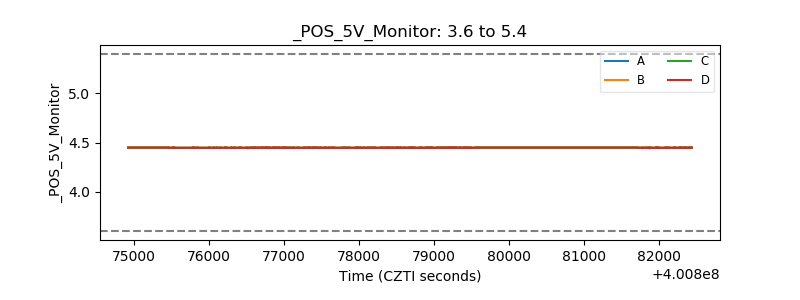 |
| _ROLL_ROT | 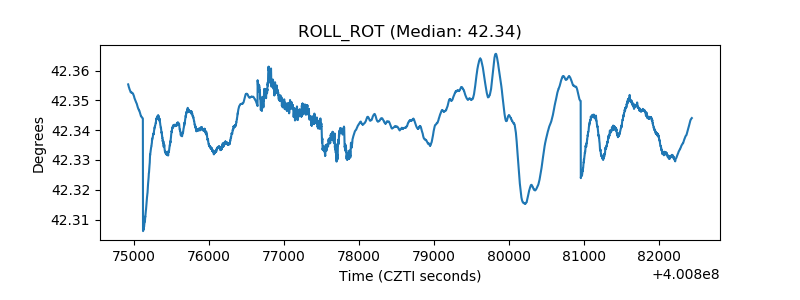 |
| _Roll_DEC | 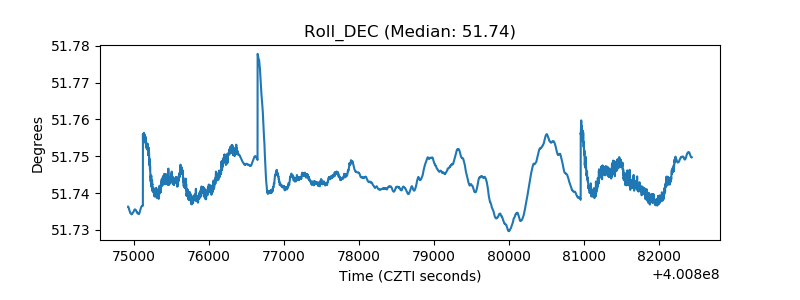 |
| _Roll_RA | 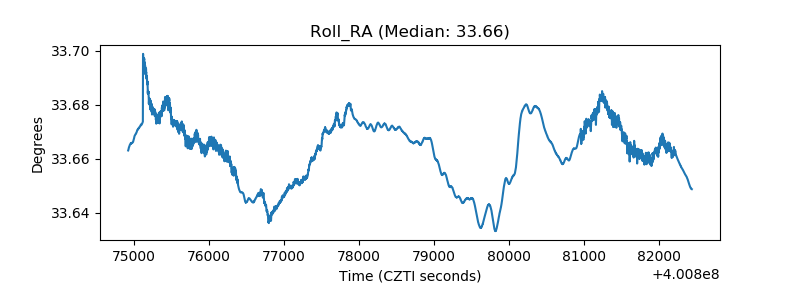 |
| Veto Counter | 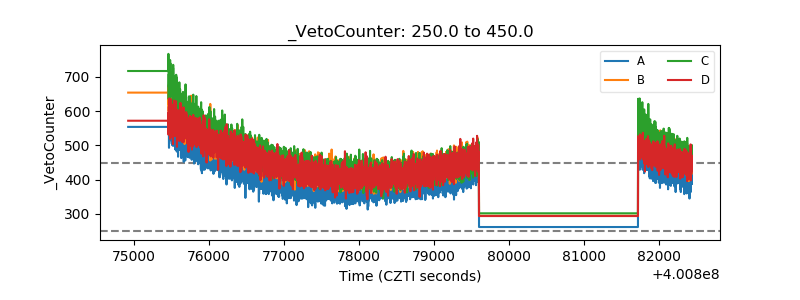 |