| Param | Original file | Final file |
|---|---|---|
| Filename | modeM0/AS1A11_075T01_9000005342_37653cztM0_level2.evt | modeM0/AS1A11_075T01_9000005342_37653cztM0_level2_quad_clean.evt |
| Size (bytes) | 381,827,520 | 81,152,640 |
| Size | 364.1 MB | 77.4 MB |
| Events in quadrant A | 2,721,799 | 522,566 |
| Events in quadrant B | 2,567,932 | 541,358 |
| Events in quadrant C | 2,702,787 | 546,946 |
| Events in quadrant D | 3,230,241 | 495,344 |
| Mode SS | |||
|---|---|---|---|
| Quadrant | BADHDUFLAG | Total packets | Discarded packets |
| A | 0 | 104 | 0 |
| B | 0 | 104 | 0 |
| C | 0 | 104 | 0 |
| D | 0 | 104 | 0 |
| Mode M0 | |||
|---|---|---|---|
| Quadrant | BADHDUFLAG | Total packets | Discarded packets |
| A | 0 | 11292 | 3 |
| B | 0 | 10850 | 2 |
| C | 0 | 10966 | 2 |
| D | 0 | 13176 | 2 |
| Mode M9 | |||
|---|---|---|---|
| Quadrant | BADHDUFLAG | Total packets | Discarded packets |
| A | 0 | 42 | 0 |
| B | 0 | 42 | 0 |
| C | 0 | 42 | 0 |
| D | 0 | 42 | 0 |
| Quadrant | Total seconds | Saturated seconds | Saturation percentage |
|---|---|---|---|
| A | 5009 | 27 | 0.539030% |
| B | 5009 | 47 | 0.938311% |
| C | 5009 | 53 | 1.058095% |
| D | 5009 | 286 | 5.709722% |
Noise dominated data is calculated using 1-second bins in cleaned event files. If a bin has >2000 counts, and if more than 50% of those come from <1% of pixels, then it is considered to be noise-dominated and hence unusable.
| Quadrant | # 1 sec bins | Bins with >0 counts | Bins with >2000 counts | High rate bins dominated by noise | Noise dominated (total time) | Noise dominated (detector-on time) | Marked lightcurve |
|---|---|---|---|---|---|---|---|
| A | 9194 | 5011 | 20 | 20 | 0.22% | 0.40% | 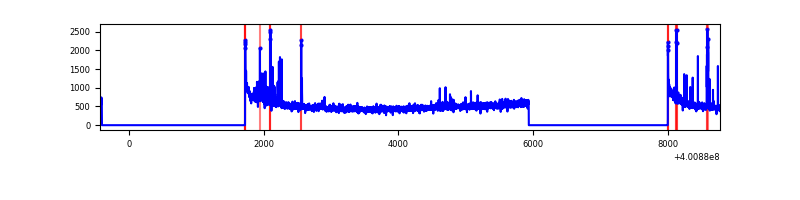 |
| B | 9194 | 5009 | 22 | 22 | 0.24% | 0.44% | 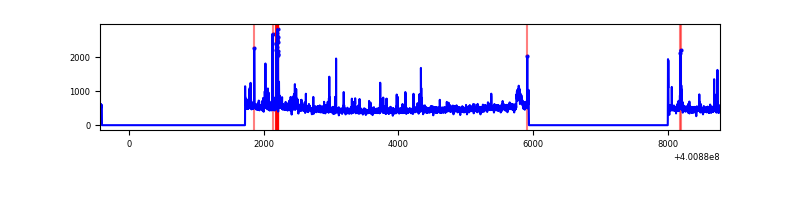 |
| C | 9194 | 5009 | 36 | 36 | 0.39% | 0.72% | 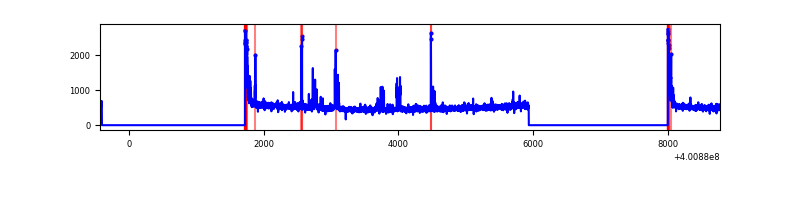 |
| D | 9194 | 5009 | 282 | 282 | 3.07% | 5.63% | 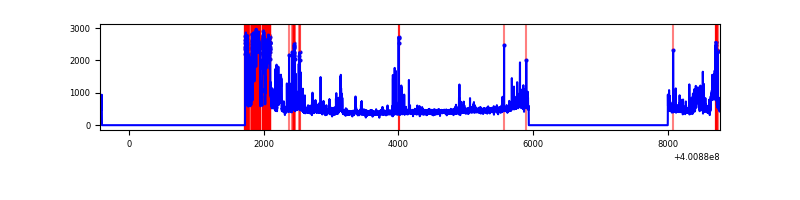 |
Top three noisy pixels from each quadrant. If the there are fewer than three noisy pixels in the level2.evt file, extra rows are filled as -1
| Pixel properties | Quadrant properties | ||||||
|---|---|---|---|---|---|---|---|
| Quadrant | DetID | PixID | Counts | Sigma | Mean | Median | Sigma |
| A | 10 | 83 | 293926 | 2565.25 | 570 | 560 | 114.4 |
| A | 9 | 143 | 134520 | 1171.37 | 570 | 560 | 114.4 |
| A | 15 | 222 | 57545 | 498.29 | 570 | 560 | 114.4 |
| B | 5 | 172 | 96380 | 873.88 | 575 | 560 | 109.6 |
| B | 5 | 200 | 58643 | 529.72 | 575 | 560 | 109.6 |
| B | 0 | 230 | 35588 | 319.45 | 575 | 560 | 109.6 |
| C | 15 | 214 | 226713 | 1716.8 | 572 | 576 | 131.7 |
| C | 0 | 10 | 139553 | 1055.1 | 572 | 576 | 131.7 |
| C | 15 | 159 | 81184 | 611.97 | 572 | 576 | 131.7 |
| D | 12 | 227 | 489376 | 3678.19 | 547 | 532 | 132.9 |
| D | 2 | 249 | 345286 | 2594.02 | 547 | 532 | 132.9 |
| D | 2 | 250 | 126760 | 949.77 | 547 | 532 | 132.9 |
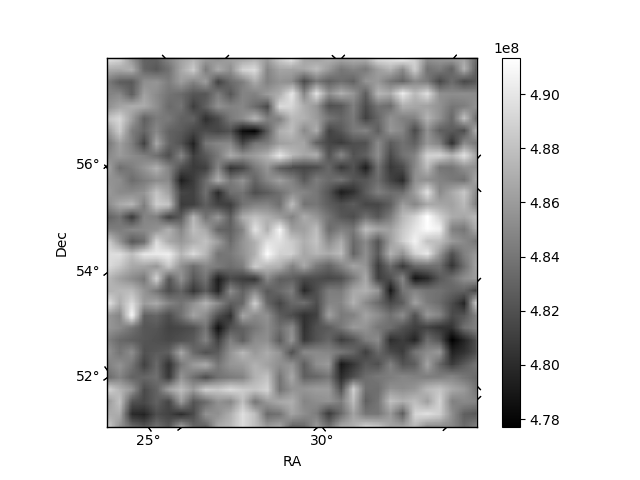
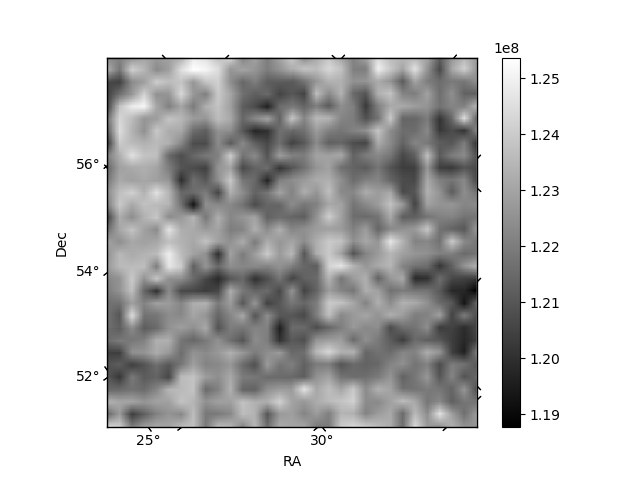
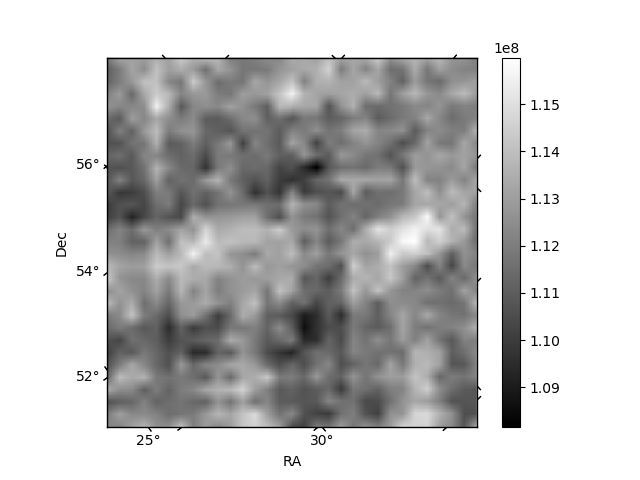
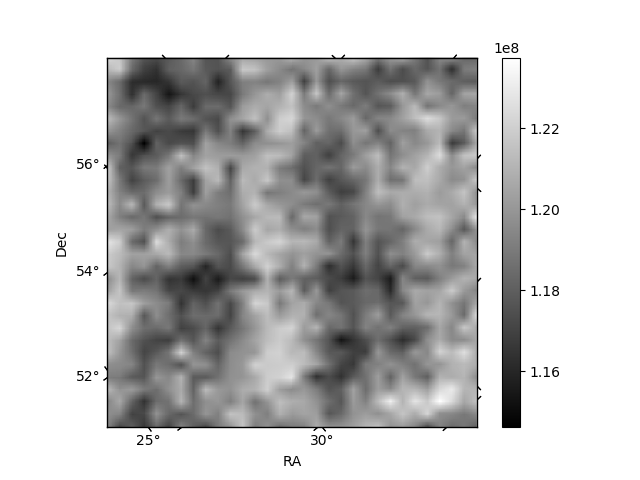
Histogram calculated using DETX and DETY for each event in the final _common_clean file
| Quadrant A | 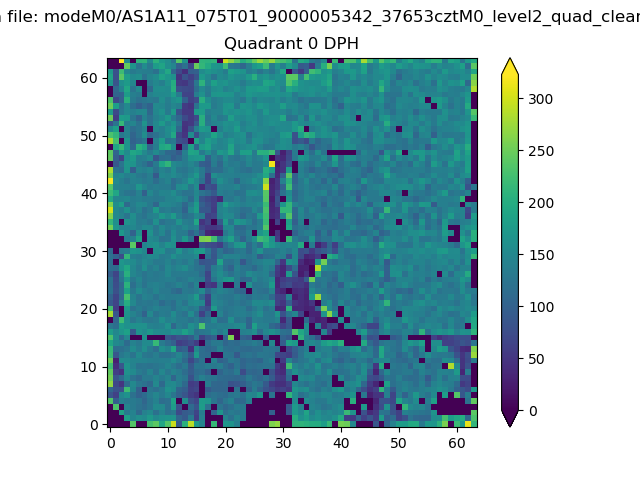 |
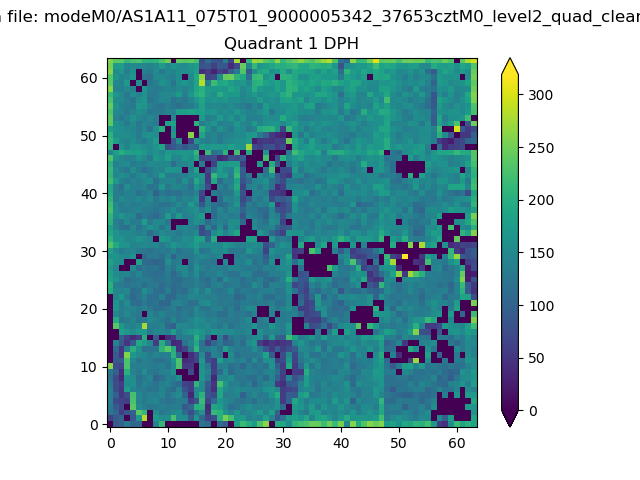 |
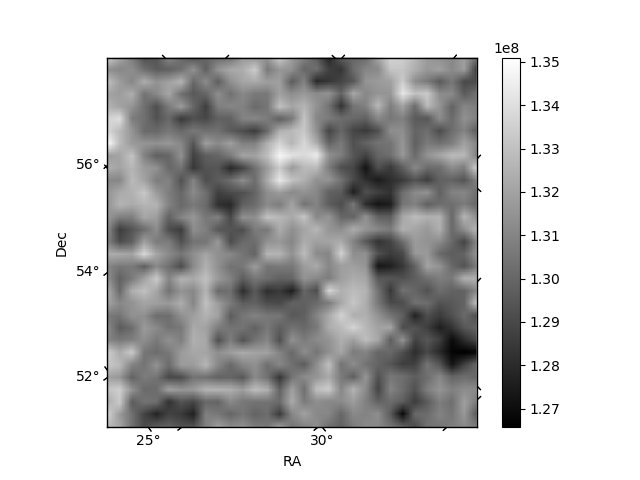
Quadrant B |
|---|---|---|---|
| Quadrant D | 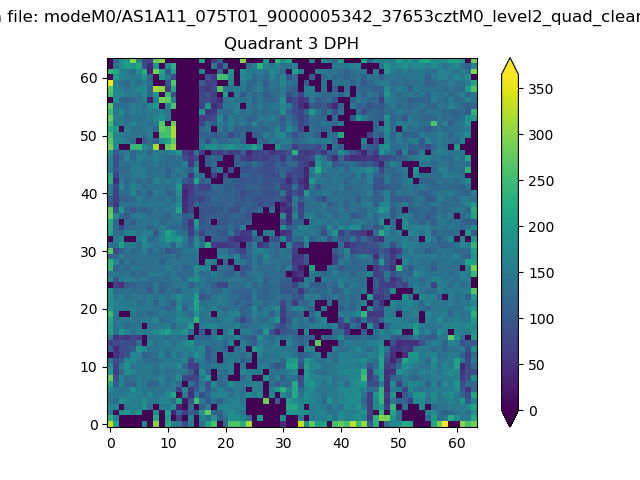 |
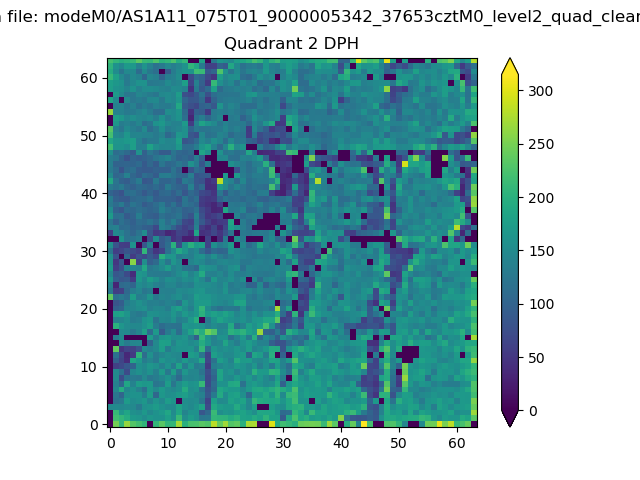 |
Quadrant C |
| Plot type | Count rate plots | Images |
|---|---|---|
| Comparison with Poisson distribution Blue bars denote a histogram of data divided into 1 sec bins. Red curve is a Poisson curve with rate = median count rate of data. |
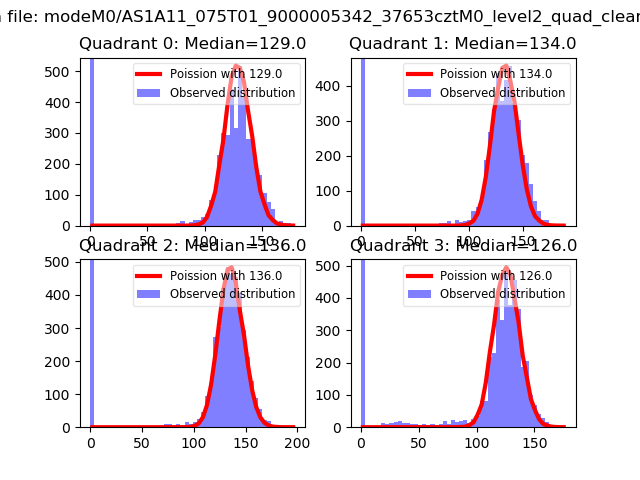 |
 |
| Quadrant-wise count rates Data is divided into 100 sec bins |
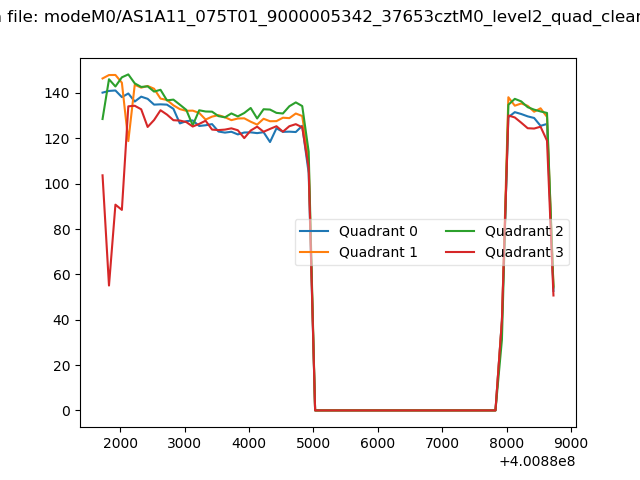 |
|
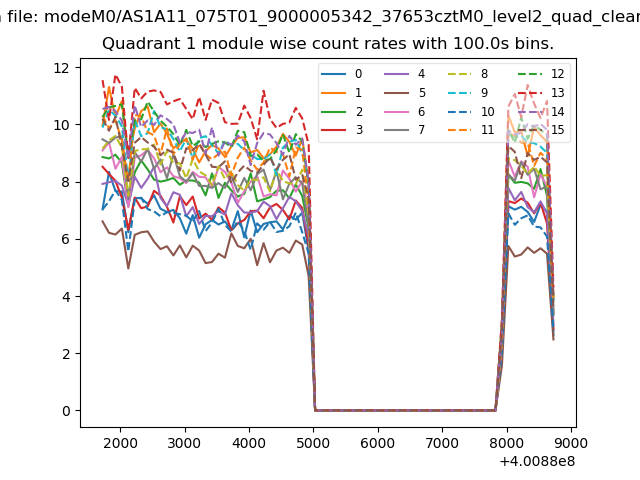
| Module-wise count rates for Quadrant A Data is divided into 100 sec bins |
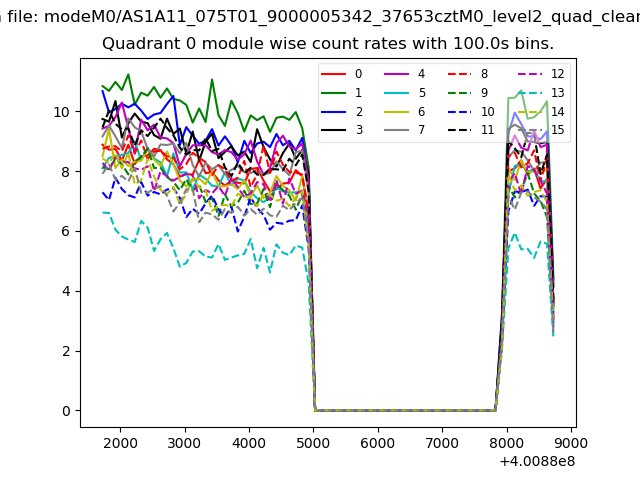 |
 |
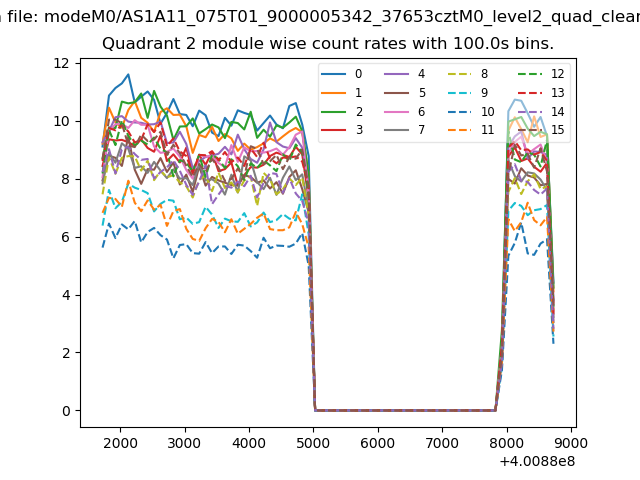
| Module-wise count rates for Quadrant B Data is divided into 100 sec bins |
 |
 |
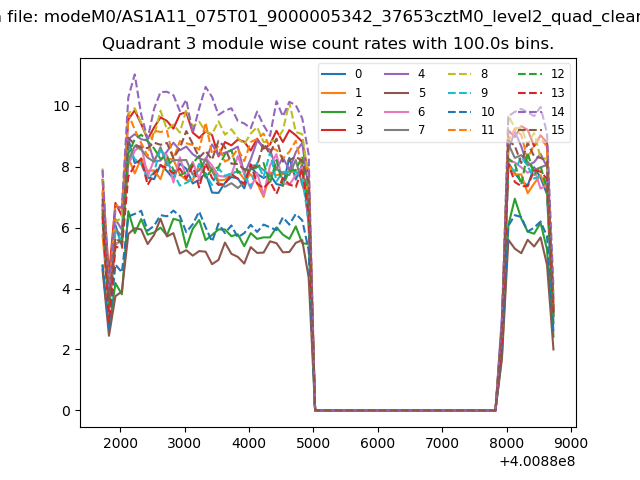
| Module-wise count rates for Quadrant C Data is divided into 100 sec bins |
 |
 |
| Module-wise count rates for Quadrant D Data is divided into 100 sec bins |
 |
 |
| Parameter | Plot |
|---|---|
| CZT HV Monitor | 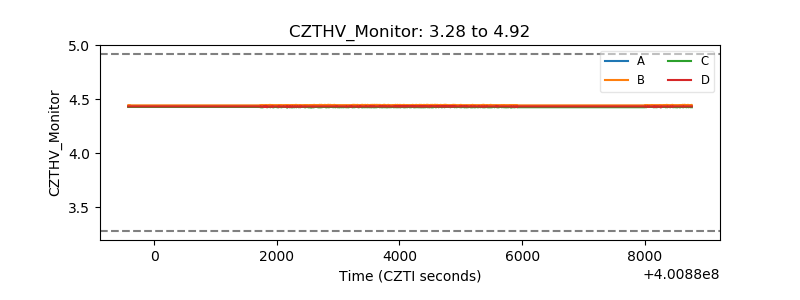 |
| D_VDD | 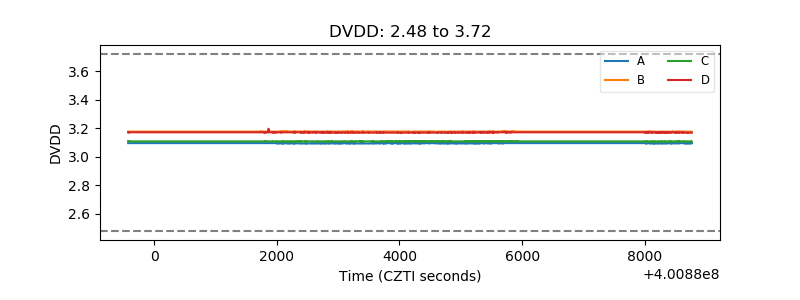 |
| Temperature 1 | 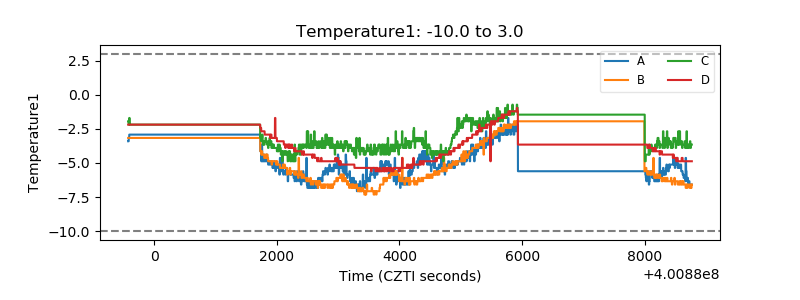 |
| Veto HV Monitor | 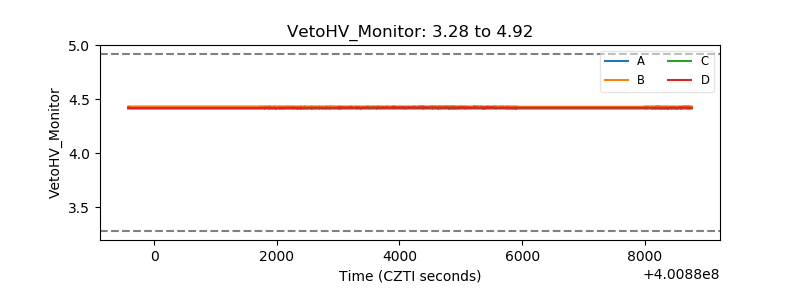 |
| Veto LLD | 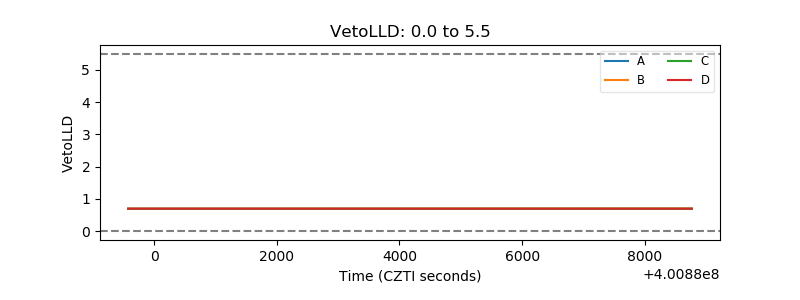 |
| Alpha Counter | 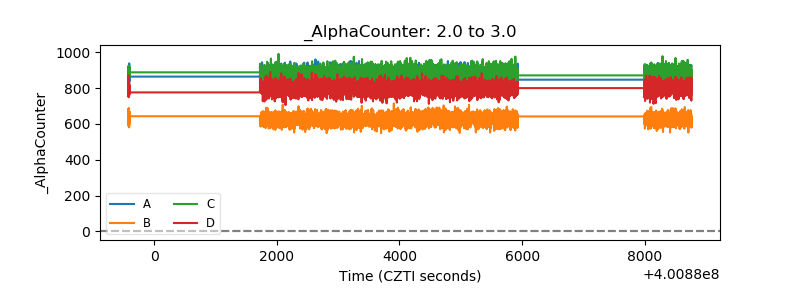 |
| _CPM_Rate | 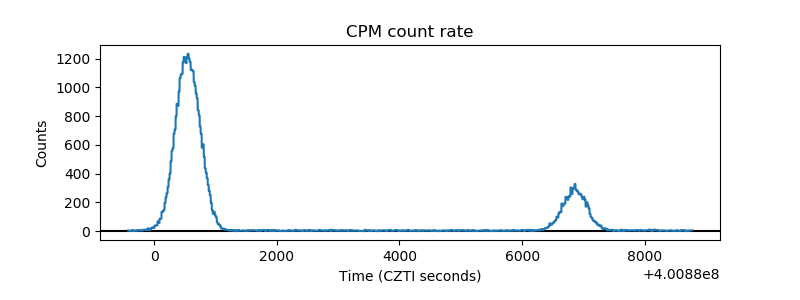 |
| CZT Counter | 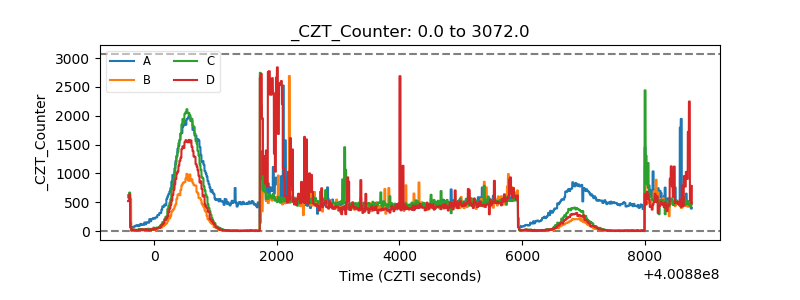 |
| +2.5 Volts monitor | 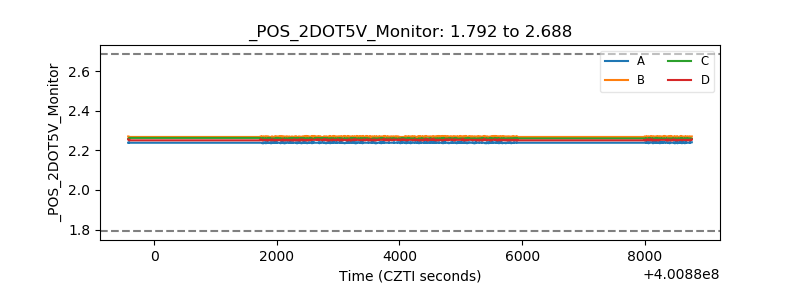 |
| +5 Volts monitor | 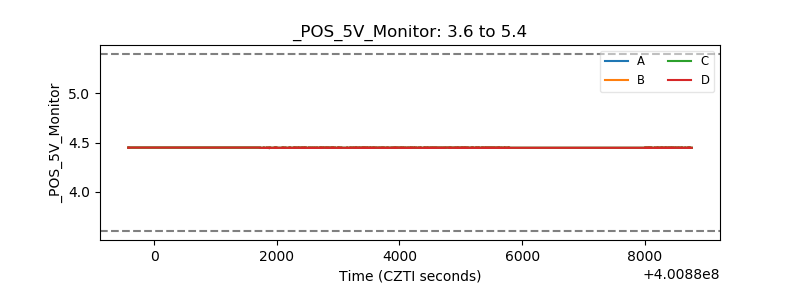 |
| _ROLL_ROT | 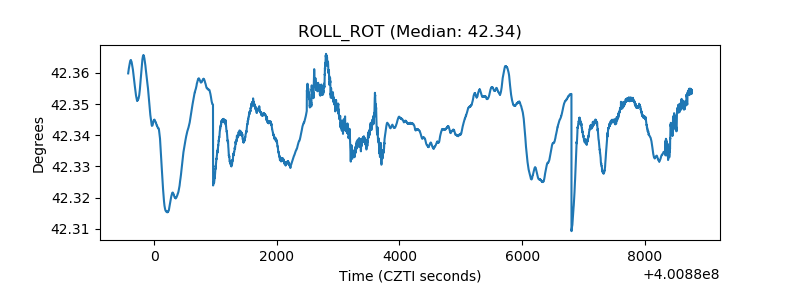 |
| _Roll_DEC | 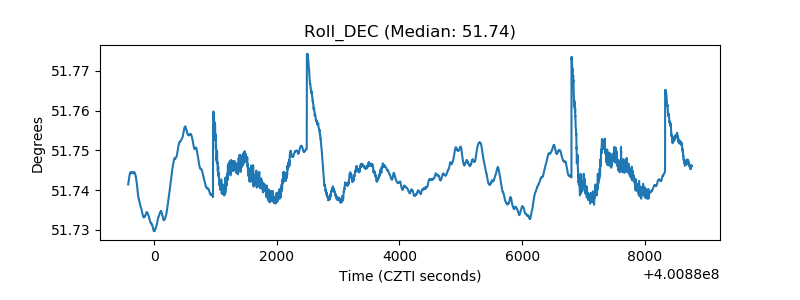 |
| _Roll_RA | 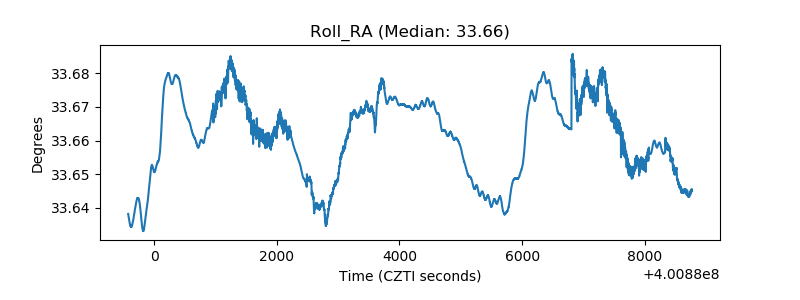 |
| Veto Counter | 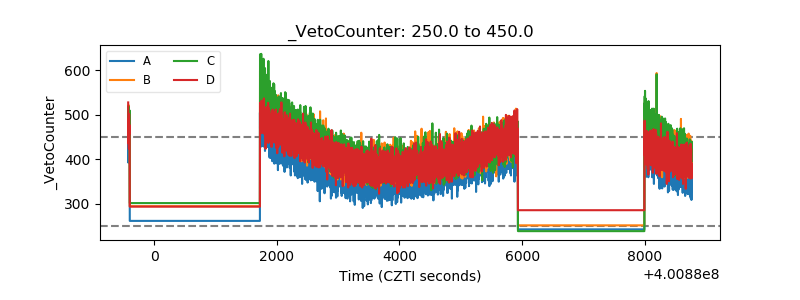 |