| Param | Original file | Final file |
|---|---|---|
| Filename | modeM0/AS1A11_075T01_9000005342_37654cztM0_level2.evt | modeM0/AS1A11_075T01_9000005342_37654cztM0_level2_quad_clean.evt |
| Size (bytes) | 460,471,680 | 70,675,200 |
| Size | 439.1 MB | 67.4 MB |
| Events in quadrant A | 3,116,558 | 437,057 |
| Events in quadrant B | 2,901,046 | 454,594 |
| Events in quadrant C | 2,946,518 | 459,109 |
| Events in quadrant D | 4,583,630 | 380,037 |
| Mode SS | |||
|---|---|---|---|
| Quadrant | BADHDUFLAG | Total packets | Discarded packets |
| A | 0 | 122 | 0 |
| B | 0 | 122 | 0 |
| C | 0 | 122 | 0 |
| D | 0 | 122 | 0 |
| Mode M0 | |||
|---|---|---|---|
| Quadrant | BADHDUFLAG | Total packets | Discarded packets |
| A | 0 | 12979 | 3 |
| B | 0 | 12429 | 2 |
| C | 0 | 12232 | 2 |
| D | 0 | 17714 | 2 |
| Mode M9 | |||
|---|---|---|---|
| Quadrant | BADHDUFLAG | Total packets | Discarded packets |
| A | 0 | 38 | 0 |
| B | 0 | 38 | 0 |
| C | 0 | 38 | 0 |
| D | 0 | 38 | 0 |
| Quadrant | Total seconds | Saturated seconds | Saturation percentage |
|---|---|---|---|
| A | 5848 | 24 | 0.410397% |
| B | 5848 | 25 | 0.427497% |
| C | 5848 | 26 | 0.444596% |
| D | 5848 | 711 | 12.158003% |
Noise dominated data is calculated using 1-second bins in cleaned event files. If a bin has >2000 counts, and if more than 50% of those come from <1% of pixels, then it is considered to be noise-dominated and hence unusable.
| Quadrant | # 1 sec bins | Bins with >0 counts | Bins with >2000 counts | High rate bins dominated by noise | Noise dominated (total time) | Noise dominated (detector-on time) | Marked lightcurve |
|---|---|---|---|---|---|---|---|
| A | 9732 | 5850 | 18 | 18 | 0.18% | 0.31% | 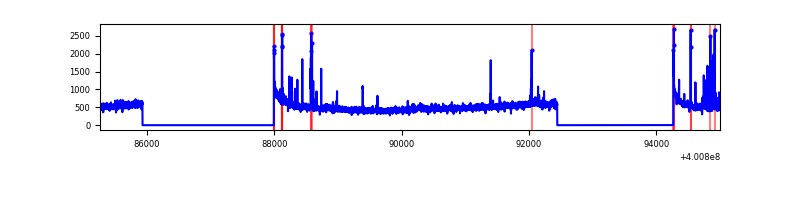 |
| B | 9732 | 5848 | 7 | 7 | 0.07% | 0.12% | 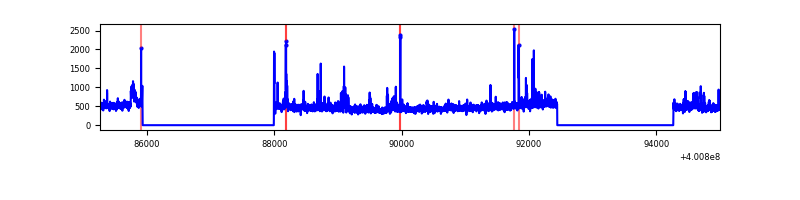 |
| C | 9732 | 5848 | 17 | 17 | 0.17% | 0.29% | 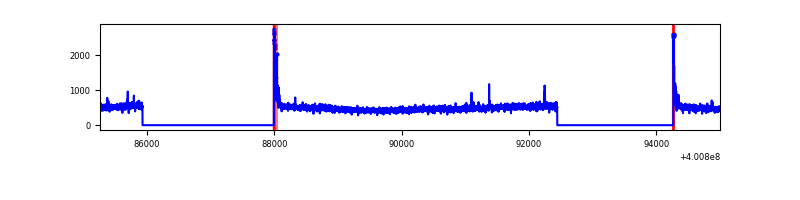 |
| D | 9732 | 5848 | 717 | 717 | 7.37% | 12.26% | 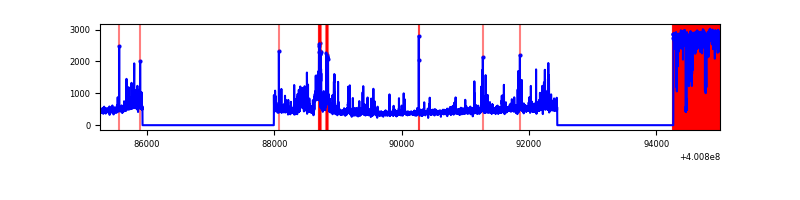 |
Top three noisy pixels from each quadrant. If the there are fewer than three noisy pixels in the level2.evt file, extra rows are filled as -1
| Pixel properties | Quadrant properties | ||||||
|---|---|---|---|---|---|---|---|
| Quadrant | DetID | PixID | Counts | Sigma | Mean | Median | Sigma |
| A | 10 | 83 | 317319 | 2356.35 | 666 | 652 | 134.4 |
| A | 15 | 222 | 96869 | 715.96 | 666 | 652 | 134.4 |
| A | 9 | 143 | 79018 | 583.13 | 666 | 652 | 134.4 |
| B | 4 | 232 | 67134 | 520.43 | 669 | 652 | 127.7 |
| B | 5 | 200 | 48304 | 373.03 | 669 | 652 | 127.7 |
| B | 0 | 230 | 39347 | 302.91 | 669 | 652 | 127.7 |
| C | 15 | 214 | 266499 | 1759.67 | 656 | 661 | 151.1 |
| C | 0 | 10 | 103736 | 682.29 | 656 | 661 | 151.1 |
| C | 15 | 159 | 9869 | 60.95 | 656 | 661 | 151.1 |
| D | 12 | 227 | 1752916 | 11720.99 | 612 | 593 | 149.5 |
| D | 2 | 249 | 303238 | 2024.34 | 612 | 593 | 149.5 |
| D | 10 | 199 | 40357 | 265.97 | 612 | 593 | 149.5 |
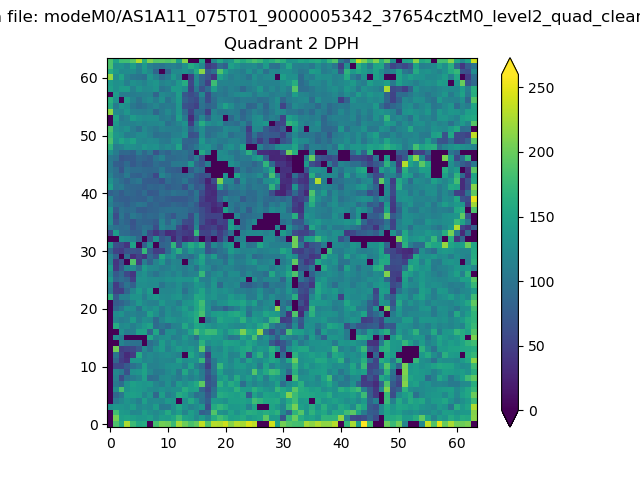
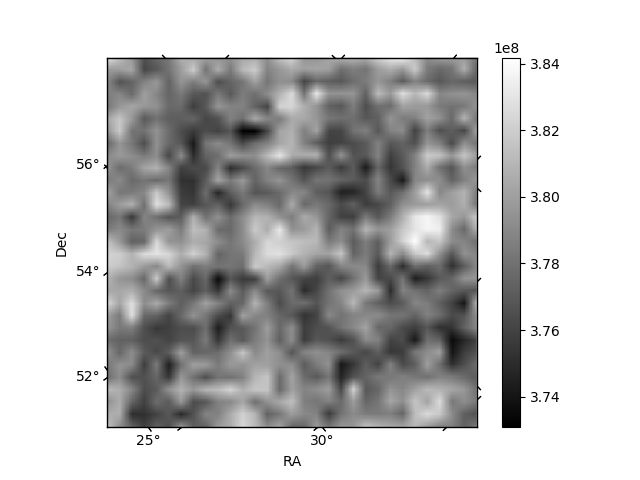
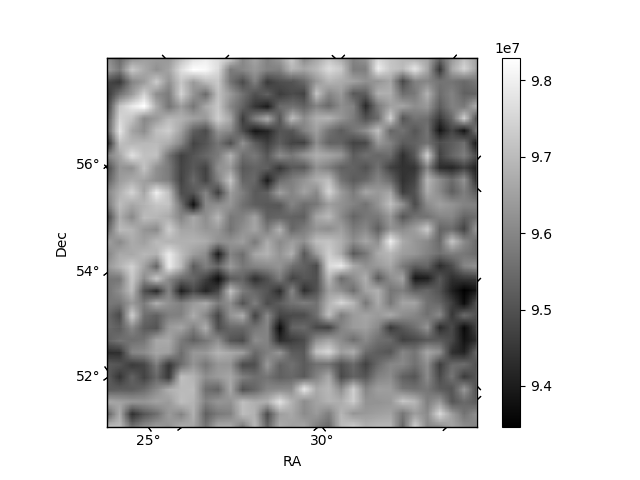
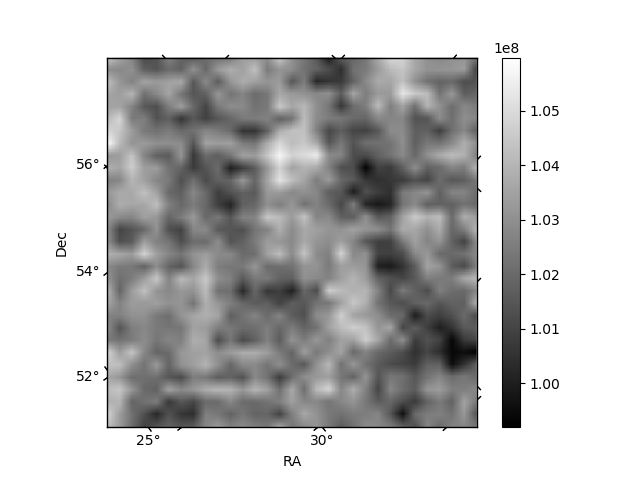
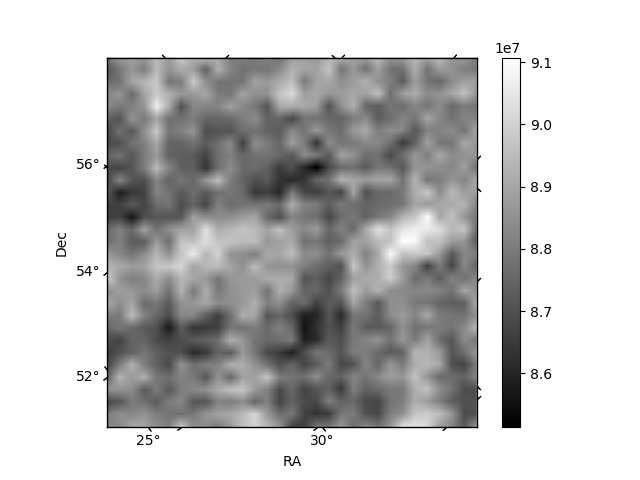
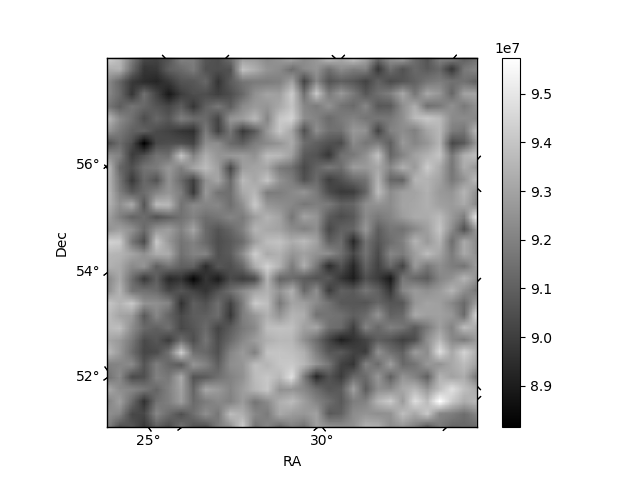
Histogram calculated using DETX and DETY for each event in the final _common_clean file
| Quadrant A | 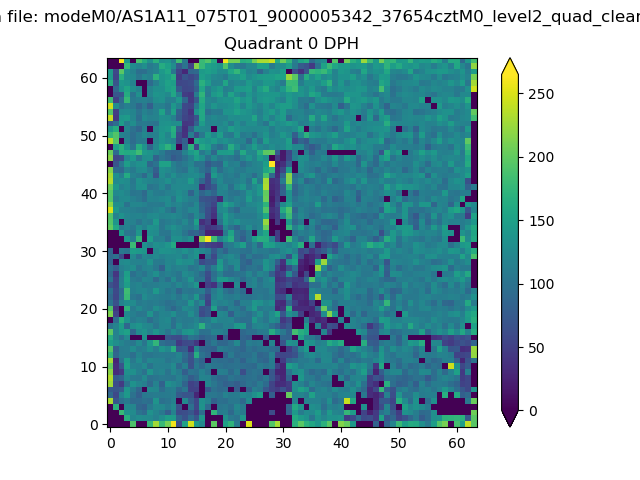 |
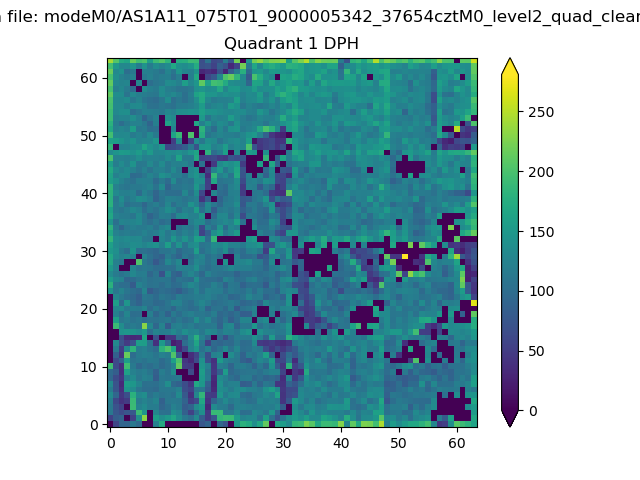 |
Quadrant B |
|---|---|---|---|
| Quadrant D | 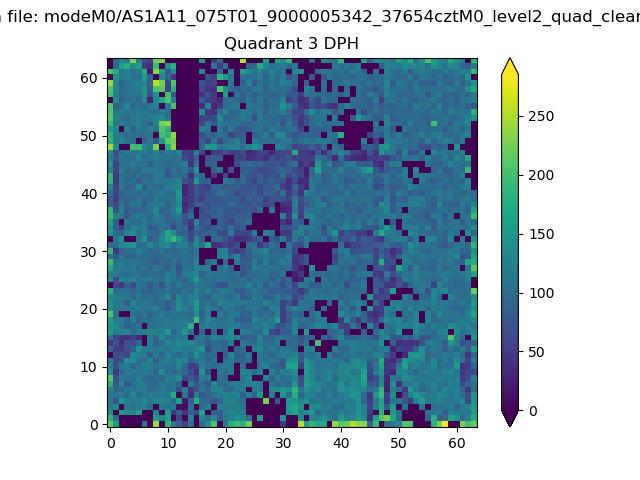 |
 |
Quadrant C |
| Plot type | Count rate plots | Images |
|---|---|---|
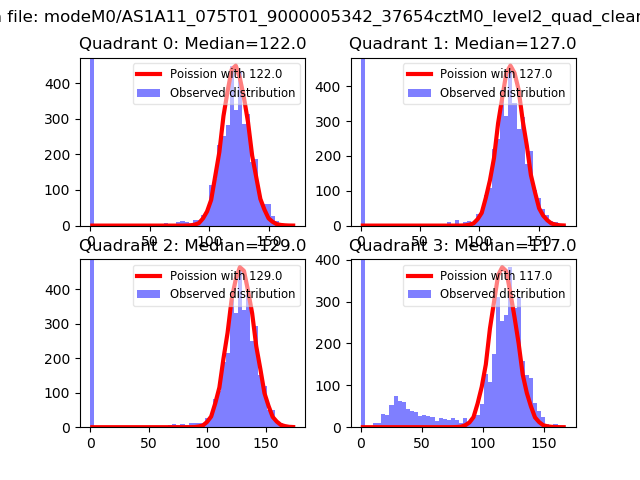
| Comparison with Poisson distribution Blue bars denote a histogram of data divided into 1 sec bins. Red curve is a Poisson curve with rate = median count rate of data. |
 |
 |
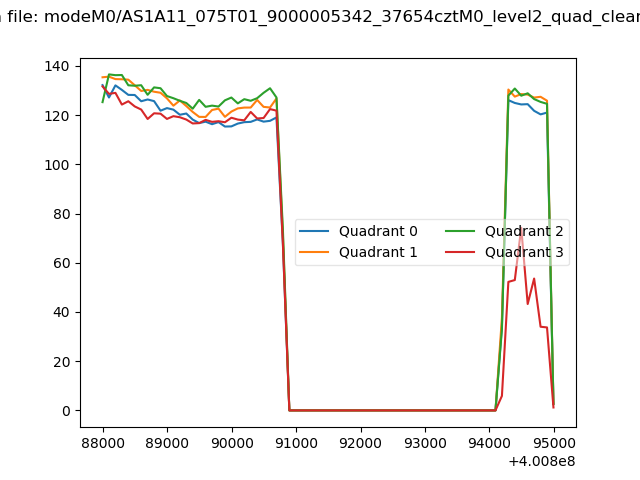
| Quadrant-wise count rates Data is divided into 100 sec bins |
 |
|
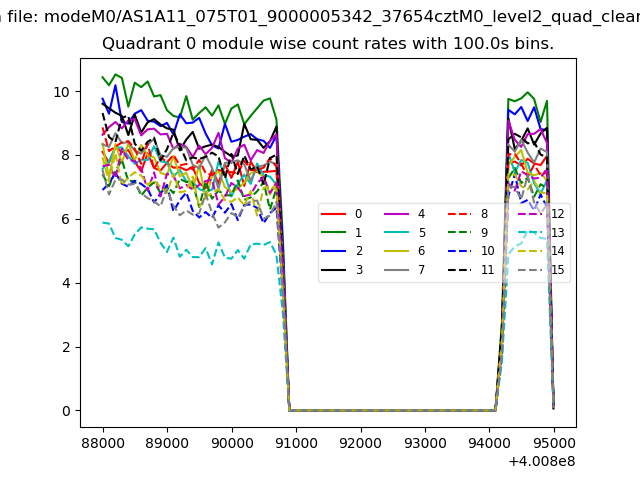
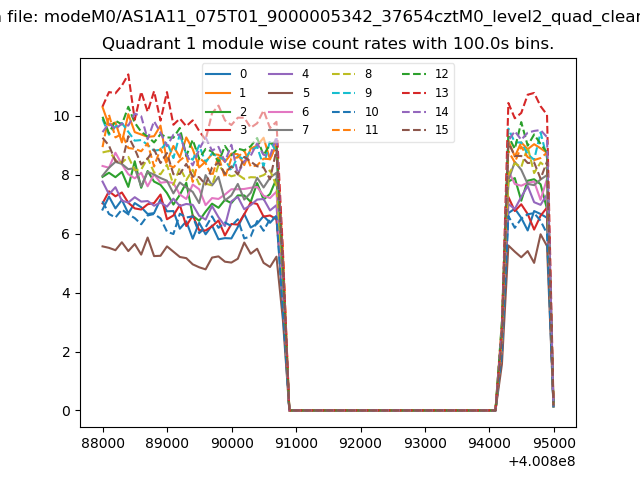
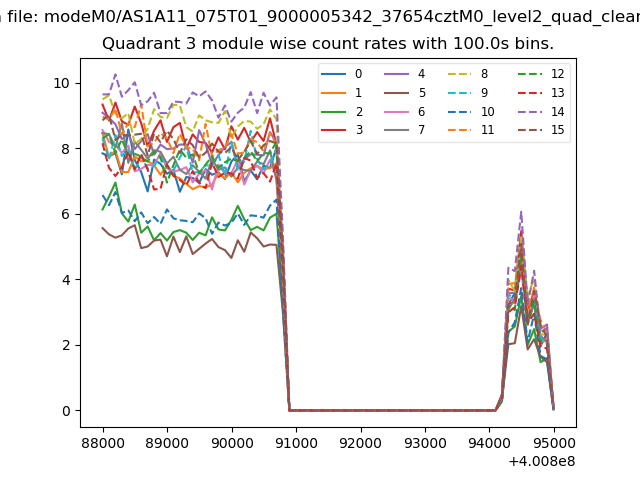
| Module-wise count rates for Quadrant A Data is divided into 100 sec bins |
 |
 |
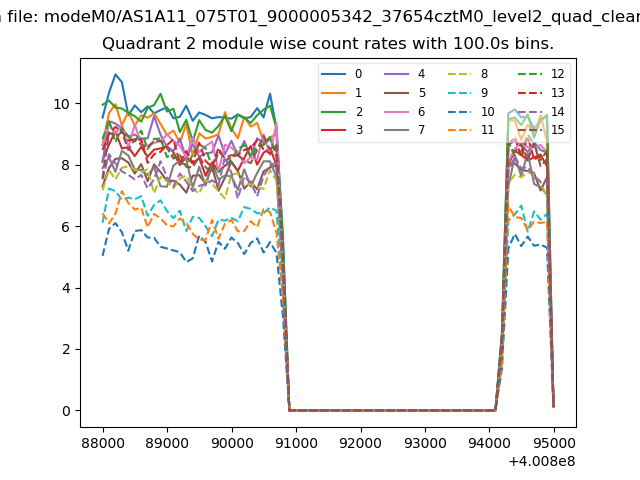
| Module-wise count rates for Quadrant B Data is divided into 100 sec bins |
 |
 |
| Module-wise count rates for Quadrant C Data is divided into 100 sec bins |
 |
 |
| Module-wise count rates for Quadrant D Data is divided into 100 sec bins |
 |
 |
| Parameter | Plot |
|---|---|
| CZT HV Monitor | 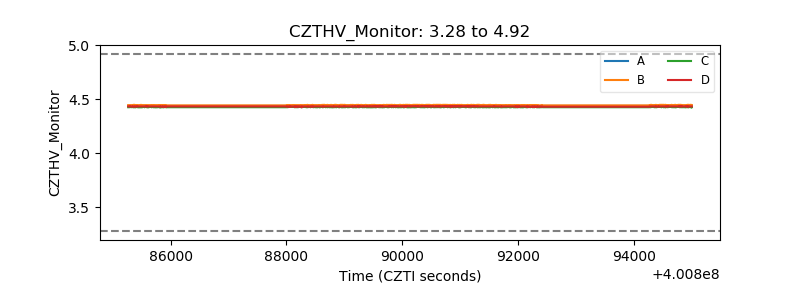 |
| D_VDD | 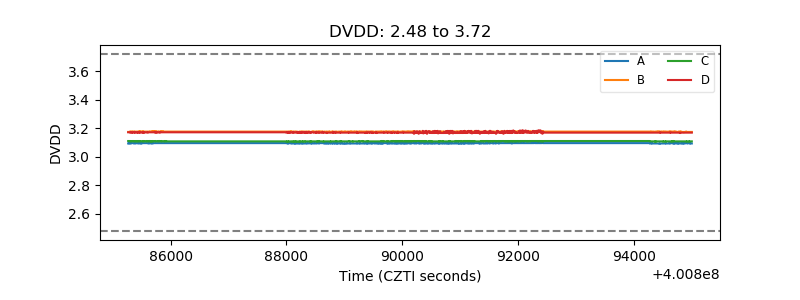 |
| Temperature 1 | 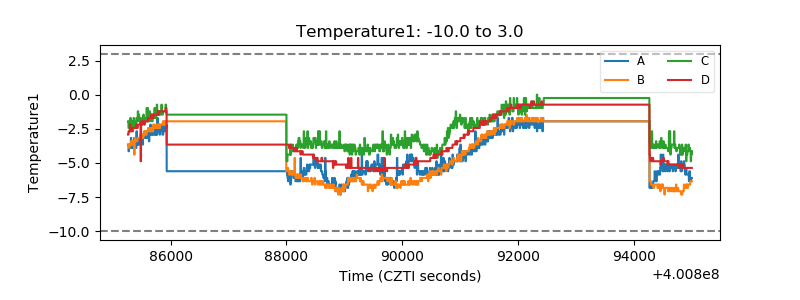 |
| Veto HV Monitor | 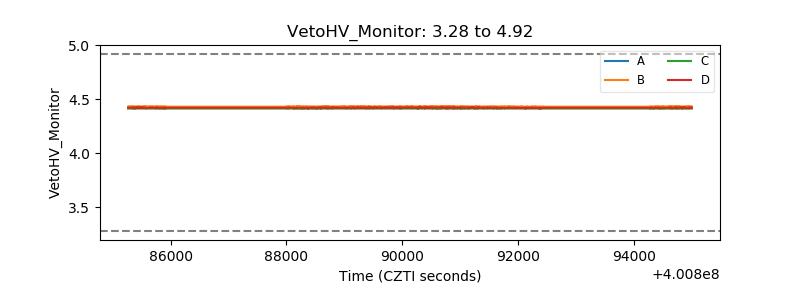 |
| Veto LLD | 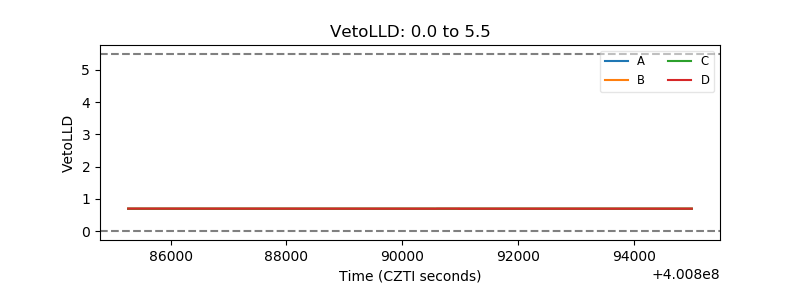 |
| Alpha Counter | 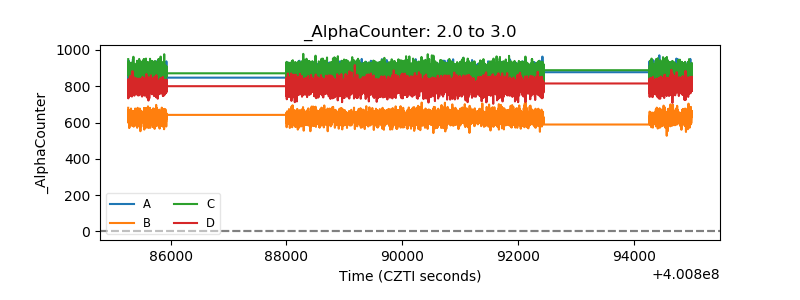 |
| _CPM_Rate | 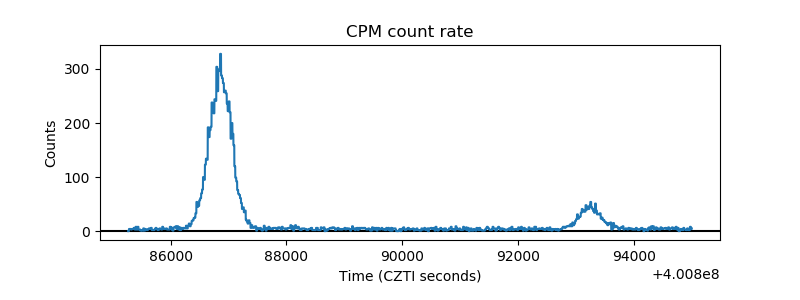 |
| CZT Counter | 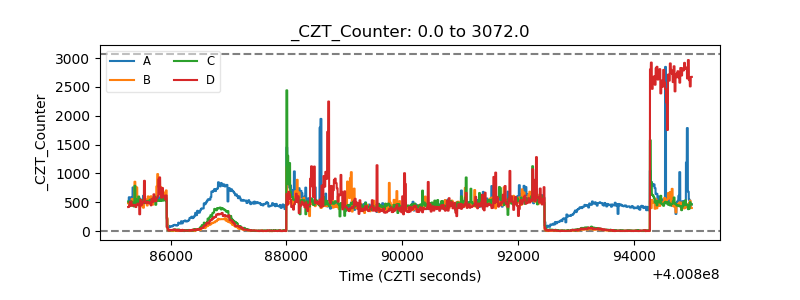 |
| +2.5 Volts monitor | 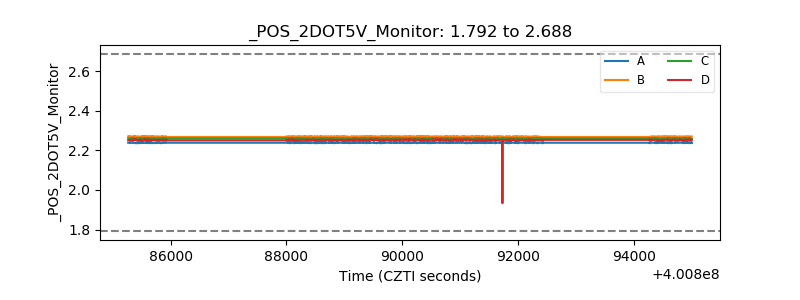 |
| +5 Volts monitor | 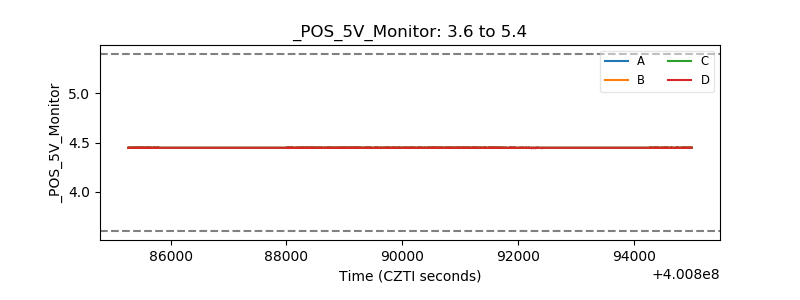 |
| _ROLL_ROT | 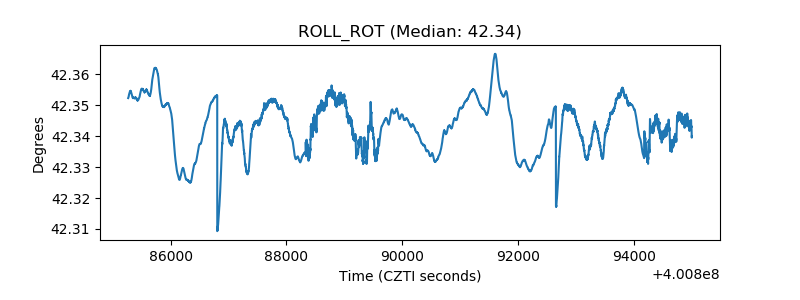 |
| _Roll_DEC | 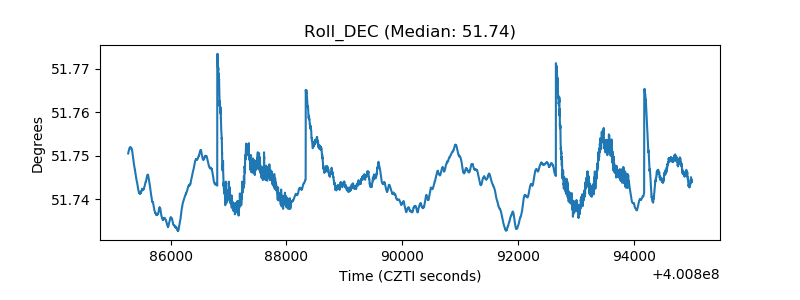 |
| _Roll_RA | 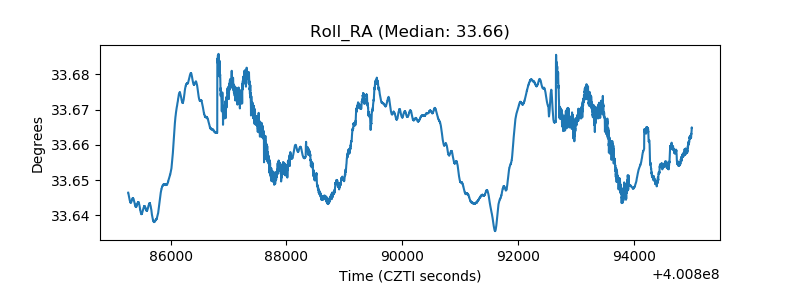 |
| Veto Counter | 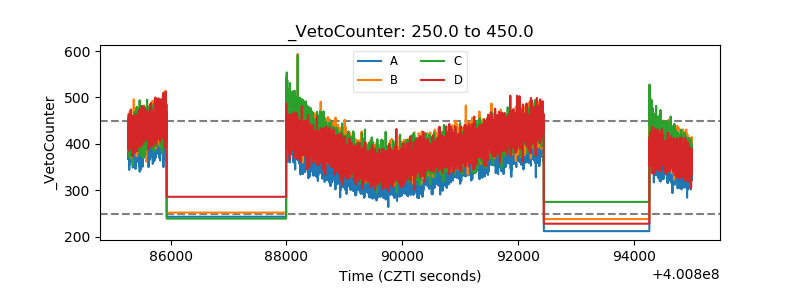 |