| Param | Original file | Final file |
|---|---|---|
| Filename | modeM0/AS1A11_075T01_9000005342_37655cztM0_level2.evt | modeM0/AS1A11_075T01_9000005342_37655cztM0_level2_quad_clean.evt |
| Size (bytes) | 694,425,600 | 68,604,480 |
| Size | 662.3 MB | 65.4 MB |
| Events in quadrant A | 5,626,926 | 416,815 |
| Events in quadrant B | 2,884,347 | 460,653 |
| Events in quadrant C | 2,790,616 | 464,054 |
| Events in quadrant D | 9,345,524 | 338,284 |
| Mode SS | |||
|---|---|---|---|
| Quadrant | BADHDUFLAG | Total packets | Discarded packets |
| A | 0 | 114 | 0 |
| B | 0 | 114 | 0 |
| C | 0 | 114 | 0 |
| D | 0 | 114 | 0 |
| Mode M0 | |||
|---|---|---|---|
| Quadrant | BADHDUFLAG | Total packets | Discarded packets |
| A | 0 | 20595 | 3 |
| B | 0 | 12480 | 2 |
| C | 0 | 11823 | 2 |
| D | 0 | 31788 | 2 |
| Mode M9 | |||
|---|---|---|---|
| Quadrant | BADHDUFLAG | Total packets | Discarded packets |
| A | 0 | 29 | 0 |
| B | 0 | 29 | 0 |
| C | 0 | 29 | 0 |
| D | 0 | 30 | 0 |
| Quadrant | Total seconds | Saturated seconds | Saturation percentage |
|---|---|---|---|
| A | 5674 | 690 | 12.160733% |
| B | 5674 | 78 | 1.374692% |
| C | 5674 | 18 | 0.317237% |
| D | 5674 | 2637 | 46.475150% |
Noise dominated data is calculated using 1-second bins in cleaned event files. If a bin has >2000 counts, and if more than 50% of those come from <1% of pixels, then it is considered to be noise-dominated and hence unusable.
| Quadrant | # 1 sec bins | Bins with >0 counts | Bins with >2000 counts | High rate bins dominated by noise | Noise dominated (total time) | Noise dominated (detector-on time) | Marked lightcurve |
|---|---|---|---|---|---|---|---|
| A | 7137 | 5675 | 600 | 600 | 8.41% | 10.57% | 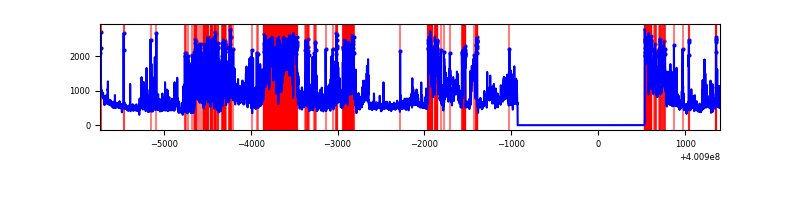 |
| B | 7136 | 5673 | 31 | 31 | 0.43% | 0.55% | 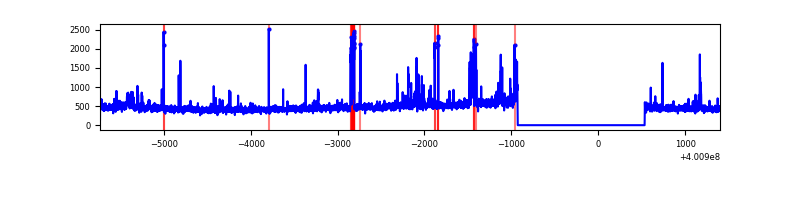 |
| C | 7136 | 5673 | 11 | 11 | 0.15% | 0.19% | 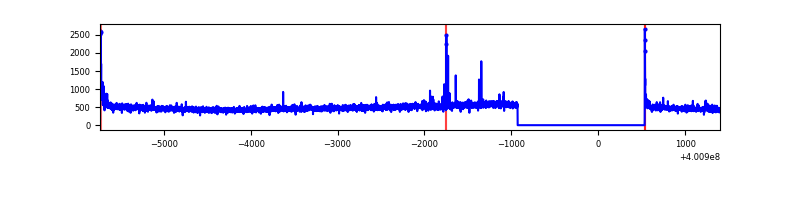 |
| D | 7136 | 5673 | 2587 | 2587 | 36.25% | 45.60% | 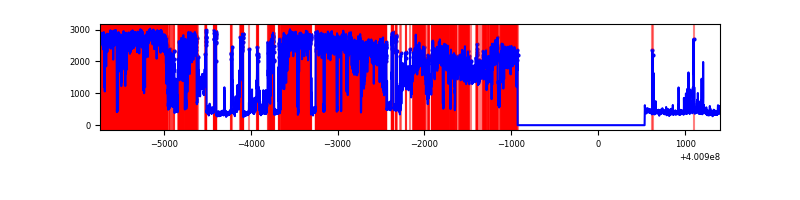 |
Top three noisy pixels from each quadrant. If the there are fewer than three noisy pixels in the level2.evt file, extra rows are filled as -1
| Pixel properties | Quadrant properties | ||||||
|---|---|---|---|---|---|---|---|
| Quadrant | DetID | PixID | Counts | Sigma | Mean | Median | Sigma |
| A | 15 | 222 | 2851391 | 23276.17 | 608 | 596 | 122.5 |
| A | 10 | 83 | 308010 | 2509.97 | 608 | 596 | 122.5 |
| A | 9 | 143 | 77196 | 625.42 | 608 | 596 | 122.5 |
| B | 5 | 172 | 129125 | 1045.23 | 636 | 617 | 122.9 |
| B | 5 | 255 | 98158 | 793.35 | 636 | 617 | 122.9 |
| B | 5 | 200 | 45203 | 362.64 | 636 | 617 | 122.9 |
| C | 15 | 214 | 259206 | 1778.75 | 626 | 630 | 145.4 |
| C | 0 | 10 | 54083 | 367.7 | 626 | 630 | 145.4 |
| C | 14 | 254 | 25287 | 169.62 | 626 | 630 | 145.4 |
| D | 12 | 227 | 7097731 | 57246.13 | 510 | 496 | 124.0 |
| D | 13 | 249 | 94536 | 758.52 | 510 | 496 | 124.0 |
| D | 2 | 249 | 45635 | 364.09 | 510 | 496 | 124.0 |
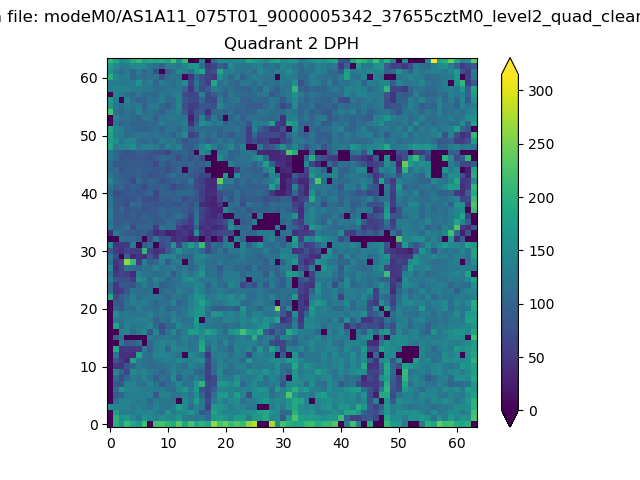
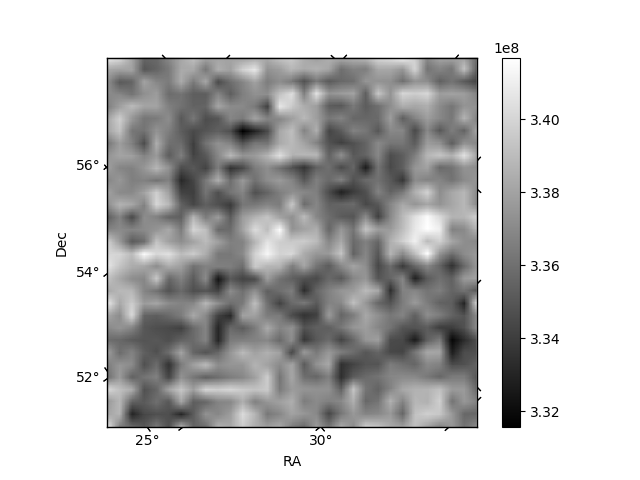
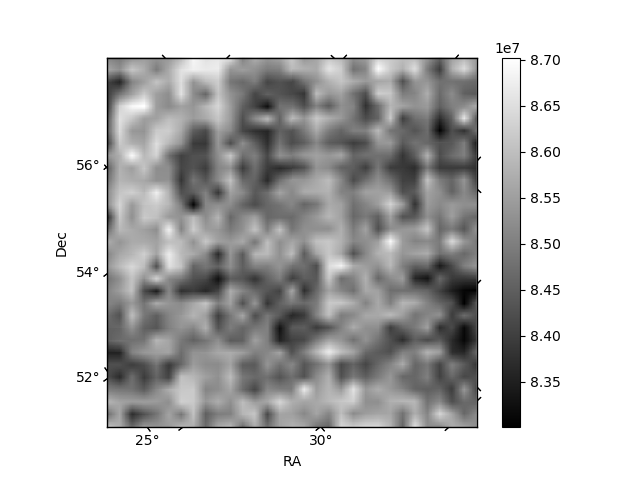
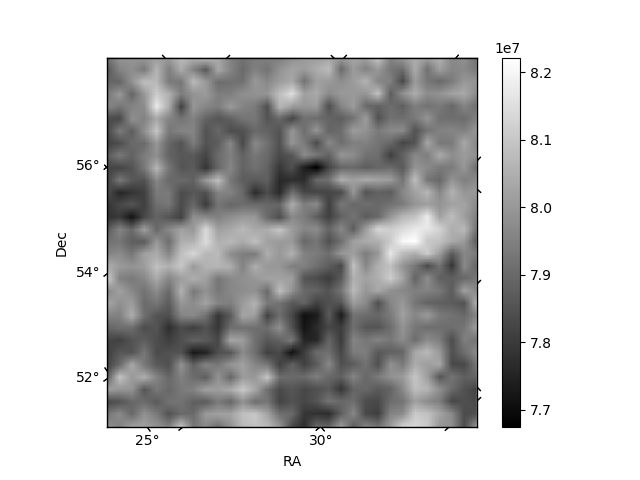
Histogram calculated using DETX and DETY for each event in the final _common_clean file
| Quadrant A | 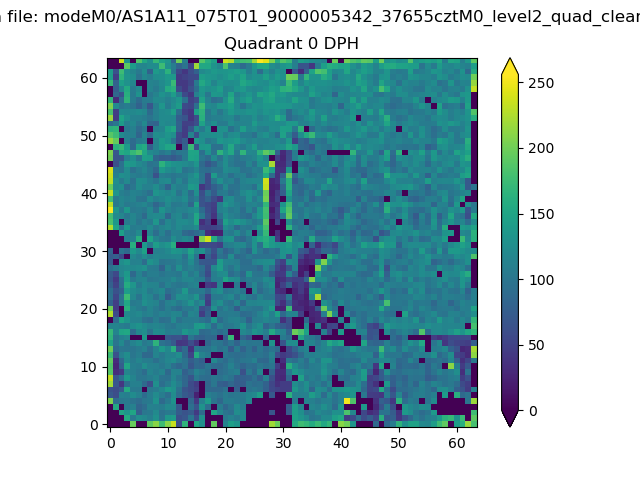 |
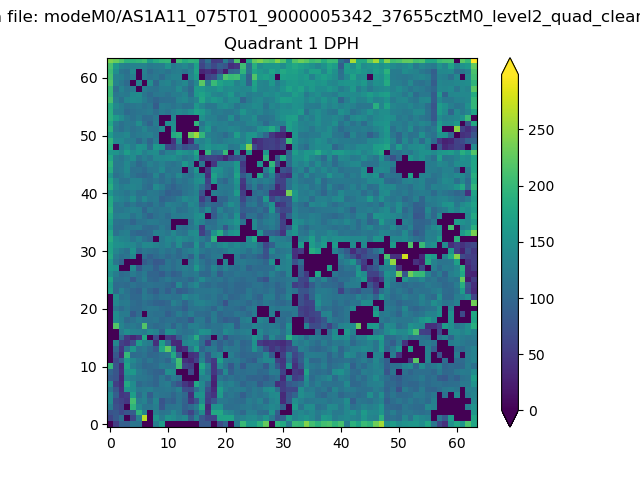 |
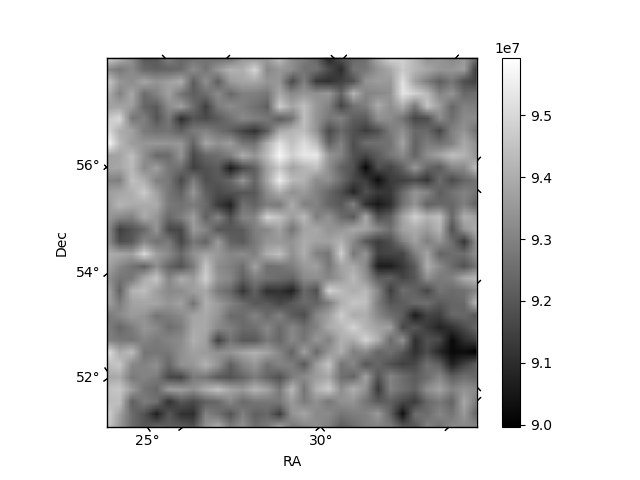
Quadrant B |
|---|---|---|---|
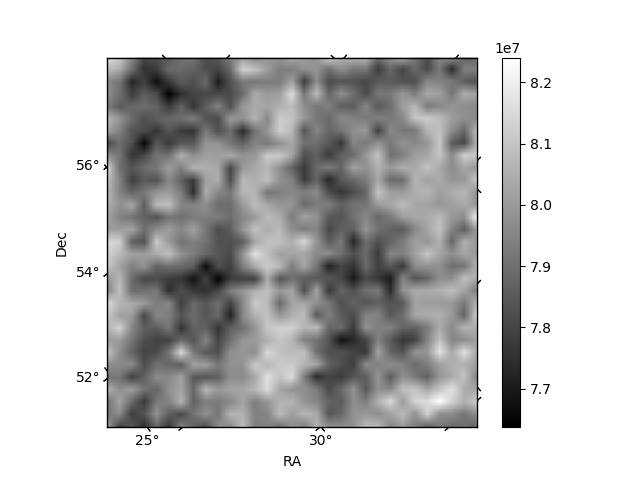
| Quadrant D | 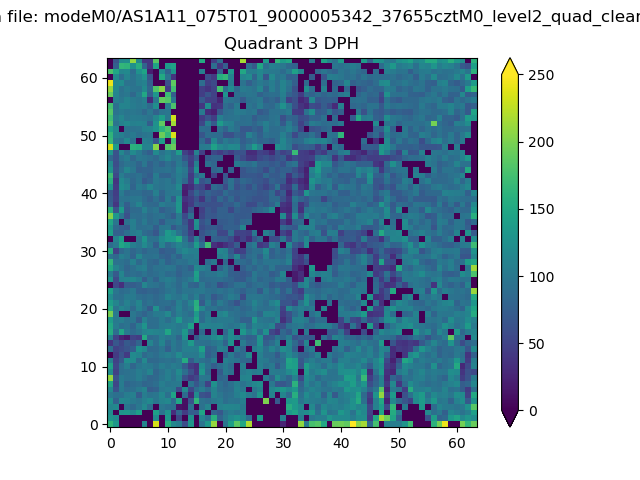 |
 |
Quadrant C |
| Plot type | Count rate plots | Images |
|---|---|---|
| Comparison with Poisson distribution Blue bars denote a histogram of data divided into 1 sec bins. Red curve is a Poisson curve with rate = median count rate of data. |
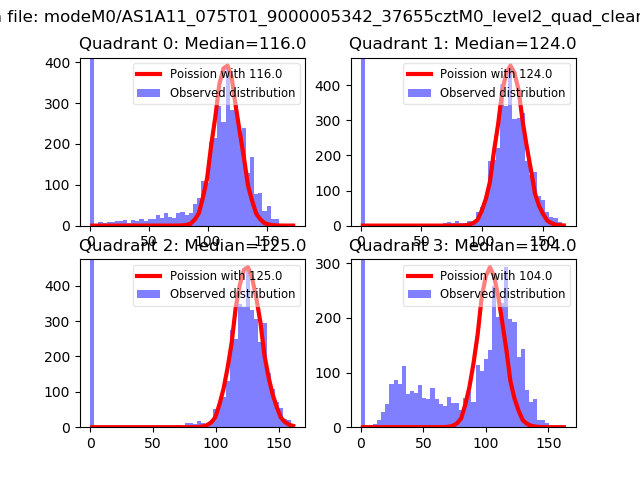 |
 |
| Quadrant-wise count rates Data is divided into 100 sec bins |
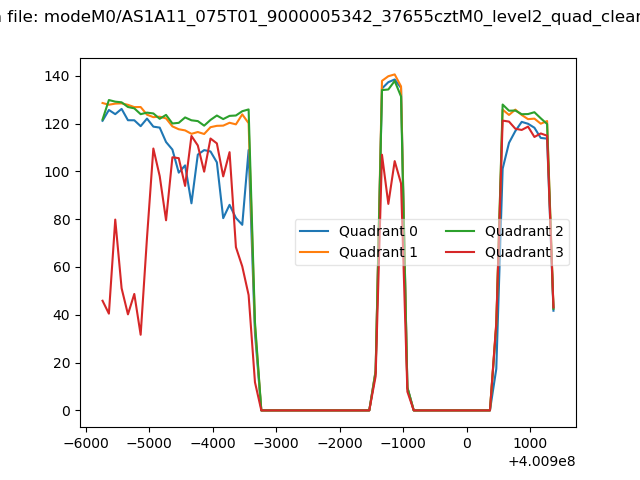 |
|
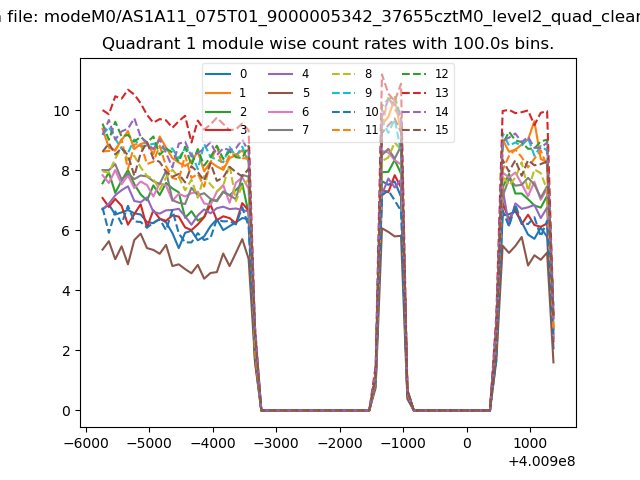
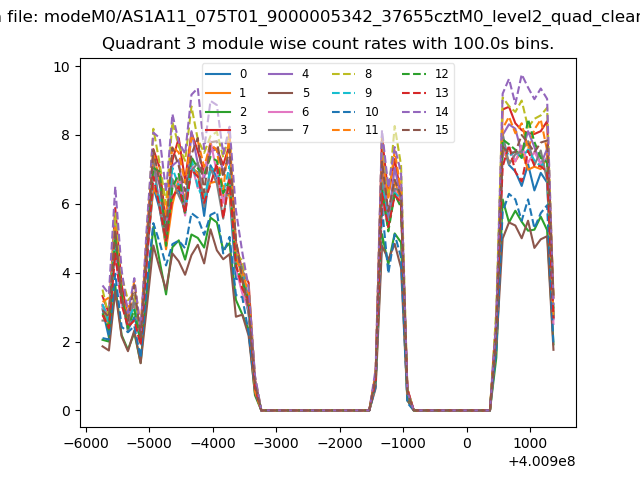
| Module-wise count rates for Quadrant A Data is divided into 100 sec bins |
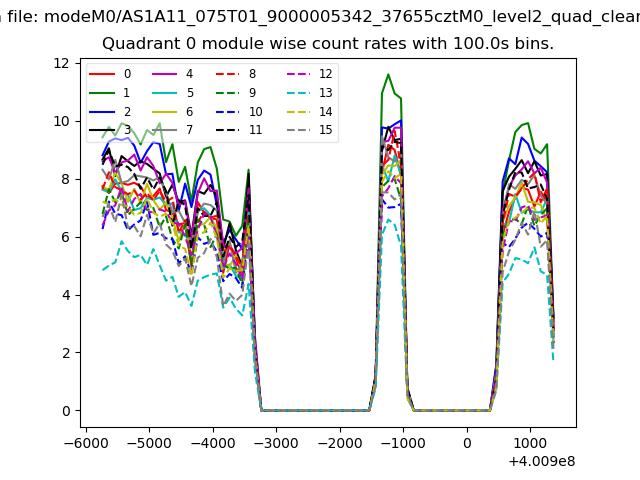 |
 |
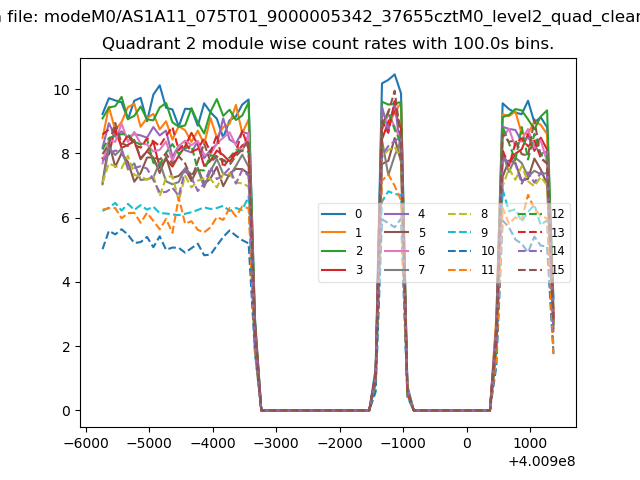
| Module-wise count rates for Quadrant B Data is divided into 100 sec bins |
 |
 |
| Module-wise count rates for Quadrant C Data is divided into 100 sec bins |
 |
 |
| Module-wise count rates for Quadrant D Data is divided into 100 sec bins |
 |
 |
| Parameter | Plot |
|---|---|
| CZT HV Monitor | 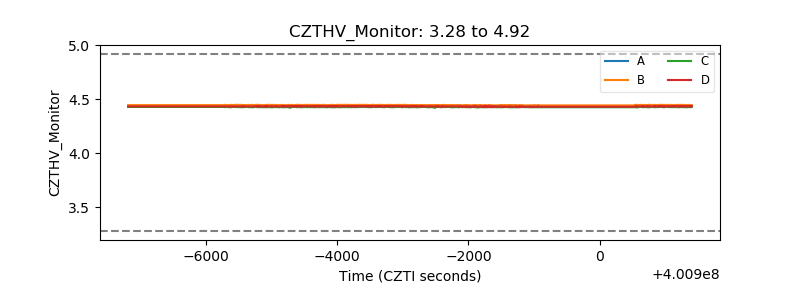 |
| D_VDD | 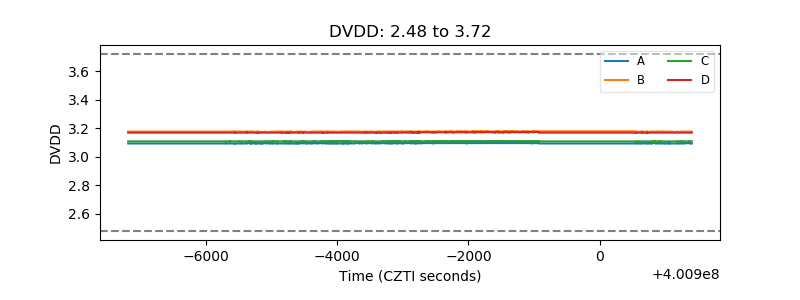 |
| Temperature 1 |  |
| Veto HV Monitor | 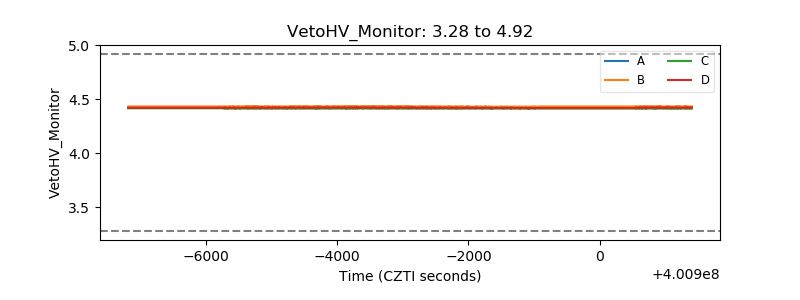 |
| Veto LLD | 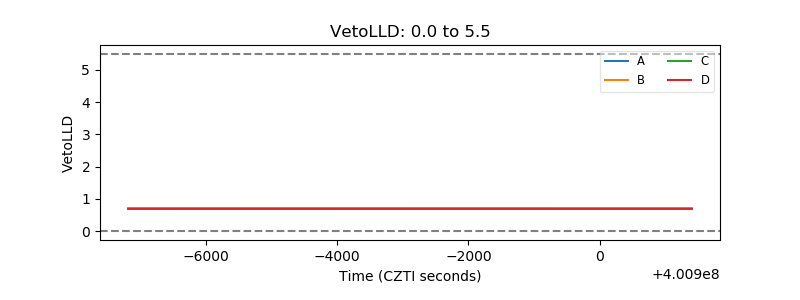 |
| Alpha Counter | 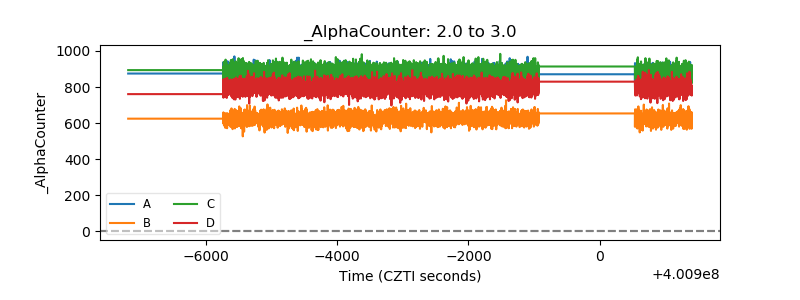 |
| _CPM_Rate | 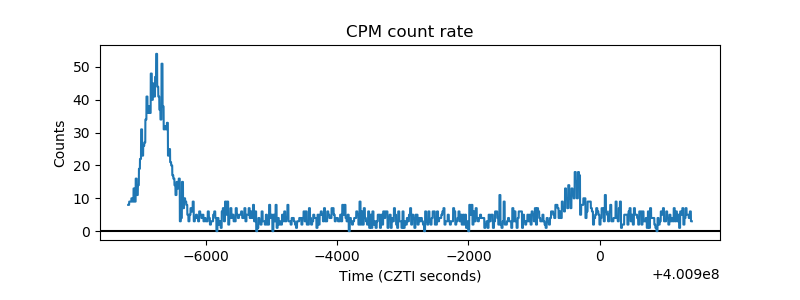 |
| CZT Counter | 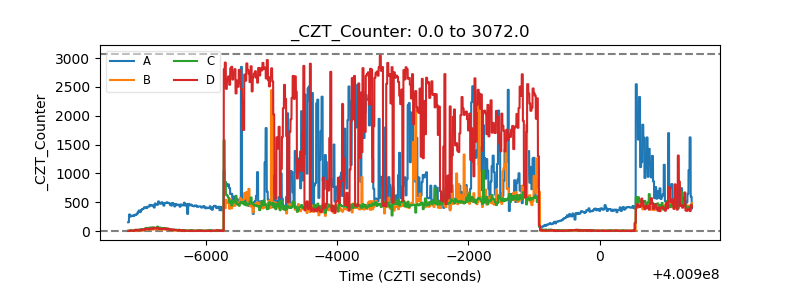 |
| +2.5 Volts monitor | 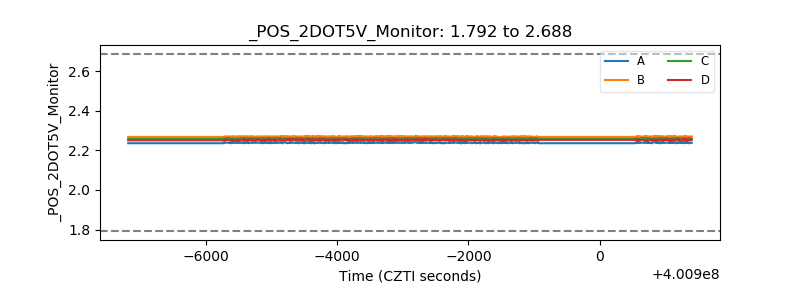 |
| +5 Volts monitor | 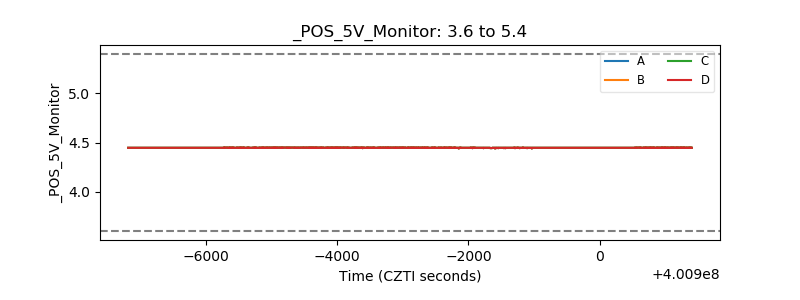 |
| _ROLL_ROT | 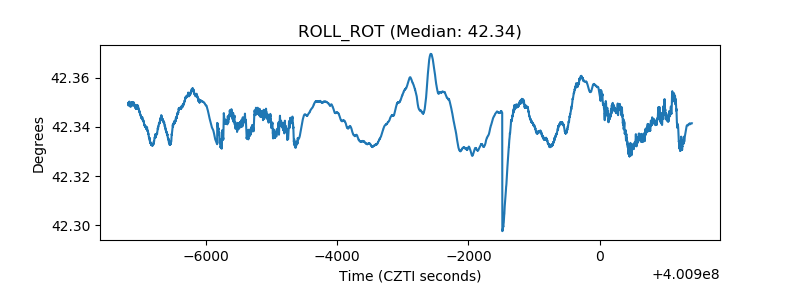 |
| _Roll_DEC | 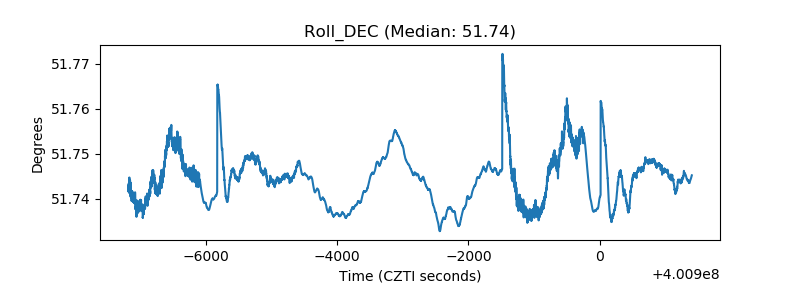 |
| _Roll_RA | 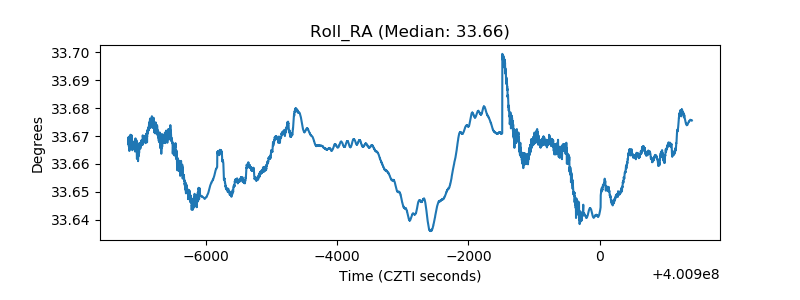 |
| Veto Counter | 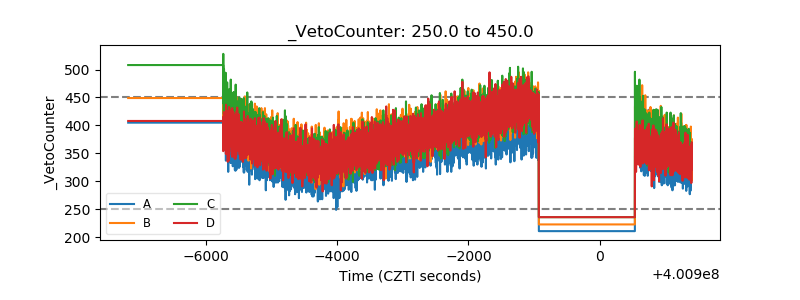 |