| Param | Original file | Final file |
|---|---|---|
| Filename | modeM0/AS1A11_075T01_9000005342_37656cztM0_level2.evt | modeM0/AS1A11_075T01_9000005342_37656cztM0_level2_quad_clean.evt |
| Size (bytes) | 579,841,920 | 84,378,240 |
| Size | 553.0 MB | 80.5 MB |
| Events in quadrant A | 5,005,724 | 522,675 |
| Events in quadrant B | 3,220,524 | 548,527 |
| Events in quadrant C | 3,179,802 | 550,245 |
| Events in quadrant D | 5,720,565 | 486,386 |
| Mode SS | |||
|---|---|---|---|
| Quadrant | BADHDUFLAG | Total packets | Discarded packets |
| A | 0 | 132 | 0 |
| B | 0 | 132 | 0 |
| C | 0 | 132 | 0 |
| D | 0 | 132 | 0 |
| Mode M0 | |||
|---|---|---|---|
| Quadrant | BADHDUFLAG | Total packets | Discarded packets |
| A | 0 | 19175 | 3 |
| B | 0 | 13850 | 2 |
| C | 0 | 13410 | 2 |
| D | 0 | 21511 | 2 |
| Mode M9 | |||
|---|---|---|---|
| Quadrant | BADHDUFLAG | Total packets | Discarded packets |
| A | 0 | 28 | 0 |
| B | 0 | 28 | 0 |
| C | 0 | 28 | 0 |
| D | 0 | 28 | 0 |
| Quadrant | Total seconds | Saturated seconds | Saturation percentage |
|---|---|---|---|
| A | 6408 | 171 | 2.668539% |
| B | 6408 | 53 | 0.827091% |
| C | 6408 | 12 | 0.187266% |
| D | 6408 | 765 | 11.938202% |
Noise dominated data is calculated using 1-second bins in cleaned event files. If a bin has >2000 counts, and if more than 50% of those come from <1% of pixels, then it is considered to be noise-dominated and hence unusable.
| Quadrant | # 1 sec bins | Bins with >0 counts | Bins with >2000 counts | High rate bins dominated by noise | Noise dominated (total time) | Noise dominated (detector-on time) | Marked lightcurve |
|---|---|---|---|---|---|---|---|
| A | 9185 | 6410 | 146 | 146 | 1.59% | 2.28% | 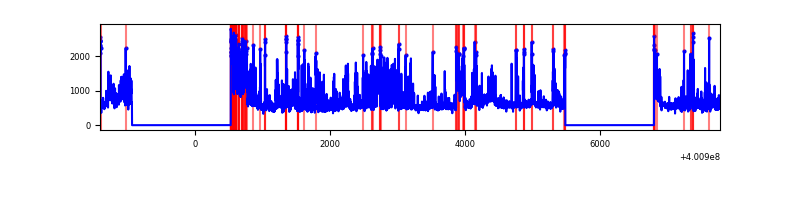 |
| B | 9185 | 6408 | 22 | 22 | 0.24% | 0.34% | 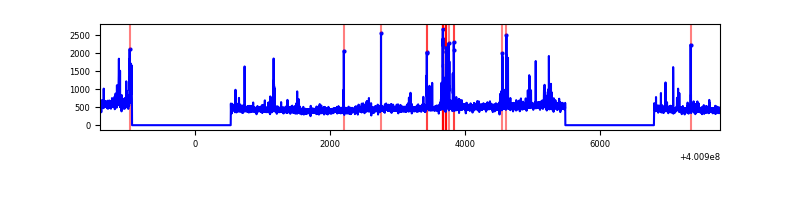 |
| C | 9185 | 6408 | 9 | 9 | 0.10% | 0.14% | 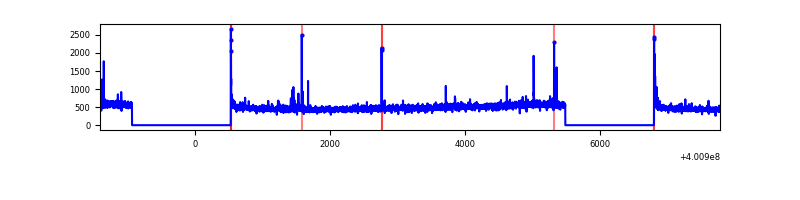 |
| D | 9185 | 6408 | 652 | 652 | 7.10% | 10.17% | 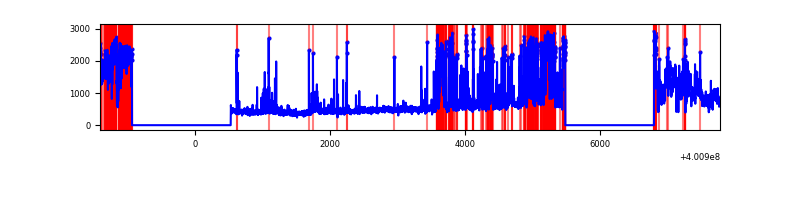 |
Top three noisy pixels from each quadrant. If the there are fewer than three noisy pixels in the level2.evt file, extra rows are filled as -1
| Pixel properties | Quadrant properties | ||||||
|---|---|---|---|---|---|---|---|
| Quadrant | DetID | PixID | Counts | Sigma | Mean | Median | Sigma |
| A | 15 | 222 | 1599653 | 11019.65 | 723 | 708 | 145.1 |
| A | 10 | 83 | 344292 | 2367.92 | 723 | 708 | 145.1 |
| A | 9 | 143 | 187247 | 1285.59 | 723 | 708 | 145.1 |
| B | 5 | 172 | 105021 | 743.81 | 729 | 709 | 140.2 |
| B | 5 | 255 | 73304 | 517.65 | 729 | 709 | 140.2 |
| B | 15 | 85 | 48930 | 343.85 | 729 | 709 | 140.2 |
| C | 15 | 214 | 292995 | 1760.03 | 716 | 721 | 166.1 |
| C | 0 | 10 | 39049 | 230.81 | 716 | 721 | 166.1 |
| C | 14 | 254 | 37319 | 220.39 | 716 | 721 | 166.1 |
| D | 12 | 227 | 2155338 | 13100.65 | 679 | 660 | 164.5 |
| D | 13 | 249 | 389433 | 2363.78 | 679 | 660 | 164.5 |
| D | 2 | 120 | 182841 | 1107.68 | 679 | 660 | 164.5 |
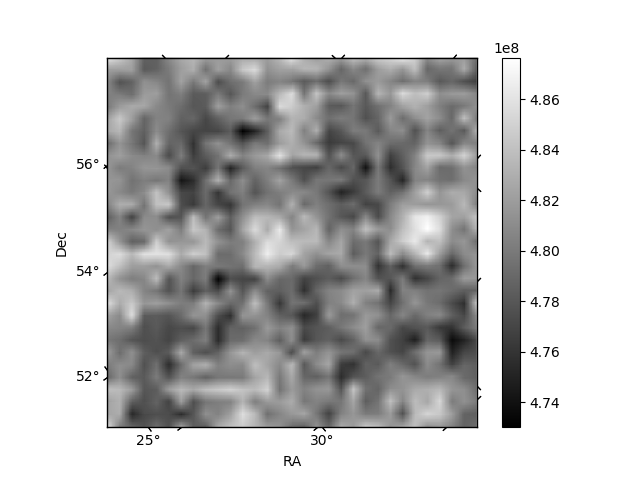
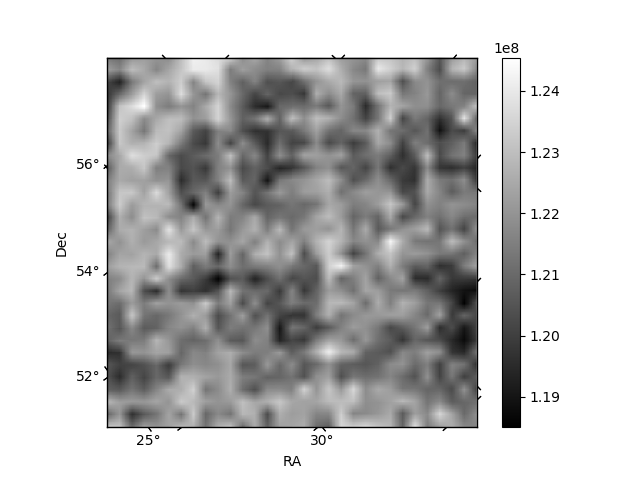
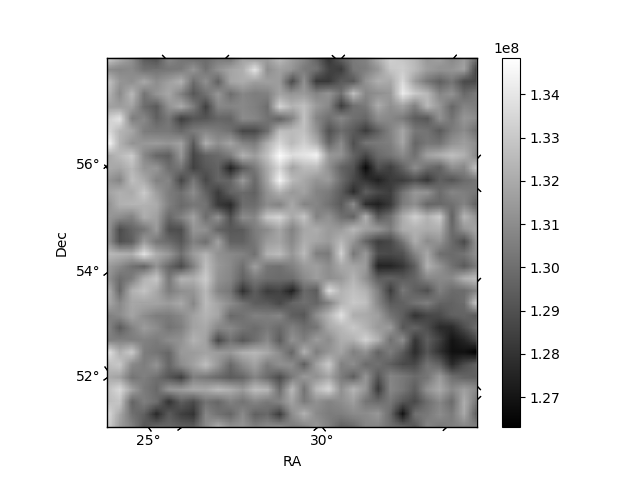
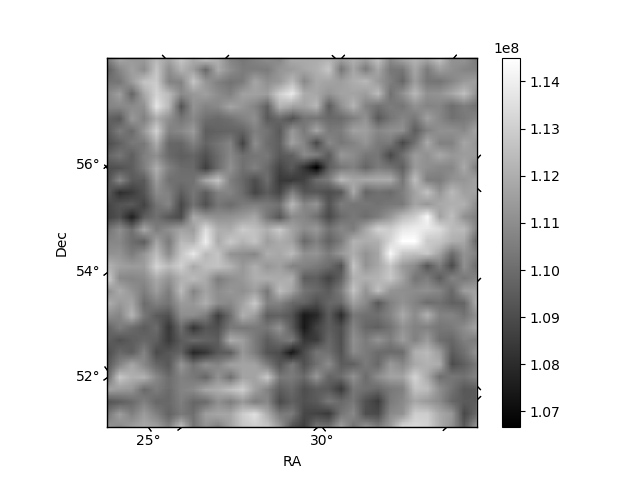
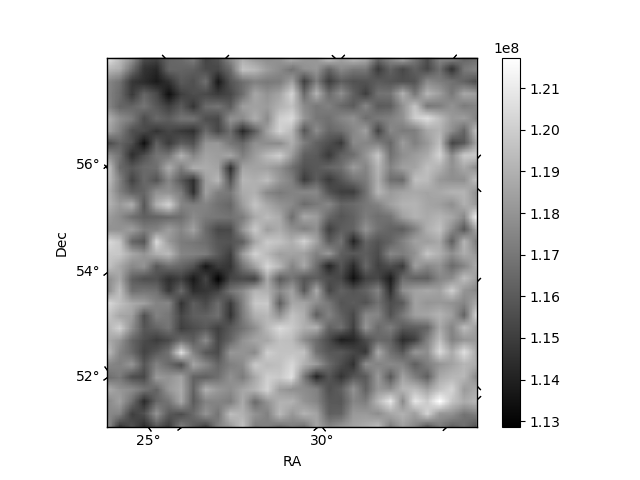
Histogram calculated using DETX and DETY for each event in the final _common_clean file
| Quadrant A | 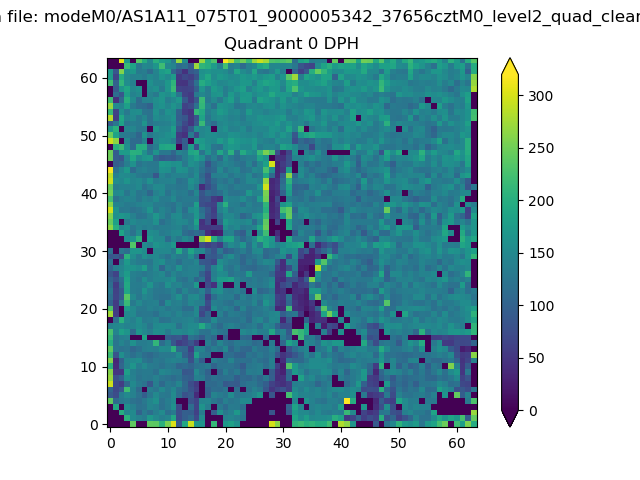 |
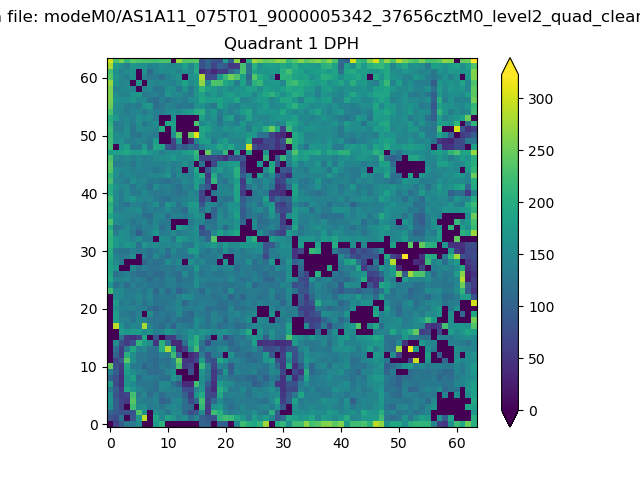 |
Quadrant B |
|---|---|---|---|
| Quadrant D | 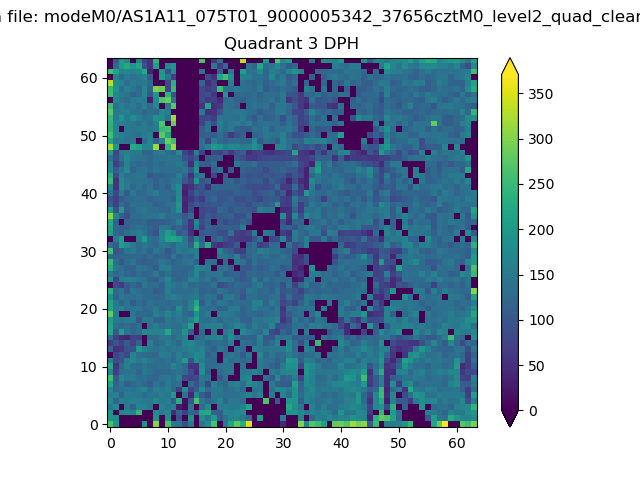 |
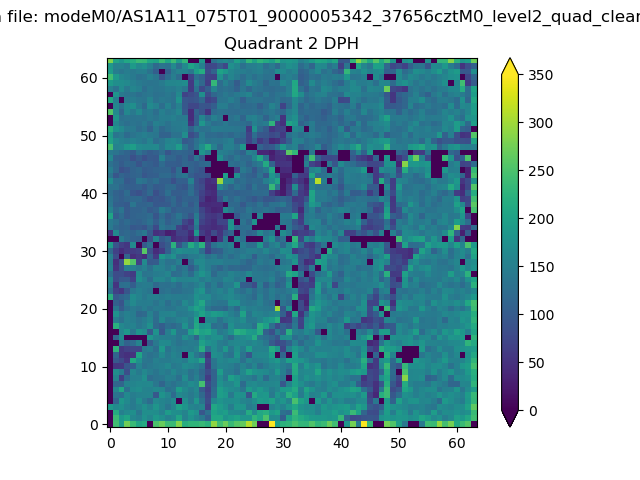 |
Quadrant C |
| Plot type | Count rate plots | Images |
|---|---|---|
| Comparison with Poisson distribution Blue bars denote a histogram of data divided into 1 sec bins. Red curve is a Poisson curve with rate = median count rate of data. |
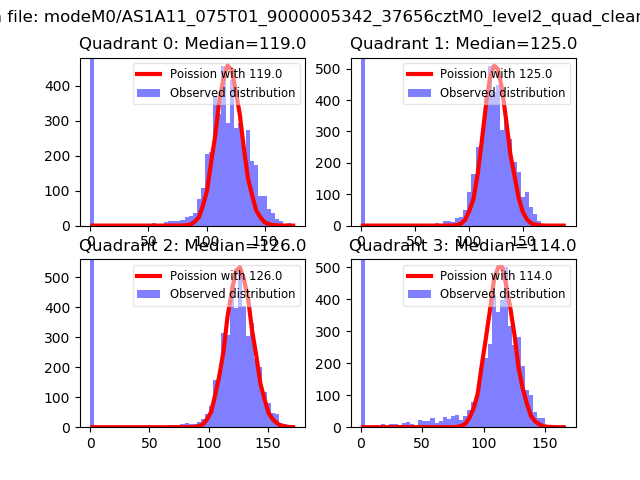 |
 |
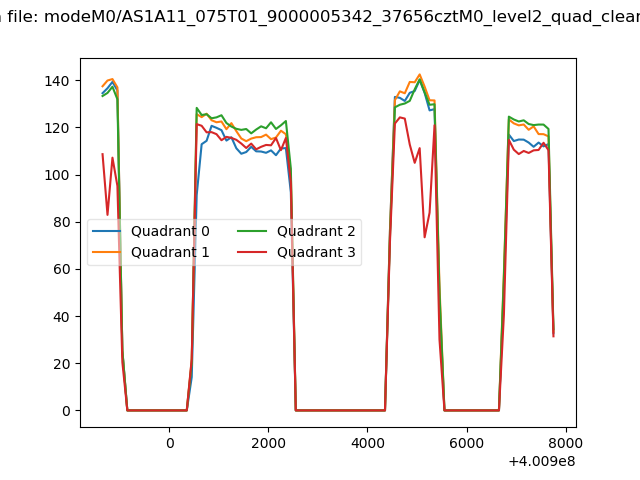
| Quadrant-wise count rates Data is divided into 100 sec bins |
 |
|
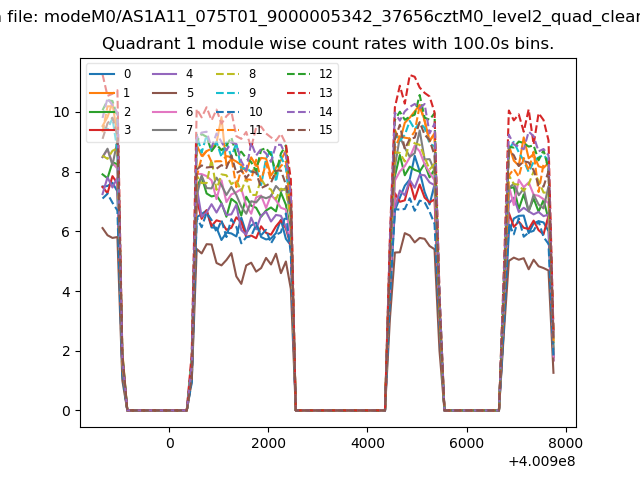
| Module-wise count rates for Quadrant A Data is divided into 100 sec bins |
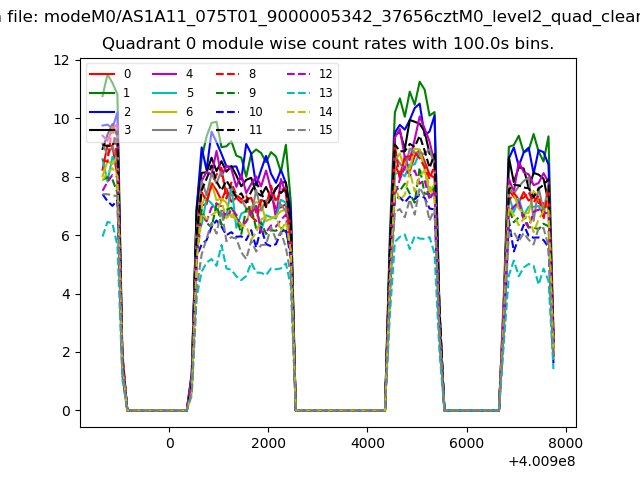 |
 |
| Module-wise count rates for Quadrant B Data is divided into 100 sec bins |
 |
 |
| Module-wise count rates for Quadrant C Data is divided into 100 sec bins |
 |
 |
| Module-wise count rates for Quadrant D Data is divided into 100 sec bins |
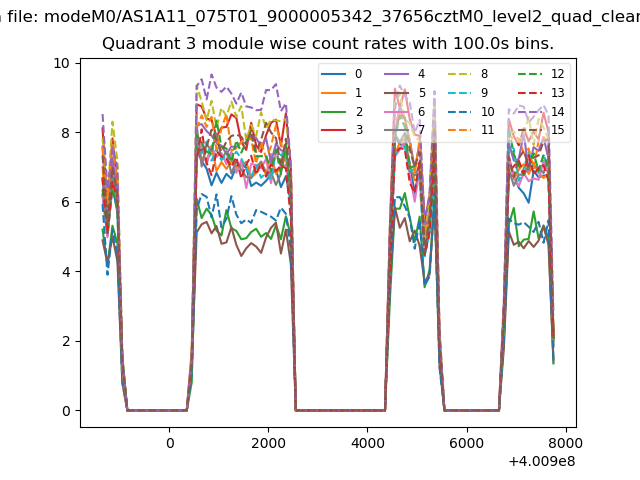 |
 |
| Parameter | Plot |
|---|---|
| CZT HV Monitor | 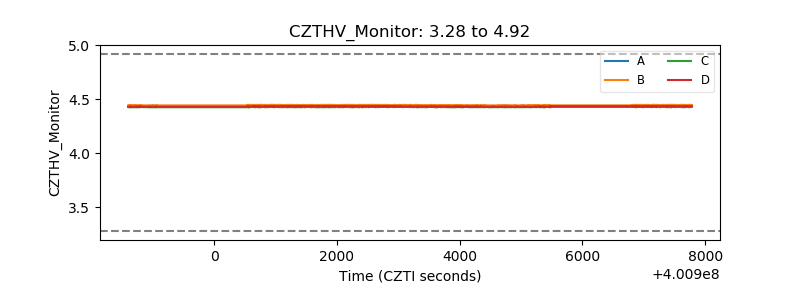 |
| D_VDD | 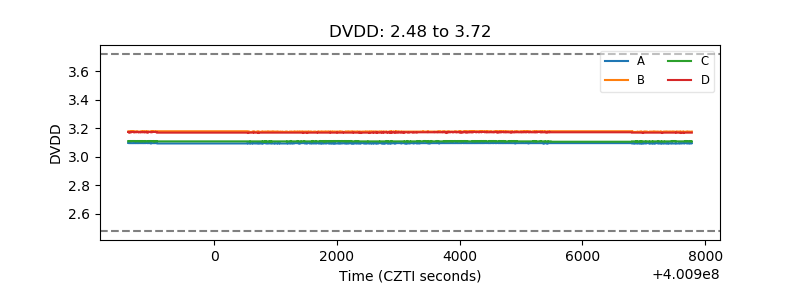 |
| Temperature 1 | 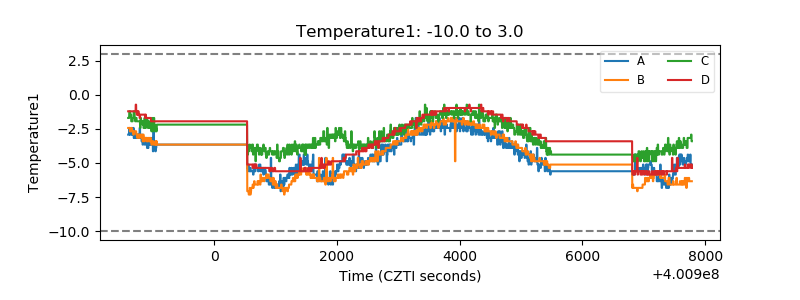 |
| Veto HV Monitor | 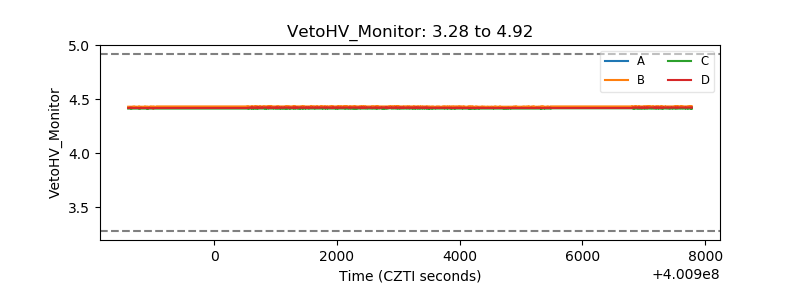 |
| Veto LLD | 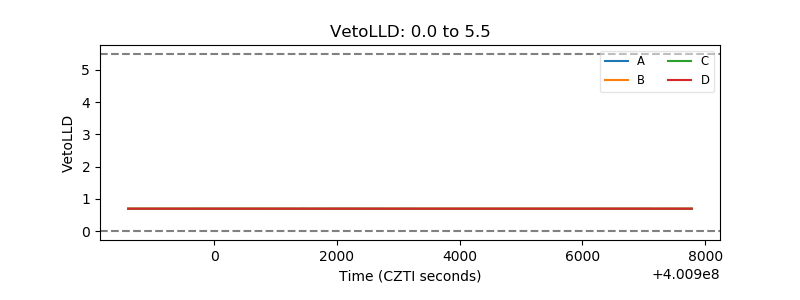 |
| Alpha Counter |  |
| _CPM_Rate | 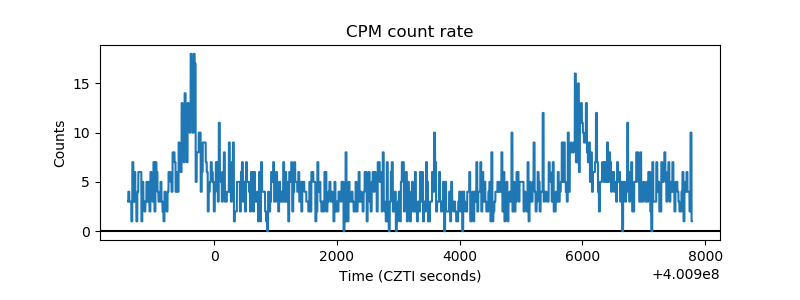 |
| CZT Counter | 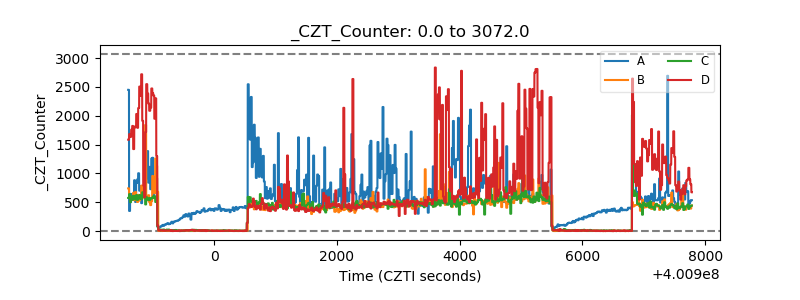 |
| +2.5 Volts monitor | 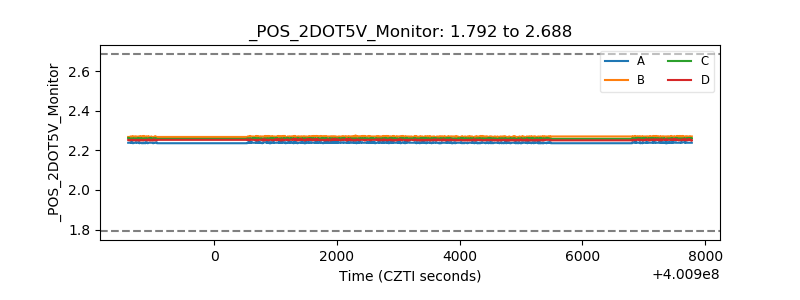 |
| +5 Volts monitor |  |
| _ROLL_ROT | 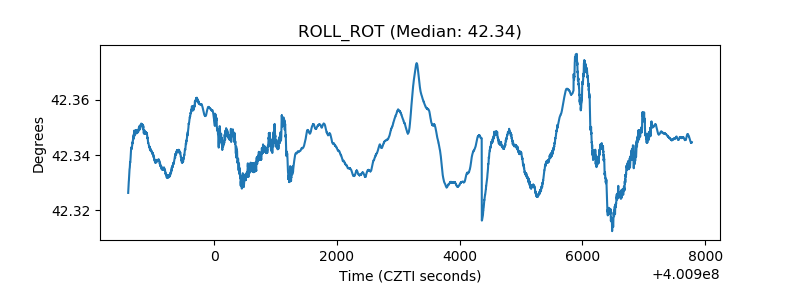 |
| _Roll_DEC | 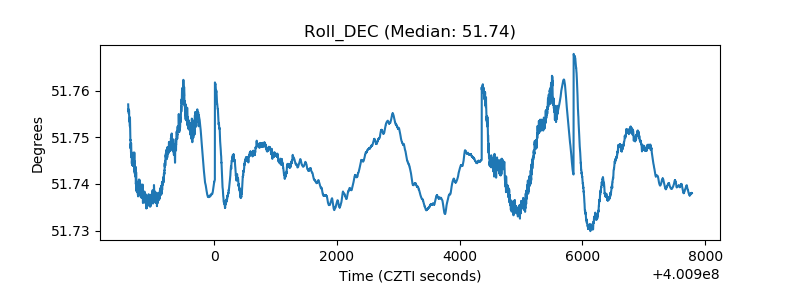 |
| _Roll_RA | 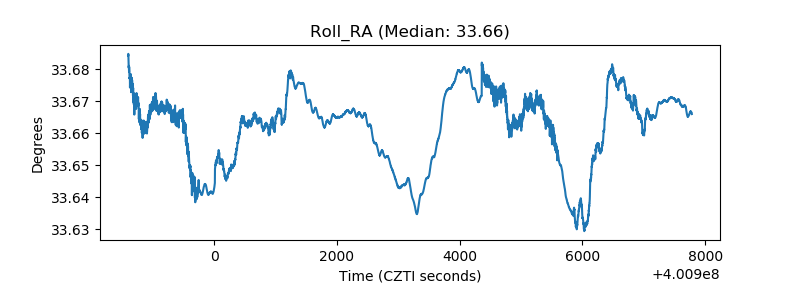 |
| Veto Counter | 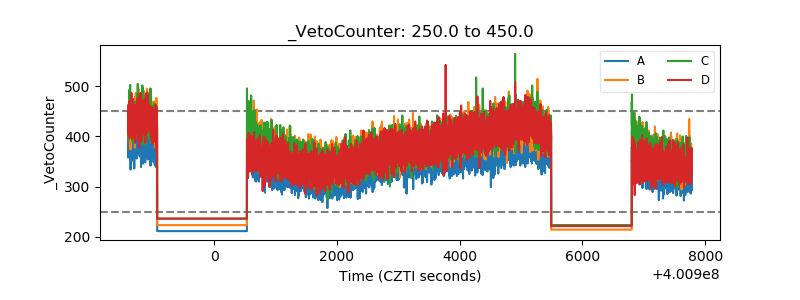 |