| Param | Original file | Final file |
|---|---|---|
| Filename | modeM0/AS1A11_075T01_9000005342_37657cztM0_level2.evt | modeM0/AS1A11_075T01_9000005342_37657cztM0_level2_quad_clean.evt |
| Size (bytes) | 547,349,760 | 85,970,880 |
| Size | 522.0 MB | 82.0 MB |
| Events in quadrant A | 4,018,933 | 537,313 |
| Events in quadrant B | 3,258,063 | 556,933 |
| Events in quadrant C | 3,240,357 | 561,426 |
| Events in quadrant D | 5,622,851 | 498,198 |
| Mode SS | |||
|---|---|---|---|
| Quadrant | BADHDUFLAG | Total packets | Discarded packets |
| A | 0 | 134 | 0 |
| B | 0 | 134 | 0 |
| C | 0 | 134 | 0 |
| D | 0 | 134 | 0 |
| Mode M0 | |||
|---|---|---|---|
| Quadrant | BADHDUFLAG | Total packets | Discarded packets |
| A | 0 | 16109 | 3 |
| B | 0 | 13841 | 2 |
| C | 0 | 13562 | 2 |
| D | 0 | 21184 | 2 |
| Mode M9 | |||
|---|---|---|---|
| Quadrant | BADHDUFLAG | Total packets | Discarded packets |
| A | 0 | 26 | 0 |
| B | 0 | 26 | 0 |
| C | 0 | 26 | 0 |
| D | 0 | 26 | 0 |
| Quadrant | Total seconds | Saturated seconds | Saturation percentage |
|---|---|---|---|
| A | 6437 | 57 | 0.885506% |
| B | 6437 | 29 | 0.450520% |
| C | 6437 | 8 | 0.124281% |
| D | 6437 | 467 | 7.254932% |
Noise dominated data is calculated using 1-second bins in cleaned event files. If a bin has >2000 counts, and if more than 50% of those come from <1% of pixels, then it is considered to be noise-dominated and hence unusable.
| Quadrant | # 1 sec bins | Bins with >0 counts | Bins with >2000 counts | High rate bins dominated by noise | Noise dominated (total time) | Noise dominated (detector-on time) | Marked lightcurve |
|---|---|---|---|---|---|---|---|
| A | 9064 | 6439 | 40 | 40 | 0.44% | 0.62% | 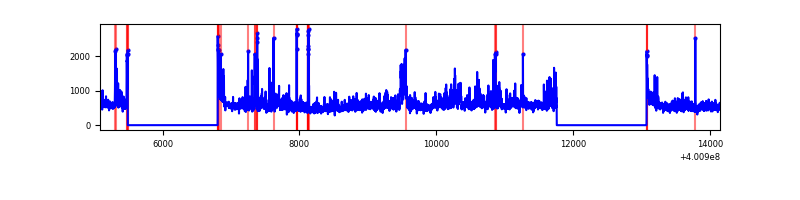 |
| B | 9064 | 6437 | 15 | 15 | 0.17% | 0.23% | 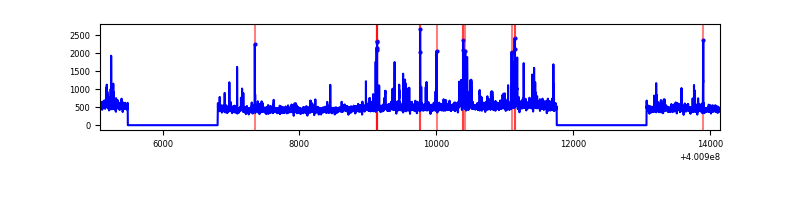 |
| C | 9064 | 6437 | 7 | 7 | 0.08% | 0.11% | 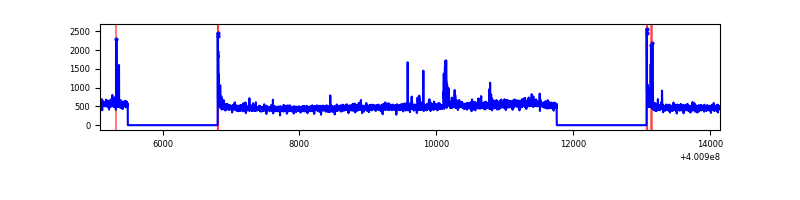 |
| D | 9064 | 6437 | 406 | 406 | 4.48% | 6.31% | 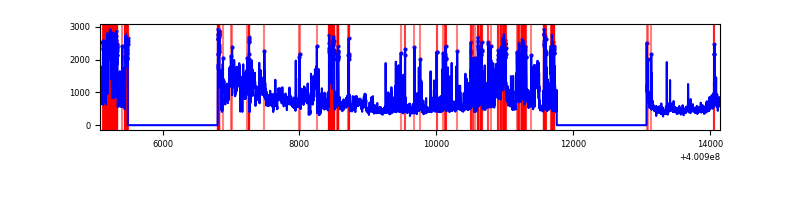 |
Top three noisy pixels from each quadrant. If the there are fewer than three noisy pixels in the level2.evt file, extra rows are filled as -1
| Pixel properties | Quadrant properties | ||||||
|---|---|---|---|---|---|---|---|
| Quadrant | DetID | PixID | Counts | Sigma | Mean | Median | Sigma |
| A | 15 | 222 | 667522 | 4540.19 | 731 | 717 | 146.9 |
| A | 10 | 83 | 354700 | 2410.23 | 731 | 717 | 146.9 |
| A | 9 | 143 | 118564 | 802.41 | 731 | 717 | 146.9 |
| B | 5 | 172 | 139698 | 979.81 | 735 | 716 | 141.8 |
| B | 15 | 85 | 55546 | 386.55 | 735 | 716 | 141.8 |
| B | 0 | 230 | 37642 | 260.33 | 735 | 716 | 141.8 |
| C | 15 | 214 | 296062 | 1751.1 | 722 | 726 | 168.7 |
| C | 14 | 254 | 62619 | 366.97 | 722 | 726 | 168.7 |
| C | 0 | 10 | 45913 | 267.92 | 722 | 726 | 168.7 |
| D | 12 | 227 | 1778392 | 10589.33 | 695 | 677 | 167.9 |
| D | 4 | 239 | 378156 | 2248.53 | 695 | 677 | 167.9 |
| D | 2 | 249 | 270375 | 1606.51 | 695 | 677 | 167.9 |
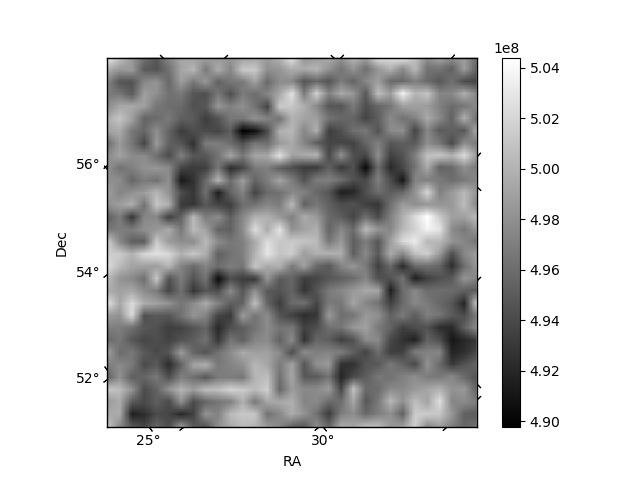
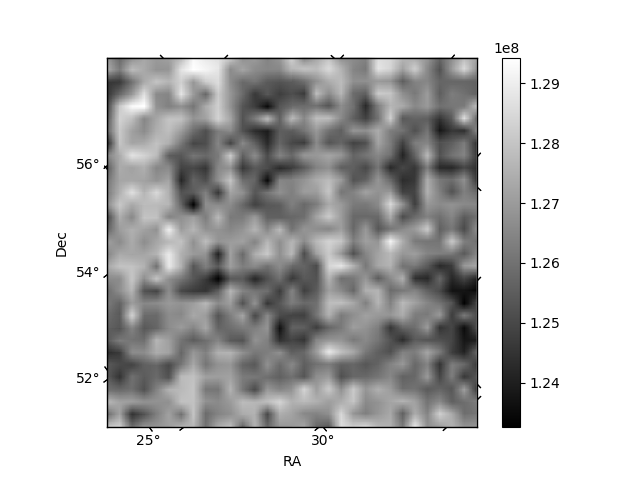
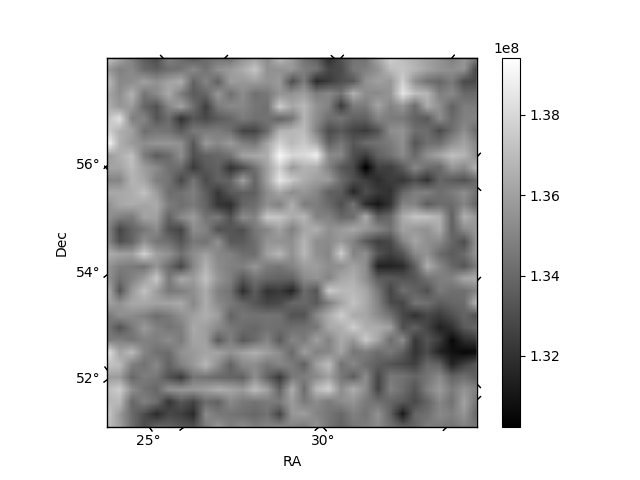
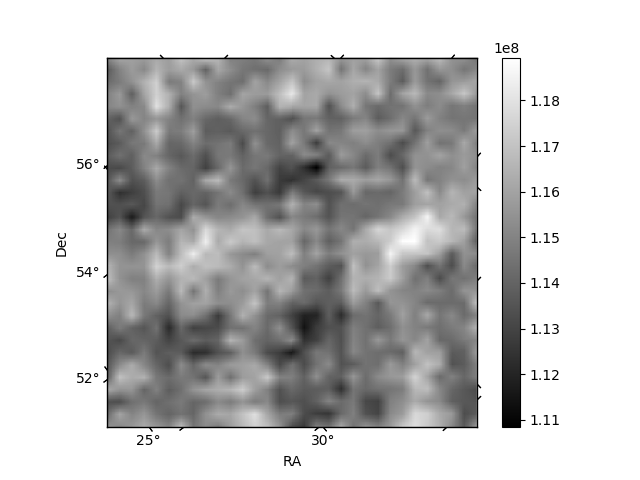
Histogram calculated using DETX and DETY for each event in the final _common_clean file
| Quadrant A | 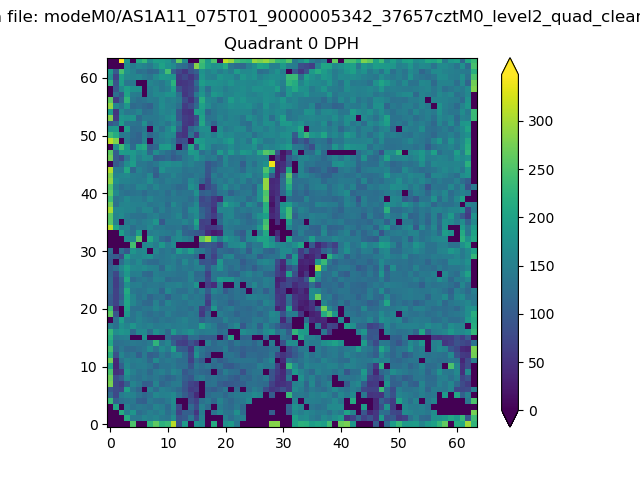 |
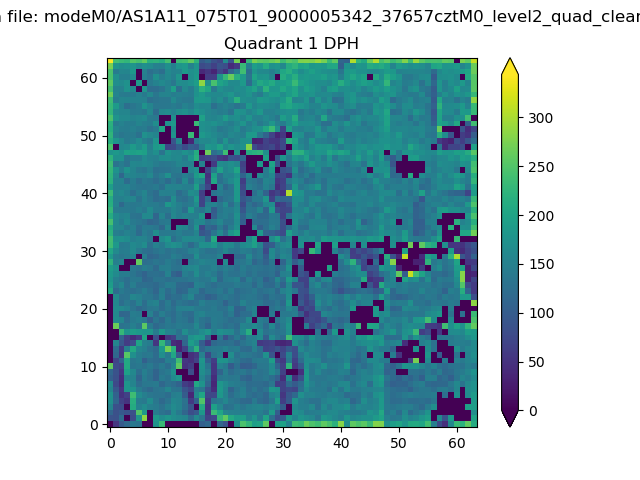 |
Quadrant B |
|---|---|---|---|
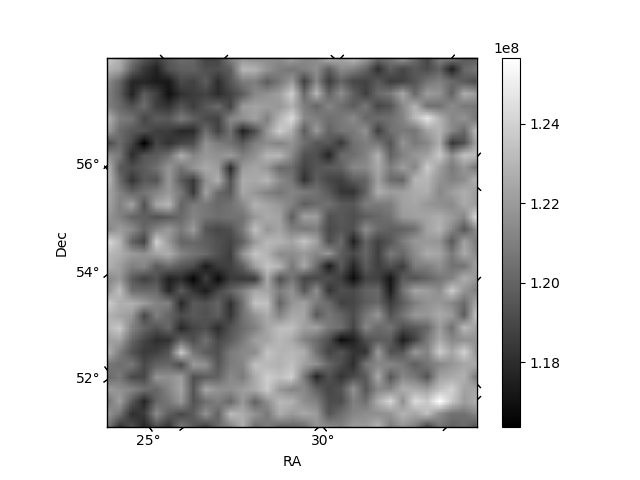
| Quadrant D | 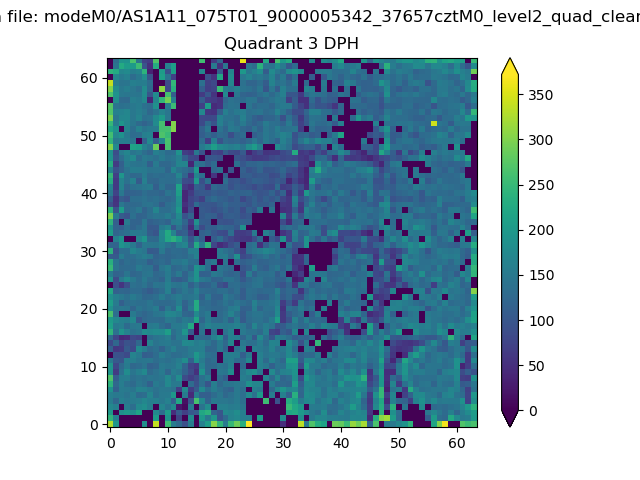 |
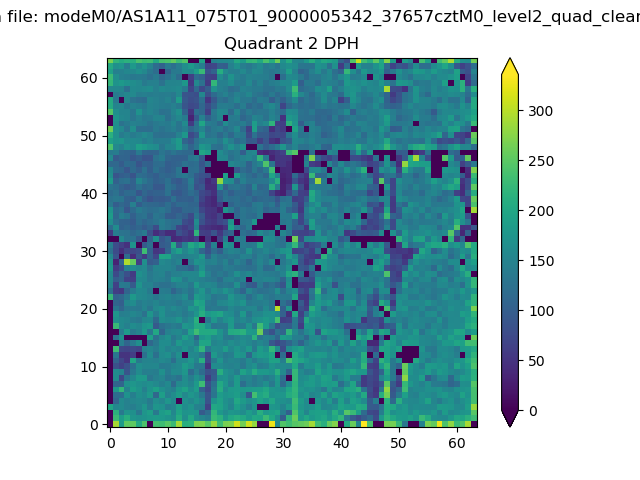 |
Quadrant C |
| Plot type | Count rate plots | Images |
|---|---|---|
| Comparison with Poisson distribution Blue bars denote a histogram of data divided into 1 sec bins. Red curve is a Poisson curve with rate = median count rate of data. |
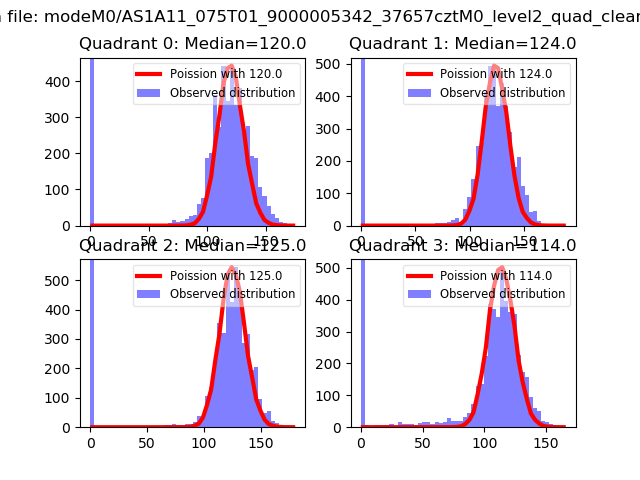 |
 |
| Quadrant-wise count rates Data is divided into 100 sec bins |
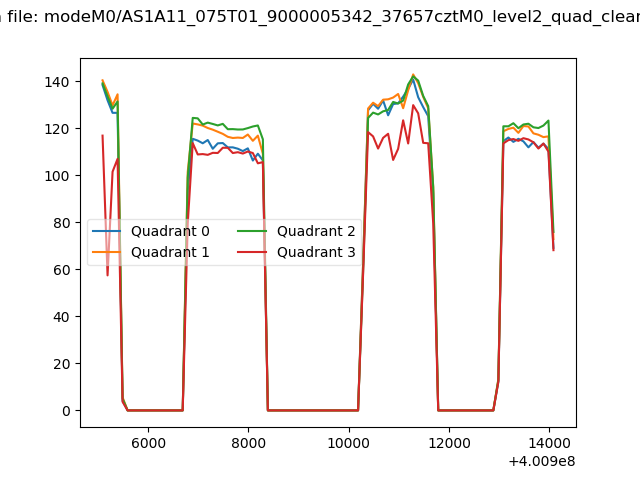 |
|
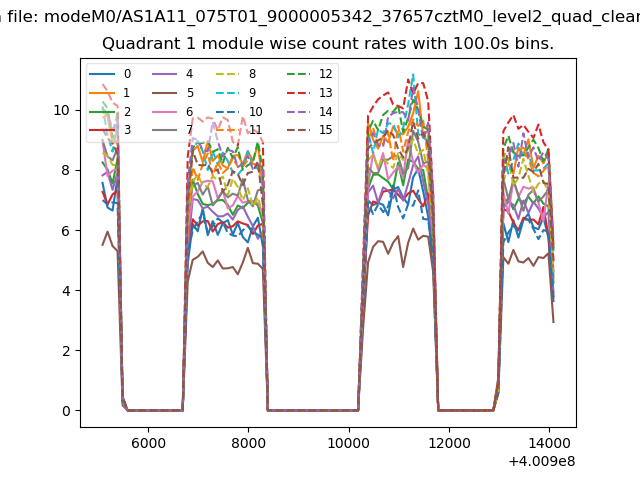
| Module-wise count rates for Quadrant A Data is divided into 100 sec bins |
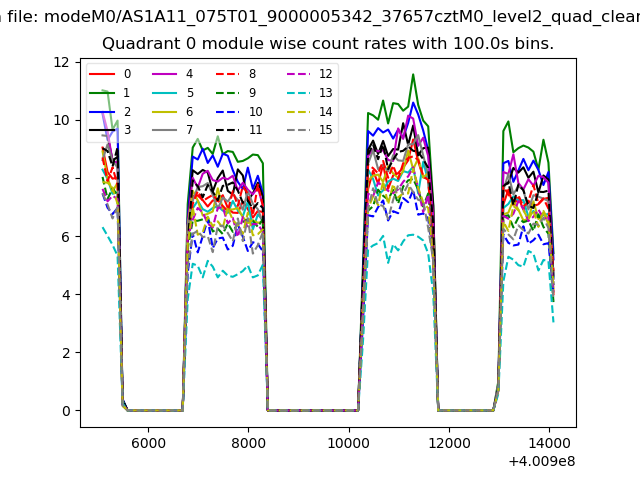 |
 |
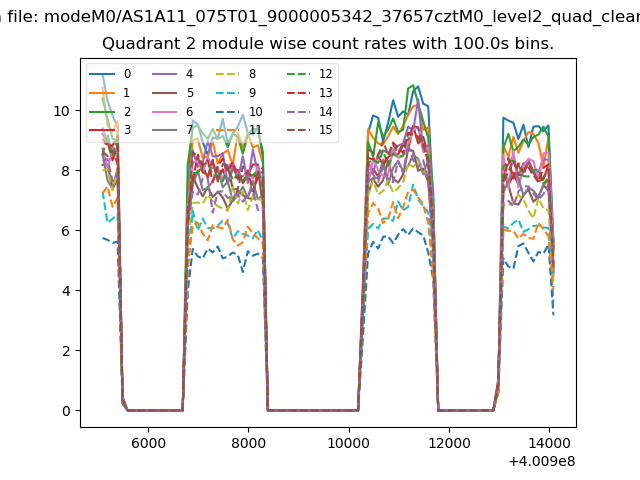
| Module-wise count rates for Quadrant B Data is divided into 100 sec bins |
 |
 |
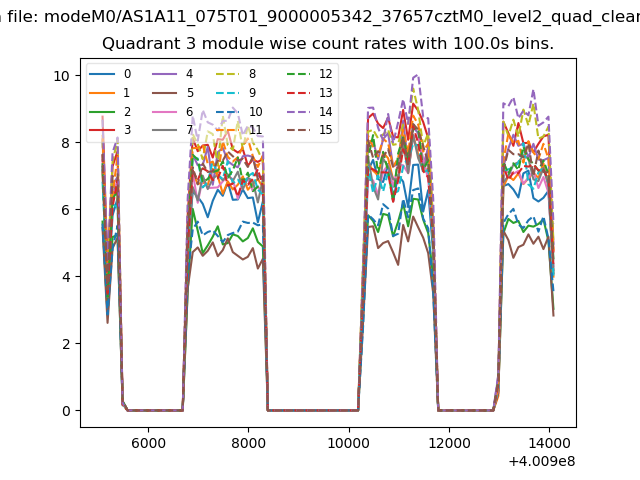
| Module-wise count rates for Quadrant C Data is divided into 100 sec bins |
 |
 |
| Module-wise count rates for Quadrant D Data is divided into 100 sec bins |
 |
 |
| Parameter | Plot |
|---|---|
| CZT HV Monitor | 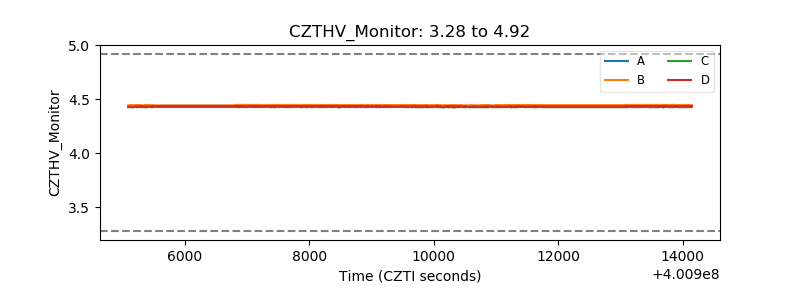 |
| D_VDD | 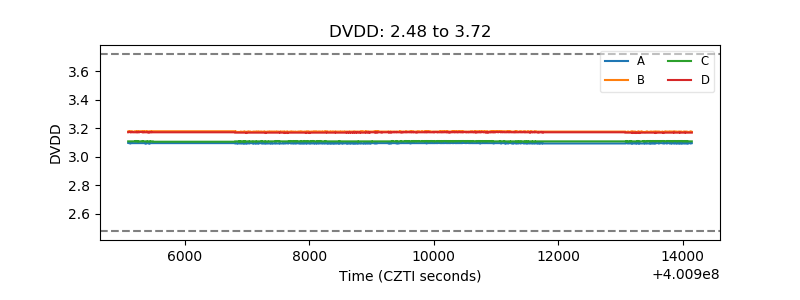 |
| Temperature 1 | 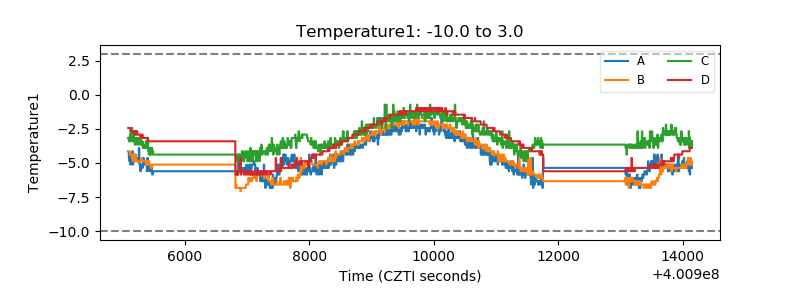 |
| Veto HV Monitor | 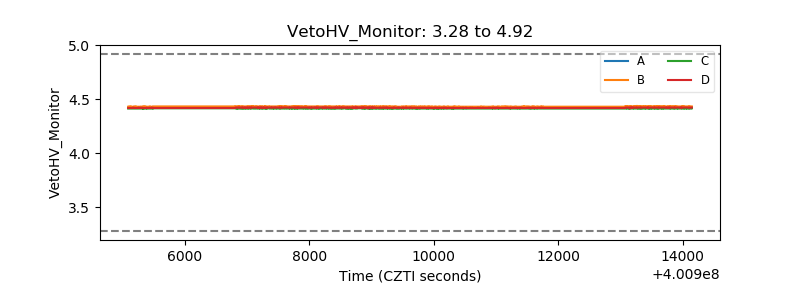 |
| Veto LLD | 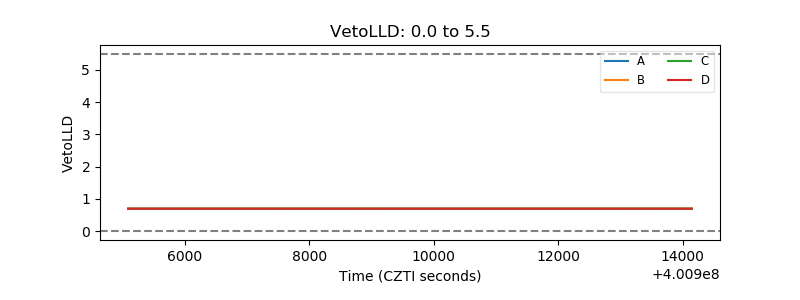 |
| Alpha Counter | 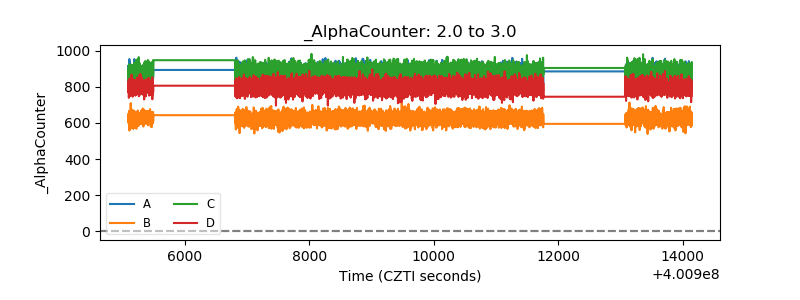 |
| _CPM_Rate | 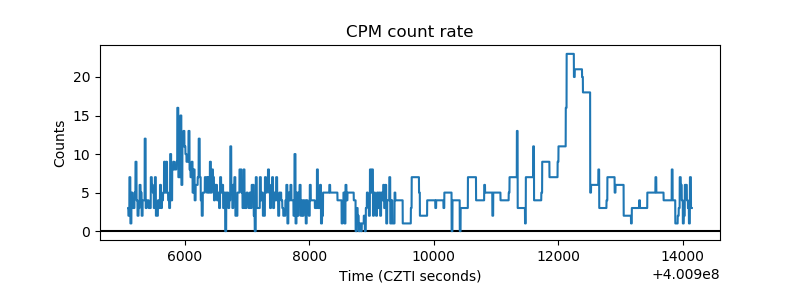 |
| CZT Counter | 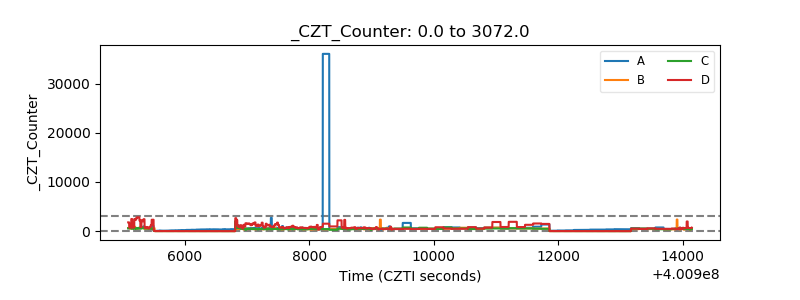 |
| +2.5 Volts monitor | 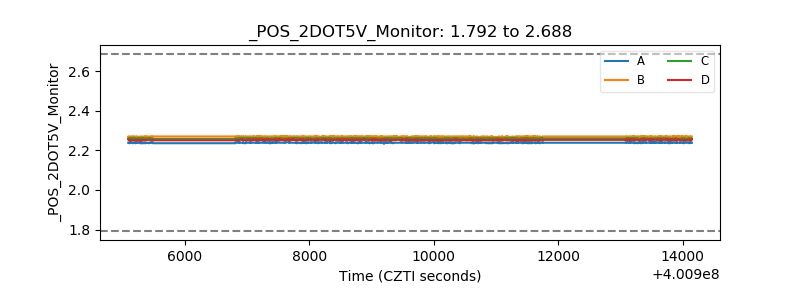 |
| +5 Volts monitor | 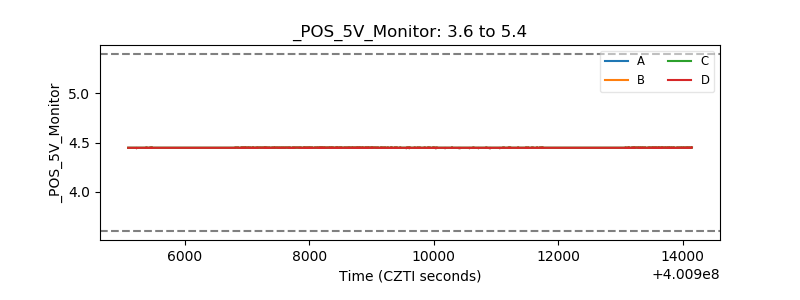 |
| _ROLL_ROT | 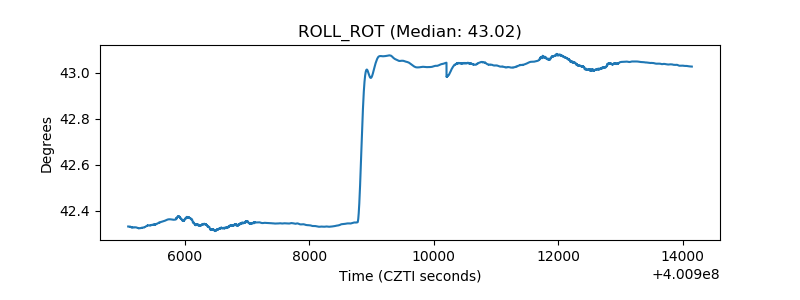 |
| _Roll_DEC | 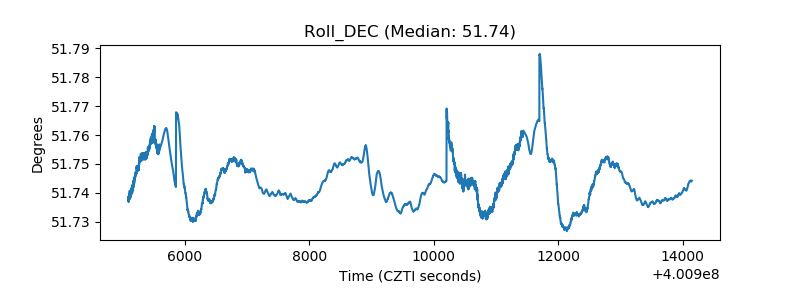 |
| _Roll_RA | 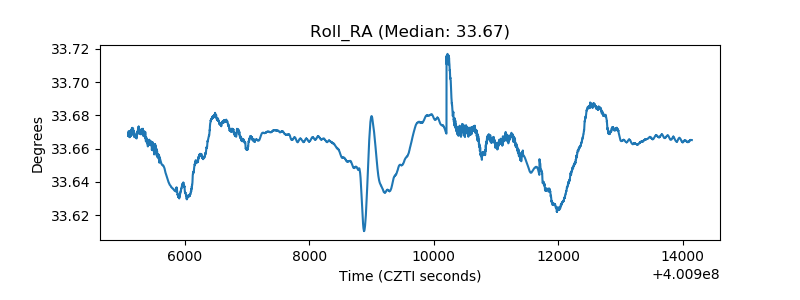 |
| Veto Counter | 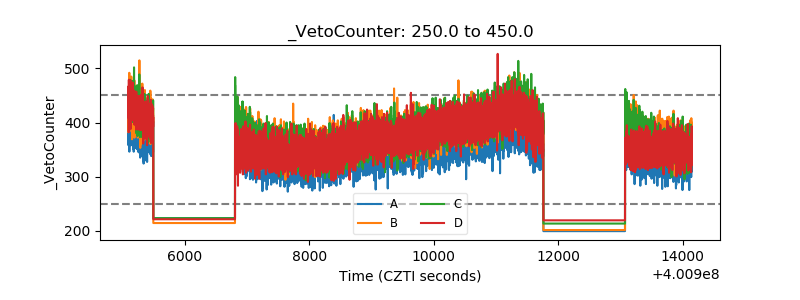 |